


Abstract
Most B-Raf proto-oncogene (BRAF)–mutant melanoma tumors respond initially to BRAF inhibitor (BRAFi)/mitogen-activated protein kinase kinase 1 inhibitor (MEKi) therapy, although few patients have durable long-term responses to these agents. The goal of this study was to use an unbiased computational approach to identify inhibitors that reverse an experimentally derived BRAFi resistance gene expression signature. Using this approach, we found that ibrutinib effectively reverses this signature, and we demonstrate experimentally that ibrutinib resensitizes a subset of BRAFi-resistant melanoma cells to vemurafenib. Ibrutinib is used clinically as an inhibitor of the Src family kinase Bruton tyrosine kinase (BTK); however, neither BTK deletion nor treatment with acalabrutinib, another BTK inhibitor with reduced off-target activity, resensitized cells to vemurafenib. These data suggest that ibrutinib acts through a BTK-independent mechanism in vemurafenib resensitization. To better understand this mechanism, we analyzed the transcriptional profile of ibrutinib-treated BRAFi-resistant melanoma cells and found that the transcriptional profile of ibrutinib was highly similar to that of multiple Src proto-oncogene kinase inhibitors. Since ibrutinib, but not acalabrutinib, has appreciable off-target activity against multiple Src family kinases, it suggests that ibrutinib may be acting through this mechanism. Furthermore, genes that are differentially expressed in ibrutinib-treated cells are enriched in Yes1-associated transcriptional regulator (YAP1) target genes, and we showed that ibrutinib, but not acalabrutinib, reduces YAP1 activity in BRAFi-resistant melanoma cells. Taken together, these data suggest that ibrutinib, or other Src family kinase inhibitors, may be useful for treating some BRAFi/MEKi-refractory melanoma tumors.
SIGNIFICANCE STATEMENT MAPK-targeted therapies provide dramatic initial responses, but resistance develops rapidly; a subset of these tumors may be rendered sensitive again by treatment with an approved Src family kinase inhibitor—ibrutinub—potentially providing improved clinical outcomes.
Introduction
Approximately 90% of melanoma tumors harbor activating mutations in the MAPK pathway, and most of these tumors have B-Raf proto-oncogene (BRAF)V600 mutations (Hodis et al., 2012). Most BRAF-mutant melanoma tumors initially respond to BRAF inhibitors; however, this response is often short-lived, and most tumors develop resistance (Larkin et al., 2014; Robert et al., 2015). Mechanisms of resistance to BRAF inhibitor (BRAFi)/mitogen-activated protein kinase kinase 1 inhibitor (MEKi) therapy most commonly occur through reactivation of the mitogen activated protein kinase (MAPK) pathway (Nazarian et al., 2010; Poulikakos et al., 2011; Shi et al., 2012; Shi et al., 2014; Van Allen et al., 2014; Hugo et al., 2015; Johnson et al., 2015; Moriceau et al., 2015; Shaffer et al., 2017; Song et al., 2017). However, there are few if any effective clinical interventions that overcome BRAFi resistance after it develops. In this study, we sought to identify compounds that reverse a BRAFi resistance gene signature. This systems-based approach has been widely explored in cancer drug discovery (Lamb et al., 2006; Jahchan et al., 2013; Chen et al., 2017a; Chen et al., 2017b; Subramanian et al., 2017), yet few studies have investigated resistance in melanoma. Ultimately, the goal is to identify drugs that could be combined with BRAFi/MEKi therapy to prevent or reverse drug resistance.
One advantage to using this approach is that it allows for the identification of compounds whose effects may result from complex polypharmacology. There are several examples of the clinical utility of drugs that exhibit polypharmacology, including crizotinib, afatinib, ceritinib, dasatinib, erlotinib, nilotinib, ponatinib, and imatinib (Antolin et al., 2016). In the case of imatinib, it was first developed to inhibit a BCR-ABL fusion protein in chronic myeloid leukemia (Buchdunger et al., 1996; Druker et al., 1996; Deininger et al., 1997). But later imatinib was used to target dermatofibrosarcoma protuberans tumors harboring gene fusions that result in aberrant platelet-derived growth factor receptor (PDGFR) activation. It is also clinically used to treat gastrointestinal stromal tumors that have activating PDGFRA or KIT proto-oncogene mutations since imatinib has off-target activity against PDGFR and KIT proto-oncogene (Shimizu et al., 1999; Greco et al., 2001; Joensuu et al., 2001; Sjoblom et al., 2001; Tuveson et al., 2001; Rubin et al., 2002). Several molecules, many of which are not kinase inhibitors, are currently under clinical investigation and have a mechanism of action linked to previously unappreciated off-target effects (Lin et al., 2019). These examples likely represent only a fraction of circumstances in which kinase inhibitor polypharmacology is clinically relevant. Because of this, there have been recent large-scale efforts to profile kinase inhibitor polypharmacology (Klaeger et al., 2017). Defining the entire polypharmacology network will likely result in a sizeable increase in the number of clinically actionable applications.
The goal of this exploratory study is to perform an unbiased computational screen to identify chemical compounds that reverse BRAFi resistance in melanoma cells. In this study we identify a new role for ibrutinib, a US Food and Drug Administration (FDA)–approved Bruton tyrosine kinase (BTK) inhibitor, in reversing BRAFi resistance in melanoma in silico and in vitro. Our studies suggest that ibrutinib may modulate Yes1-associated transcriptional regulator (YAP1) activation in at least some BRAFi-resistant melanoma cells. YAP1 is a transcriptional regulator that can function as a co-activator or a co-repressor for different genes (Kim et al., 2015). YAP1 activity is regulated by the actin cytoskeleton, as well as through changes in the phosphorylation state of YAP1 (Zhao et al., 2007; Oka et al., 2008; Wada et al., 2011; Zhao et al., 2012). Some phosphorylation events on YAP1 by large tumor suppressor kinase 1/2 lead to inactivation and subsequent proteasomal degradation (Zhao et al., 2010), whereas phosphorylation at other sites, targeted by YES Proto-Oncogene 1, Src Family Tyrosine Kinase (YES1) and other kinases, is critical for YAP1 nuclear translocation and activation (Rosenbluh et al., 2012). YAP1 is activated in BRAFi-resistant melanoma cells, and silencing or deletion of YAP1 reverses BRAFi resistance (Hugo et al., 2015; Lin et al., 2015; Kim et al., 2016; Fisher et al., 2017; Misek et al., 2020). In addition to melanoma, YAP1 has been implicated in many other cancer types, including breast cancer (Chen et al., 2012), glioblastoma (Orr et al., 2011), pancreatic cancer (Zhang et al., 2014), hepatocellular carcinoma (Tschaharganeh et al., 2013), and non-small cell lung cancer (Chaib et al., 2017). Despite the importance of YAP1 in cancer, it is still difficult to pharmacologically target YAP1. Verteporfin, a drug used to treat macular degeneration, blocks YAP1–TEA domain transcription factor (TEAD) activity in vitro but in some models has limited efficacy in vivo (Lui et al., 2019). Since YAP1 activity is regulated by its phosphorylation state, it may be possible to use the polypharmacology of FDA-approved kinase inhibitors to indirectly block YAP1 activation. Our findings suggest that ibrutinib can block the nuclear accumulation of YAP1 and also alter the expression of YAP1 target genes.
Materials and Methods
Cell Lines, Reagents, and Antibodies
Parental (denoted by a P suffix in the cell line name) and matched isogenic BRAFi-resistant cells (denoted by an R suffix in the cell line name) were either a gift (M229P/R, M238P/R) from Dr. Roger Lo (University of California, Los Angeles) or generated in our laboratory (UACC62P/R). These cells were generated and cultured as described below (Misek et al., 2020).
Luteolin (#10004161), BVT-948 (#16615), ketoprofen (#10006661), lestaurtinib (#12094), NG-Methyl-L-arginine (l-NMMA, #10005031), ibrutinib (#16274), acalabrutinib (#19899), fadrozole (#24272), letrozole (#11568), exemestane (#15008), and vemurafenib (#10618) were purchased from Cayman Chemical (Ann Arbor, MI). Pyrvinium pamoate (#HY-A0293) was purchased from MedChemExpress (Monmouth Junction, NJ). Clofilium tosylate (#C2365) was purchased from Sigma Aldrich (St. Louis, MO). All compounds (except l-NMMA) were diluted in DMSO to a stock concentration of 10 mM. l-NMMA was diluted in H2O to a stock concentration of 0.5 mM. All compounds were aliquoted and stored at −20°C.
Antibodies against YAP1 (#14074) and WW domain–containing transcription regular 1 (TAZ) (#83669) were purchased from Cell Signaling Technology (Danvers, MA). An antibody against Actin (#sc1616) was purchased from Santa Cruz Biotechnology (Dallas, TX). Donkey anti-mouse 800 (#926-32212), donkey anti-goat 680 (#926-68074), and donkey anti-rabbit 680 (#926-68073) immunoblotting secondary antibodies were purchased from LI-COR (Lincoln, NE). Anti-rabbit horseradish peroxidase (#7074) immunoblotting secondary was purchased from Cell Signaling Technology. Alexa Fluor goat anti-rabbit 488 (#A11034) and donkey anti-goat 488 (#A11055) were purchased from Invitrogen (Carlsbad, CA).
Cell Culture
Cells were cultured in Dulbecco’s modified Eagle’s medium (#11995-065; ThermoFisher, Waltham, MA) supplemented with 10% FBS (#10437-028; ThermoFisher) and 1% antibiotic-antimycotic (#15240062; ThermoFisher) and were passaged at approximately 75% confluence. The BRAFi-resistant cell line variants were maintained in culture medium supplemented with 2 µM vemurafenib. Vemurafenib was removed from the culture medium when cells were seeded for experiments, except where otherwise indicated. Cells were routinely tested for mycoplasma contamination by 4′,6-diamidino-2-phenylindole staining. Short tandem repeat profiling on all cell lines was performed at the Michigan State University genomics core. In all cases, isogenic pairs of cell lines had identical short tandem repeat profiles. After thawing, cells were used for either 2 months or 20 passages, whichever came first. In all experiments the cell concentration, but not density, was normalized. For all experiments the cells were seeded and analyzed at subconfluent cell densities.
Cloning and Clustered Regularly Interspaced Short Palindromic Repeats
For clustered regularly interspaced short palindromic repeats (CRISPR) experiments, the single guide RNAs were as follows: sgControl (5′-TCCCCGAGACCATCTTAGGG-3′), sgBTK#1 (5′-ATGAGTATGACTTTGAACGT-3′), and sgBTK#2 (5′-CCCTTCATCATATACAACCT-3′). These guide sequences were cloned into pLentiCRISPRv2-Puro (from Feng Zhang, Addgene plasmid #52961). Successful cloning was confirmed by Sanger sequencing. To measure knockout efficiency, amplicons containing the CRISPR cut sites were amplified from the genomic DNA with polymerase chain reaction, and the ratio of frameshifted/functional DNA species was measured with Sanger sequencing using the Tracking of Indels by Decomposition (TIDE) algorithm (Brinkman et al., 2014). The primers for genomic DNA amplification and Sanger sequencing are listed in Supplemental Table 1.
Virus Preparation and Infection
HEK-293T cells were seeded into 10-cm plates at a density of 4 × 10⁶ cells per plate, and the cells were allowed to attach overnight. The next day the cells were transfected with a plasmid cocktail containing 5000 ng of the pLentiCRISPRv2 plasmid, 5000 ng of psPAX2 (Addgene plasmid #12260), 500 ng of pMD2.G (Addgene plasmid #12259), and 20 µl of Lipofectamine 2000 (#11668019; ThermoFisher) in 400 µl of OptiMEM (#31985070; ThermoFisher). The next morning the medium was changed to 10 ml of fresh complete culture medium, and the next day each plate was supplemented with an additional 5 ml of culture medium. After 24 hours, the culture medium was harvested and filtered through a 0.45-µm syringe filter. Virus was stored at 4°C and was used within 2 weeks.
Melanoma cells were seeded into 10-cm plates at a density of 5 × 10⁵ cells per plate in 10 ml of complete culture medium. While the cells were still in suspension, 3 ml of viral supernatant was added to each plate. The cells were incubated with virus overnight; then the medium was changed to 10 ml of fresh medium. After 24 hours, the medium was changed to 10 ml of fresh medium supplemented with puromycin (2 µM). The cells were cultured in the presence of selection antibiotic until all the cells on the kill control plate died (approximately 3 days). Individual clones for the CRISPR cell lines were not selected, but instead we used a pooled infection approach. Validation of CRISPR knockout efficiency was performed by Sanger sequencing as described above.
Viability Experiments
Cells were seeded into 384-well tissue culture plates (#6007689; PerkinElmer, Waltham, MA) at a density of 1000 cells per well in 20 µl of growth medium. The next day, compounds were prediluted in growth medium then added to the 384-well plates so that the final volume of each well was 40 µl. A PBS or growth medium barrier was added to the outer wells of the plate to limit evaporation. Cells were cultured under these conditions for 72 hours. To assess viability, 8 µl of CellTiter-Glo (#G7573; Promega, Madison, WI) was added to each well. Plates were incubated on orbital shaker for 5 minutes at room temperature, then briefly centrifuged (4000 rpm, 60 seconds) before being read on a Bio-Tek Synergy Neo plate reader with the #11 and #41 Ex/Em filter cubes. Viability signal is plotted versus log (vemurafenib concentration) for each treatment condition using a four-parameter logistic curve model.
Flow Cytometry
Cell Cycle
Cells were rinsed once in PBS before being trypsinized, washed once in PBS, and immediately fixed in 70% ethanol for 20 minutes at room temperature. The cells were washed once and were resuspended in PBS supplemented with 20 µg/ml propidium iodide (#P1304MP, ThermoFisher) and 200 µg/ml RNaseA. The cells were briefly mixed and were incubated on ice for 20 minutes. After incubation, the cells were filtered through a 70 µM filter and were run on an Accuri C6 flow cytometer (BD Biosciences, Franklin Lakes, NJ). Data were analyzed with the FCS Express flow cytometry analysis software package.
Annexin V/Propidium Iodide
Both floating and adherent cells were collected by trypsinization. The cells were pelleted, washed once in PBS, and then resuspended in 200 µl of Annexin V binding buffer (10 mM HEPES pH 7.4, 140 mM NaCl, 2.5 mM CaCl2) and 1 µl of allophycocyanin-conjugated Annexin V (#A35110; ThermoFisher) on ice in the dark for 20 minutes. The cells were pelleted and resuspended in 500 µl Annexin V binding buffer with 2 µg/ml propidium iodide. After 20 minutes the cells were filtered through a 70 µM filter and were run on an Accuri C6 flow cytometer. Data were analyzed with the FCS Express flow cytometry analysis software package.
DEVD Assay
Both the floating and attached cells were collected, rinsed as described above and then lysed in 200 µl of Triton-X100 lysis buffer (25 mM HEPES, 100 mM NaCl, 1 mM EDTA, 10% glycerol, 1% Triton X-100) supplemented with protease/phosphatase inhibitors. The lysates were centrifuged at 20,000g for 15 minutes. In a 384-well plate, 10 µl of 2× Cytobuffer [100 mM 1,4-piperazinediethanesulfonic acid pH 7.4, 20% glycerol, 2 mM EDTA, 1 mM dithiothreitol, 40 µM DEVD–7-amino-4-trifluoromethylcoumarin (Arango et al., 2012) (#ALX260032M005; Enzo Biochem, Farmingdale, NY)], 5 µl of lysis buffer, and 5 µl of cellular lysate were added to each well. In control wells an extra 5 µl of lysis buffer was added in place of the cellular lysate. The plates were prepared on ice to limit enzymatic activity. The plates were read on a Bio-Tek Synergy Neo plate reader at an excitation wavelength of 400 nm and an emission wavelength of 500 nm. Reads were taken every 60 seconds for 1 hour, and caspase 3/7 activity was expressed as fold change in nanomolar 7-amino-4-trifluoromethylcoumarin per milligram protein per minute.
Colony Formation
Cells were seeded into six-well plates at a density of 1000 cells per well and were allowed to attach overnight. The next day the medium was changed, and the cells were treated as described in the figure legends. The growth medium was changed every 3 days. After 14 days the cells were fixed in 3.7% formaldehyde and the cells were stained with crystal violet. Images of the plates were acquired on a flatbed scanner.
Immunofluorescence Staining
Cells were seeded into eight-well chamber slides and were treated as indicated in the figure legends. Cells were fixed with 3.7% formaldehyde for 15 minutes, and then blocked in 2% bovine serum albumin PBS-Triton X-100 (0.1%) for 1 hour at room temperature. Cells were incubated overnight at 4°C in primary antibody at a (1:1000) dilution in blocking buffer. Cells were washed three times in PBS, then were incubated in the appropriate secondary antibody at a (1:1000) dilution for 1 hour at room temperature. Cells were washed three times in PBS, then were mounted in ProLong Gold Antifade plus 4′,6-diamidino-2-phenylindole (ThermoFisher, #P36935). Slides were cured overnight at room temperature and then transferred to 4°C. Slides were imaged on a Nikon TE2000-U fluorescence microscope at 20× magnification.
For all immunofluorescence experiments, images were blinded with an R script before quantification. We repeated all immunofluorescence experiments at least three times and typically analyzed 5 to 10 fields per biologic replicate. In total we analyzed at least 200 cells per experimental group, but in most cases over 1000 cells per experimental group. For subcellular localization experiments, data are represented as a stacked bar graph wherein the fraction of cells that have predominantly nuclear, pan-cellular, or cytosolic localization is plotted as a fraction of the total cells. A cell was considered to have “cytosolic” localization if there was a clear nuclear exclusion. Inversely, a cell was described as having “nuclear” localization if the staining intensity was appreciably higher than in the cytosol. If there was no apparent difference between the nuclear and cytosolic staining, then the cell was described as having “pan-cellular” distribution.
RNA-Sequencing Sample/Data Processing
Total cellular RNA was extracted from drug-treated M229R cells using the Qiagen (Hilden, Germany) RNeasy kit (#74104) with three biologic replicates per cell line. All RNA samples had a RIN score greater than 8. Libraries were prepared using the Illumina TruSeq Stranded mRNA Library Preparation Kit; prepared libraries were quality controlled and quantified using a Qubit and Labchip Bioanalyzer. Libraries were pooled and run on a NovaSeq6000 instrument. Sequencing was performed by 2 × 150 bp paired-end read format. Base calling was done by Illumina RTA and converted to FASTQ using bcl2fastq software. Sequencing was performed at a depth of approximately 30 M reads per sample. Quality control was performed on the FASTQ files using FastQC version 0.11.5, and reads were trimmed using Trimmomatic version 0.33. Reads were mapped using HISAT2 version 2.1.0 and analyzed using HTSeq version 0.6.1. Differential gene expression was calculated using edgeR. Raw RNA sequencing (RNA-Seq) reads and processed HTSeq read counts are available on Gene Expression Omnibus under GSE145990. When appropriate, RNA-Seq data were upper quintile normalized prior to analysis.
Data Sets
Sources for the previously published RNA-Seq data used in this study are as follows. M229P/R and M238P/R RNA-Seq data were downloaded from GSE75313 (Song et al., 2017). UACC62P/R RNA-Seq data were previously generated by our group and were deposited under GSE115938 (Misek et al., 2020). The PRISM drug response data set was downloaded from the Cancer Dependency Map data download portal (depmap.org/portal/download).
Epigenetic Landscape In Silico Deletion Analysis
Epigenetic landscape in silico deletion analysis (LISA) was run on lisa.cistrome.org (Qin et al., 2020). Gene lists were filtered to include only significantly differentially expressed genes with a false discovery rate (FDR) less than 0.01. Gene set 1 was filtered to include only upregulated genes, and gene set 2 was filtered to include only downregulated genes. Only the top 500 genes were used in each list. In cases where there were fewer than 500 differentially expressed genes, only the genes that had an FDR less than 0.01 were included in the analysis. The chromatin immunoprecipitation sequencing output data were plotted as a scatter plot of enrichments in the upregulated versus downregulated gene sets.
Connectivity Map Analysis
The top 200 upregulated/downregulated genes with an FDR less than 0.01 were analyzed to identify Connectivity Map (CMap) classes that have similar gene expression perturbation signatures on the online clue.io portal. In cases where there were fewer than 200 upregulated or downregulated genes with an FDR less than 0.01, only genes that passed the FDR cutoff were included in the analysis.
Open Cancer Therapeutic Discovery Data Sets and RNA Sequence Processing
We used the same pipeline to process RNA-Seq samples from public databases such as The Cancer Genome Atlas, TARGET, Genotype-Tissue Expression, and Sequence Read Archive and compiled them into one single data set called Open Cancer Therapeutic Discovery (OCTAD) (Zeng et al., 2021). Whenever possible, RNA-Seq samples used in this study were processed using the same pipeline to mitigate batch effects. In addition, RUVg (Risso et al., 2014) was used to remove unwanted variation, and weakly expressed genes were removed while computing differentially expressed genes. Normalized raw counts were used for differential expression analysis, and transcripts per million was used for other analyses. The clustering of these samples with melanoma samples compared with nonmelanoma primary tumor samples demonstrates the feasibility of performing differential expression analysis between cell lines and tissue samples (Supplemental Fig. 1).
Disease Signature Creation
Gene expression data from BRAFi-resistant melanoma cell lines were compared with either 50 healthy normal skin samples from the Genotype-Tissue Expression database or BRAFV600E-mutant melanoma tumor samples to generate BRAFi resistance gene expression signatures. We used edgeR to perform differential expression analysis (log2 fold change >1, adjusted P < 0.001) (Robinson et al., 2010). The detailed data processing and parameter selection were detailed in the OCTAD study (Zeng et al., 2021). The enrichment of the genes in the BRAFi resistance gene signatures was computed with ssGSEA (Hanzelmann et al., 2013). The association of enrichment scores for both of the signatures with patient survival was computed and visualized using the survminer package. Patient mutation status and survival data were retrieved from cBioPortal (Gao et al., 2013). EnrichR was used for pathway enrichment analysis (Kuleshov et al., 2016).
Drug Prediction
The Library of Integrated Network-Based Cellular Signatures (LINCS) database containing gene expression profiles for compound-treated cells has been widely used for candidate drug prediction in our previous studies (Chen et al., 2015; Chen et al., 2017a). LINCS comprises 476,251 signatures and 22,268 genes including 978 landmark genes. The 1974 mapped drugs listed in the Repurposing Hub were considered in this study (Corsello et al., 2017). To compute Reverse Gene Expression Score (RGES), which is a quantitative metric of how well a compound reverses a gene signature, we first ranked genes based on their expression values in each drug signature. An enrichment score for each set of up- and downregulated disease genes was computed separately using a Kolmogorov-Smirnov-like statistic, followed by the combination of scores from both sides. The score is based on the number of the genes (up- or downregulated) at either the top or bottom of a drug-gene list ranked by expression change after drug treatment. One compound might have multiple available expression profiles because they were tested in various cell lines, drug concentrations, treatment durations, or even different replicates, resulting in multiple RGES values for one drug-disease prediction. We termed this score Summarized Reverse Gene Expression Score (sRGES). The computation of RGES and the summarization RGES were detailed elsewhere and recently implemented as a standalone R package (Zeng et al., 2021). Compounds were filtered to include only compounds that had a sample size greater than 1 in the LINCS L1000 data set and were filtered to exclude compounds that were antineoplastic or were previously studied in melanoma. An sRGES threshold of −0.3 was the cutoff for compounds that effectively reversed the BRAFi resistance signature.
Statistical Analysis
For all analyses, the sample sizes were not prespecified prior to performing the experiment. When appropriate, statistical analysis was performed with one-way ANOVA with Bonferroni correction to correct for multiple hypothesis testing. Owing to the exploratory nature of this study, P values cannot be interpreted as hypothesis testing and can only be interpreted as a descriptive metric. Error bars indicate the standard deviation of independent biologic replicates.
Results
Identification of Compounds That Reverse a BRAFi Resistance Signature
We employed a systems-based approach to identify compounds that reverse an experimentally derived BRAFi resistance signature. This approach was originally proposed in the Connectivity Map project (Lamb et al., 2006) and was extended in other studies (Sirota et al., 2011; Chen et al., 2017b), including a recent study from the Chen laboratory (Chen et al., 2017a) that discusses the computational methodology used in this study in detail. Sample collection, signature creation, sRGES computation, and in silico validation were streamlined in the OCTAD pipeline, which was described in Materials and Methods. This approach has been applied to identify potential therapeutic compounds for primary cancers, but this study is our first attempt to apply this method to study drug resistance.
To identify compounds that killed BRAFi-resistant melanoma cell lines we first leveraged RNA-Seq data from three isogenic cell line pairs (M229P/R, M238P/R, and UACC62P/R) to generate a BRAFi resistance signature. However, the small reference population (parental cells) in this analysis made it difficult to generate a robust resistance signature for this analysis. As such, we took an alternative approach to compare the resistant cell lines with a reference population of healthy skin samples in the OCTAD database, with the idea being that differences between melanoma cells and healthy skin may reflect biologically meaningful differences in signaling pathway activation and, thus, compound sensitivity. Out of the 558 healthy skin samples in the OCTAD database we identified the 50 samples whose gene expression profiles correlated best with BRAFi-resistant samples. Then by comparing these two groups of samples, 191 differentially expressed genes that are included in the LINCS 978 landmark genes were identified (log2 fold change >1 and adjusted P < 0.001). We subsequently used this set of genes as a resistance signature and used the sRGES method as described in Materials and Methods to identify compounds that reverse this expression signature. To this end, we identified 245 compounds with an sRGES lower than −0.3, the cutoff for meaningful reversal of the resistance signature.
We next wanted to benchmark our computational predictions against known compound sensitivity data (Supplemental Fig. 2). One of the cell lines used in our analysis, UACC62P, was included in the Cancer Therapeutics Response Portal (CTRP) version 2 compound screening data set. For the compounds in the CTRP version 2 data set that overlapped with the compounds included in our analysis we found a strong correlation (Spearman correlation = −0.47, P = 1.6e-9) between the known drug sensitivity available in the CTRP version 2 data set and the predicted reversal score (Supplemental Fig. 3).
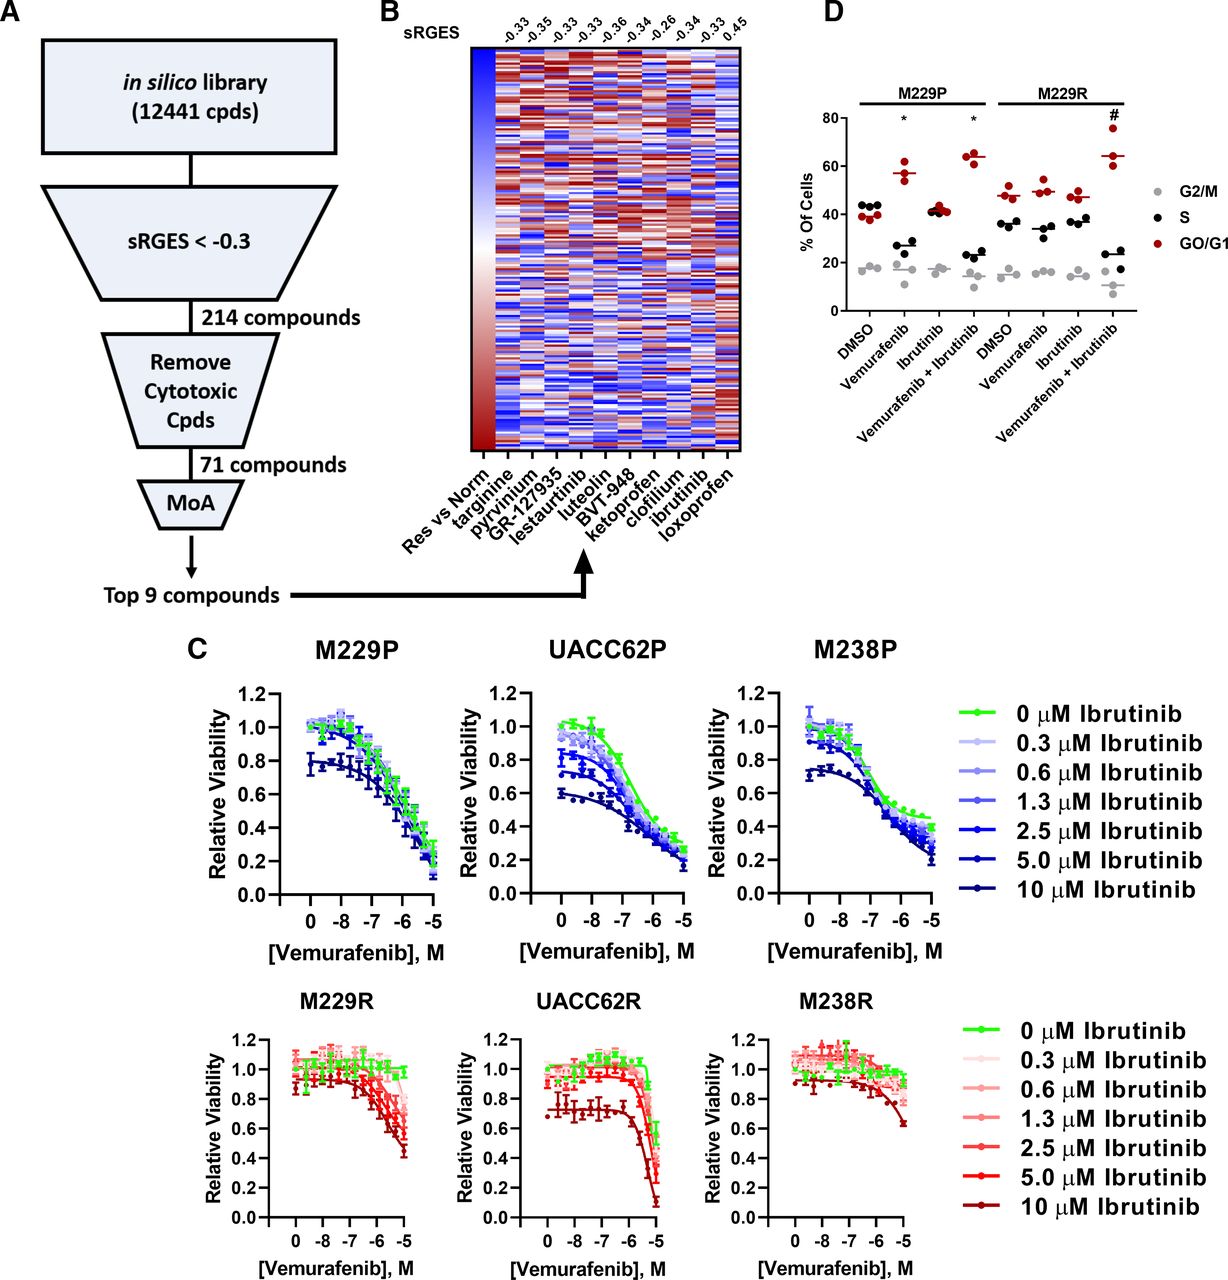
The goal of the computational screen (Fig. 1A) in this study was to identify compounds that suppress BRAFi-resistant melanoma cells. After filtering the compound list (Supplemental Table 2) to only include compounds that have an sRGES less than −0.3, which indicates reversal of the transcriptional signature of BRAFi-resistant cells, we applied several additional filtering metrics to further refine the compound list. First, we removed all compounds that did not have a well annotated mechanism of action or are broadly cytotoxic chemotherapeutic agents. In total, 71 of these compounds passed these filtering criteria. Compounds with a promiscuous mechanism of action, such as sertindole, or compounds with molecular targets not expressed at an appreciable level, such as CGP-71683, were then removed. Finally, compounds where the molecular target was known to be important in BRAFi resistance (18 of the top 40) were also excluded from further study, since our goal was to identify new potential targets and learn new biology about BRAFi resistance mechanisms (Supplemental Table 2). Our approach did, in fact, identify numerous compounds previously implicated in overcoming BRAFi resistance, including latrunculin-b and dasatinib, highlighting the effectiveness of this computational strategy. Ultimately, we selected nine compounds, not previously implicated in BRAFi resistance, for further experimental validation. These compounds include targinine, pyrvinium, GR-127935, lestaurtinib, luteolin, BVT-948, ketoprofen, clofilium, and ibrutinib.

Ibrutinib resensitizes BRAFi-resistant cells to vemurafenib. (A) The unfiltered in silico compound library contains 12,441 compounds that span a diversity of chemotypes and molecular targets; many of these compounds are FDA approved or at one point entered clinical trials. Compounds were first filtered to only include compounds that significantly reverse a BRAFi resistance signature (sRGES <−0.3), resulting in 214 compounds that passed this cutoff. These compounds were further filtered to remove compounds that are broadly cytotoxic and to remove compounds lacking a well annotated mechanism of action (MoA). From the resulting ranked list of 71 compounds, we selected nine compounds whose primary target had not been previously implicated in BRAFi resistance for further experimental validation. These compounds were selected primarily based upon the mechanism of action, with the goal of identifying new biology underlying BRAFi resistance. (B) The BRAFi resistance signature was computed by comparing BRAFi-resistant cell lines and normal tissue samples. Red boxes indicate upregulated genes, and blue boxes indicate downregulated genes. Loxoprofen was included as a control since this compound was not predicted to reverse the BRAFi resistance signature. For compounds with multiple gene expression profiles, the profile with the median RGES was chosen for visualization. The sRGES values for the BRAFi resistance signature and the compound-treated signatures are listed above the heatmap. A negative sRGES indicates reversal of the BRAFi resistance signature by the indicated compound. (C) M229P/R, UACC62P/R, and M238P/R cells were treated in a dose-response matrix of ibrutinib (top concentration 10 µM, 1/2 dilution series) and vemurafenib (top concentration 10 µM, 1/2 dilution series). After 72 hours, viability was measured with CellTiter-Glo (n = 3 biologic replicates). (D) M229P/R cells were treated with ±2 µM vemurafenib and ±1 or 5 µM ibrutinib for 72 hours. The cells were stained and analyzed by flow cytometry as described in Materials and Methods (n = 3 biologic replicates). Significant differences of G0/G1 for compound-treated samples versus the relevant DMSO control are indicated (one-way ANOVA, *P < 0.01 versus M229P-DMSO; #P < 0.01 versus M229R-DMSO).
The nine selected compounds that reversed the BRAFi resistance gene expression signature in silico (Fig. 1B; Supplemental Table 2) were examined for their ability to inhibit growth of matched parental and BRAFi-resistant melanoma cell lines. Four of these compounds, pyrvinium, BVT-948, clofilium, and GR-127935, reduced cell viability in both M229P and M229R cells, with no apparent selectivity for one over the other (Supplemental Fig. 3). This lack of selectivity is likely because both the parental and resistant cells were compared with normal tissue, instead of being directly compared against each other. Next, we created a gene expression resistance signature consisting of 87 genes by comparing the gene expression data from the resistant cell lines with BRAFV600E-mutant primary melanoma tumor samples in the OCTAD database. The expression signature is associated with poor overall survival in patients with melanoma with BRAFV600E mutations (P = 0.006, Cox model), but not with patients with wild-type BRAF melanoma (P = 0.028), suggesting that this gene expression signature may be clinically relevant (Supplemental Fig. 4). Using the improved BRAFi resistance signature, three of the nine selected compounds (ibrutinib, pyrvinium, and lestaurtinib) were among the top 5% of compounds identified, with ibrutinib being the most effective in reversing the BRAFi resistance signature (Supplemental Fig. 5). These findings solidified our prioritization of ibrutinib in further studies.
Ibrutinib Resensitizes BRAFi-Resistant Cells to Vemurafenib
We reasoned that compounds that reverse a BRAFi resistance gene expression signature should also reverse BRAFi resistance in melanoma cells in an experimental setting. To test this hypothesis, we profiled the synergy between vemurafenib and the top nine hits from the computational screen in a 14 × 7 concentration response matrix with vemurafenib to identify compounds that can potentiate vemurafenib response. Of the nine selected compounds, many had single agent activity (Supplemental Fig. 6), but only ibrutinib reversed BRAFi resistance (Fig. 1C, red curves). This low target validation rate (one in nine) may be because our filtering criteria excluded compounds whose annotated mechanisms were already known to be associated with BRAFi resistance.
Even though our computational screen was performed using RNA-Seq data from all three isogenic parental and resistant cell line pairs, only M229R showed synergistic resensitization to vemurafenib by ibrutinib in our 72-hour cell viability assay. Importantly, synergistic growth inhibition was also observed in a long-term colony formation assay (Supplemental Fig. 7). Since BRAF inhibitors are known to arrest melanoma cells at the G1 checkpoint, we reasoned that if ibrutinib is truly resensitizing the resistant cells to vemurafenib it should also resensitize the cells to vemurafenib-induced G1 arrest. As expected, we found, by cell cycle analysis, that M229P cells accumulate in G0/G1 state during vemurafenib treatment whereas M229R cells do not. Consistent with resensitization, when ibrutinib is combined with vemurafenib, M229R cells now accumulate in G0/G1 (Fig. 1D). There was also an increased level of Annexin V–positive cells in the combination-treated group, although there was no change in caspase 3/7 activity or poly(ADP-ribose) polymerase cleavage (Supplemental Fig. 8). Taken together, these data suggest that ibrutinib resensitizes a subset of BRAFi-resistant cell lines to vemurafenib.
BTK Deletion or Inhibition Does Not Resensitize BRAFi-Resistant Cells to Vemurafenib
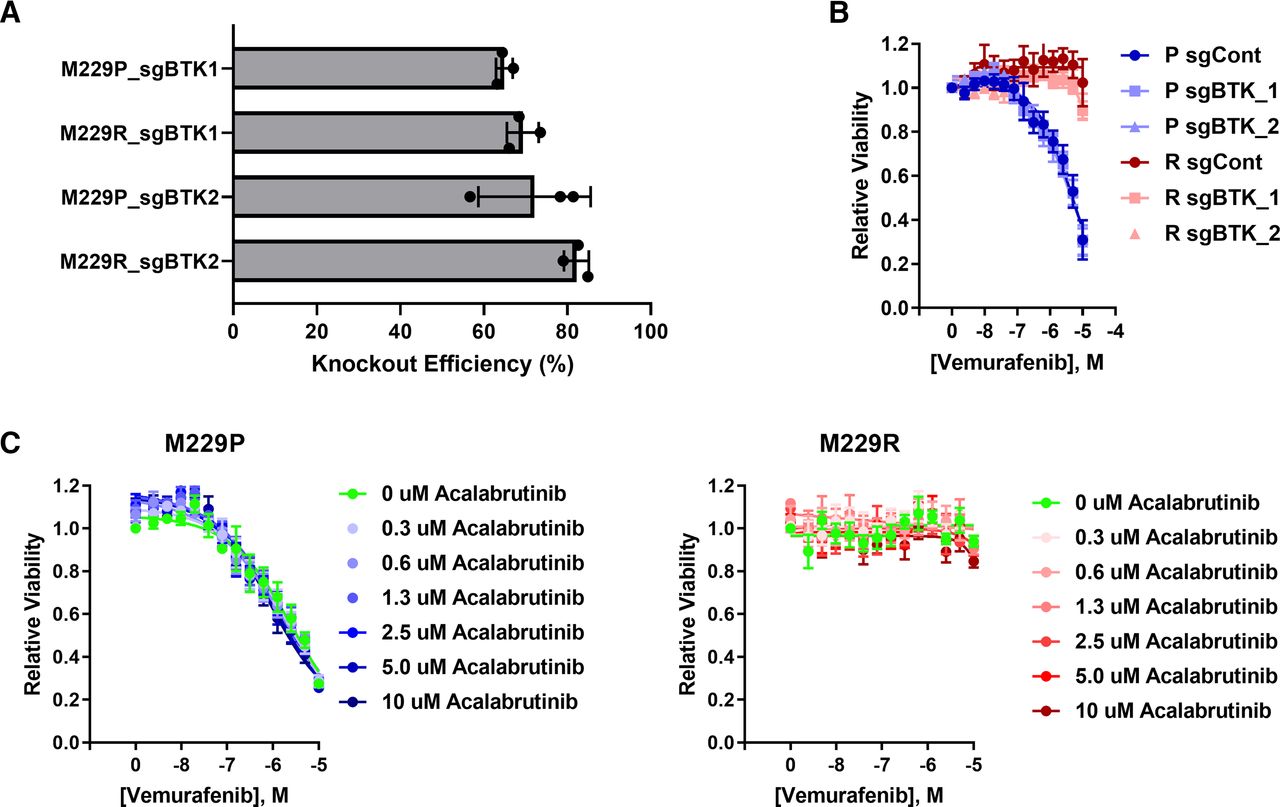
Since ibrutinib is known to have targets other than BTK (Herman et al., 2017; Klaeger et al., 2017; Patel et al., 2017), we wanted to know whether BTK was responsible for BRAFi resistance. To test this hypothesis experimentally, we generated BTK knockout cell pools using CRISPR. BTK mRNA expression is low in both M229P and M229R (Supplemental Fig. 9) cells, and protein is undetectable by immunoblotting, so we determined knockout efficiency by Sanger sequencing of genomic DNA amplicons that contain the region of the CRISPR cut site. The Sanger sequencing traces were subsequently deconvoluted with the TIDE algorithm (Brinkman et al., 2014) to identify the fraction of cells that had functional knockout (Fig. 2A; Supplemental Fig. 10). Using this approach, we found that the functional knockout efficiency was approximately 70%. Even though ibrutinib is used clinically as a BTK inhibitor, deletion of BTK did not alter the vemurafenib response in either the parental or resistant cells (Fig. 2B). This suggested to us that ibrutinib may be resensitizing the cells through off-target inhibition of other kinases instead of by on-target inhibition of BTK. Since acalabrutinib is a BTK inhibitor analog of ibrutinib with reduced off-target activity (Herman et al., 2017; Patel et al., 2017), we asked whether acalabrutinib is capable of reversing BRAFi resistance. Acalabrutinib failed to resensitize BRAFi-resistant cells to vemurafenib (Fig. 2C), consistent with the lack of effect BTK deletion on BRAFi resensitization. Taken together, these data indicate that ibrutinib resensitizes BRAFi-resistant cells to vemurafenib independently from on-target BTK inhibition.

BTK deletion or inhibition does not alter vemurafenib sensitivity. (A) M229P/R BTK knockout cells were generated as described in Materials and Methods. Sanger sequencing was performed to measure the extent of BTK deletion in M229P/R cell pools. The fraction of cells with functional BTK deletion was quantified with TIDE (n = 3 biologic replicates). (B) M229P/R sgControl and sgBTK cells were treated with 14 concentrations of vemurafenib (10 µM top concentration, 1/2 dilution series), and, after 72 hours, viability was measured with CellTiter-Glo as described in Materials and Methods (n = 3 biologic replicates). (C) M229P/R cells were treated with seven different concentrations of acalabrutinib (10 µM top concentration, 1/2 dilution series) and 14 different concentrations of vemurafenib (10 µM top concentration, 1/2 dilution series). After 72 hours, viability was measured with CellTiter-Glo (n = 3 biologic replicates).
Transcriptional Response to Ibrutinib Treatment
To better understand how ibrutinib resensitizes BRAFi-resistant cells to vemurafenib, we performed RNA-Seq on M229R cells after treatment with vemurafenib, ibrutinib, acalabrutinib, or combinations. Consistent with the observation that ibrutinib, but not acalabrutinib, resensitizes BRAFi-resistant cells to vemurafenib, we found that 101 genes were differentially expressed (FDR <0.01) with ibrutinib treatment, whereas there were no differentially expressed genes with acalabrutinib treatment (Fig. 3A) compared with untreated M229R cells. Compared with single agent treatment, there was a synergistic induction of differential gene expression with vemurafenib combined with ibrutinib. Also, the combination of vemurafenib and ibrutinib significantly reversed the BRAFi resistance signature used in our compound sensitivity predictions (Spearman correlation = −0.25, P = 0.0007) (Fig. 3B). We then identified networks of differentially expressed genes in cells cultured in the presence of ibrutinib or the combination of vemurafenib and ibrutinib. With either single agent ibrutinib or the combination of ibrutinib and vemurafenib, the gene networks were primarily associated with development of various organs (Supplemental Fig. 11). To understand the effect of ibrutinib on melanoma cells in greater detail, we profiled transcriptional regulators that are predicted to be altered in cells cultured with ibrutinib or the combination of ibrutinib and vemurafenib using LISA (Qin et al., 2020) to identify transcription factors that may contribute to the differential gene expression in compound-treated cells. Among the top transcription regulators identified were YAP1 and two transcription factors, TEAD1 and TEAD4, which are bound by YAP1 (Fig. 3C). This enrichment was observed in genes that are both downregulated and upregulated by ibrutinib treatment. YAP1, in addition to its canonical role as a transcriptional co-activator, can also function as a transcriptional repressor (Kim et al., 2015). Thus, this is consistent with the idea that ibrutinib targets both YAP1-mediated gene induction and repression (Kim et al., 2015).

Transcriptional response to ibrutinib and vemurafenib treatment in BRAFi-resistant cells. (A) M229R cells were treated with DMSO, vemurafenib (2 µM), ibrutinib (5 µM), acalabrutinib (5 µM), or the combinations as indicated. After 24 hours RNA was extracted and RNA-Seq was performed as described in Materials and Methods. The number of differentially expressed (DE) genes compared with DMSO control–treated cells is shown for each treatment condition. (B) A heatmap of the BRAFi resistance signature is shown in leftmost column, and the impact of compound treatments on reversal of BRAFi signature gene expression is shown in all other columns in the heatmap. For each treatment condition, the fold change in gene expression was compared with the DMSO control. The median expression value for each gene from three biologic replicates was used. For each treatment group the fold change in gene expression was compared with the DMSO control. Red boxes indicate that the gene is upregulated, and blue boxes indicate that the gene is downregulated. Of all treatments, vemurafenib + ibrutinib significantly reversed the BRAFi resistance signature (Spearman correlation = −0.25, P = 0.0007). (C) LISA analysis of differentially expressed genes in the ibrutinib and vemurafenib + ibrutinib treatment groups for prediction of transcriptional regulators. Data analysis was performed as described in Materials and Methods. x- and y-axis values are enrichment P values. Highly predicted transcription regulators are indicated with YAP1 and its transcriptional partners, TEAD1 and TEAD4, are indicated as red dots. (D) Similarity scores for CMap class analysis was performed as described in Materials and Methods. Transcriptional signatures of ibrutinib, vemurafenib, or vemurafenib + ibrutinib were compared with transcriptional signatures in the CMap data set.
We reasoned that inhibitors with the same functional target as ibrutinib should have a similar transcriptional signature to ibrutinib. To address this, we compared the gene expression signatures of ibrutinib- and vemurafenib-treated cells to the signatures of other compounds in the CMap data set. Src proto-oncogene (SRC) inhibitors had a highly similar transcriptional signature to that of ibrutinib (Fig. 3D). This observation is interesting since ibrutinib, but not acalabrutinib, has off-target activity against multiple Src family kinases (SFKs). We compared the kinase gene expression based upon our RNA-Seq data in M229P/R with the experimental Kd values of ibrutinib and identified YES1 and SRC as potential off-targets of ibrutinib (Supplemental Fig. 12) (Herman et al., 2017; Patel et al., 2017). As further support for the method that we employed, we also performed the same comparison with vemurafenib-treated cells and found high similarity with BRAF and mitogen-activated protein kinase kinase 1 inhibitors in the CMap data set, which is consistent with the pharmacology of vemurafenib. Together, these results suggested to us that ibrutinib may alter YAP1 activity through targeting of SRC and/or other Src family kinases.
Ibrutinib Reduces the Nuclear Accumulation of YAP1
YAP1 has been previously implicated in BRAFi resistance (Hugo et al., 2015; Lin et al., 2015; Kim et al., 2016; Fisher et al., 2017; Misek et al., 2020), so it is critical to determine whether ibrutinib acts through altering YAP1 activity. Transcriptionally inactive YAP1 is sequestered in the cytosol, and upon various stimuli YAP1 can translocate into the nucleus, where it modulates gene transcription, often in partnership with TEAD transcription factors. As we previously demonstrated (Misek et al., 2020), M229R cells have an increased nuclear/cytosolic ratio of YAP1 localization. The precise mechanism by which YAP1 is activated in these cells is still unclear. Consistent with our computational predictions in M229R cells that are resensitized to vemurafenib by ibrutinib, ibrutinib reduced the proportion of cells with nuclear YAP1 localization, whereas acalabrutinib had no effect on YAP1 localization (Fig. 4, A and B). These data further support that ibrutinib mediates resensitization through a BTK-independent mechanism involving YAP1.

Ibrutinib blocks YAP1 nuclear localization. All cells were treated with ibrutinib or acalabrutinib at 5 µM or vehicle control for 24 hours as indicated prior to being fixed and stained. (A) M229P/R cells were stained with an anti-YAP1 antibody as described in Materials and Methods. The percentage of cells with nuclear, cytosolic, or pan-cellular YAP1 localization was quantified as described in Materials and Methods. (B) Representative images from the experiment in Fig. 4A. M238P/R (C) or UACC62P/R (D) cells were stained with an anti-YAP1 antibody as described in Materials and Methods. The percentage of cells with nuclear, cytosolic, or pan-cellular YAP1 localization was quantified as described in Materials and Methods. Statistical analysis (one-way ANOVA) was performed on percentage of cells with nuclear YAP1 localization where P < 0.01 was considered statistically significant. Bars marked with # indicate a statistically significant difference when compared with DMSO-treated parental cells, and bars marked with * indicate a statistically significant difference when compared with DMSO-treated resistant cells (n = 3 biologic replicates for all imaging experiments).
Our data showed some efficacy of ibrutinib as a monotherapy in both UACC62P and UACC62R cells, but little effect on sensitization to vemurafenib, suggesting that ibrutinib is unlikely to be targeting vemurafenib resistance mechanisms, like YAP1 in those cells. Accordingly, ibrutinib, as well as acalabrutinib, had no effect on YAP1 localization in M238R or UACC62R cells (Fig. 4, C and D). It is possible that YAP1 could be regulated through other mechanisms in these cells, such as crosstalk with the actin cytoskeleton. It is also possible that SRC-mediated phosphorylation of the YAP suppressor large tumor suppressor kinase 1/2 could be important in M229R cells, but not UACC62R or M238R cells (Oka et al., 2008). We also observed an increase in the fraction of cells with predominantly nuclear localization of TAZ, another TEAD coregulator, in all three resistant cell lines, but neither ibrutinib not acalabrutinib altered TAZ localization (Supplemental Fig. 13). Although there are likely additional targets of ibrutinib in melanoma cells, our data provide evidence that in a subset of BRAFi-resistant cells, off-target activity of ibrutinib, independent of BTK, can alter YAP, which may contribute to resensitization to BRAFi treatment.
Discussion
In this study we used an unbiased computational approach to identify compounds that reverse a gene expression signature associated with melanoma BRAFi resistance. Through this approach, we have identified a role for ibrutinib in resensitizing a subset of melanoma cells with acquired BRAFi resistance to vemurafenib.
Ibrutinib is an oral BTK inhibitor approved for use in chronic lymphocytic leukemia and mantle cell lymphoma. The lack of efficacy of acalabrutinib, a recently approved, more selective BTK inhibitor, or genetic ablation of BTK, on vemurafenib resensitization demonstrates that off-target inhibition of another kinase(s) underlies the effect. Further investigation supports the notion that ibrutinib-mediated resensitization to vemurafenib may occur through inhibition of Src family kinases. The transcriptomic signature of ibrutinib-treated cells is similar to that of cells treated with Src family kinase inhibitors. Other studies have also identified a role for SFKs in BRAFi resistance (Girotti et al., 2013; Fallahi-Sichani et al., 2017; Feddersen et al., 2019), further supporting the idea that off-target anti-SFK activity of potential melanoma therapeutics may be mechanistically important. One study in particular characterized a novel dual RAF/SRC inhibitor that retains activity against melanoma tumors that had previously developed resistance to dabrafenib/trametinib therapy (Girotti et al., 2015). It is also conceivable that ibrutinib off-targets, other than SFKs, may also be important in melanoma.
In our previous work we found that a subset of BRAFi-resistant melanoma cells had an accumulation of YAP1 in the nucleus. The precise mechanism by which YAP1 is activated in these cells is still unclear but may be the result of autocrine/paracrine signaling, cell-intrinsic signaling/epigenetic alterations, or differences in cell-to-cell contracts or cell density. Consistent with the idea that changes in YAP1 localization control activity, we found that nuclear accumulation, which renders YAP1 transcriptionally active, is prevented by ibrutinib, but not acalabrutinib (Basu et al., 2003). Several lines of evidence point to a critical role for SFKs in modulation of YAP1 activation. For example, YES1, an SFK that can be inhibited by ibrutinib (Klaeger et al., 2017), phosphorylates and activates YAP1 (Rosenbluh et al., 2012). Other SFKs, including lymphocyte-specific protein tyrosine kinase (LCK), as well as SRC itself, have also been demonstrated to modulate YAP1 activation (Lamar et al., 2019; Sugihara et al., 2018), suggesting that modulation of YAP1 activity could be a general feature of SFKs. Consideration of the effect of ibrutinib on YAP1 localization, as well as the established role of YAP1 in BRAFi resistance, leads us to propose a model in which ibrutinib reverses resistance by reducing the nuclear accumulation of YAP1. It is certainly possible that other mechanisms contribute to ibrutinib’s reversal of BRAFi resistance. For example, although we saw no effect on TAZ localization, modulation of other gene regulatory factors could be important. As shown in Fig. 3C, RELA activity was predicted to be altered by ibrutinib; as shown in Supplemental Table 2, multiple RELA/nuclear factor-κB inhibitors were predicted to reverse a BRAFi resistance signature. So it is possible that ibrutinib could reverse BRAFi resistance by modulating nuclear factor-κB.
Understanding the polypharmacology of ibrutinib is crucial effectively repurposing ibrutinib, an FDA-approved drug, or related SFK inhibitors for the treatment of BRAFi-resistant melanoma. A clinical trial testing ibrutinib as a single agent therapy in patients with treatment-refractory metastatic melanoma (NCT02581930) is currently ongoing. Based on our findings that ibrutinib treatment alone is ineffective in BRAFi-resistant or BRAFi-naïve (Supplemental Fig. 14) melanoma cell lines, we would not expect strong efficacy of ibrutinib as a single agent in the clinic, at least through cancer cell autonomous mechanism. However, our data do suggest that ibrutinib may resensitize a subset of resistant melanoma to BRAF inhibitors, so combining ibrutinib with BRAF inhibitors may be more efficacious than monotherapy. Beyond melanoma, ibrutinib is used clinically to treat mantle cell lymphoma and chronic lymphocytic leukemia, and YAP1 has been implicated in both diseases (Byrd et al., 2013; Wang et al., 2013), suggesting that the findings from this study may also be important in understanding differences in treatment response in these patients as well. It would be important to identify biomarkers, perhaps related to YAP1 activity or nuclear localization, that would predict activity of SFK inhibition in BRAFi-resistant melanomas.
In this study we demonstrate that ibrutinib resensitizes a subset of BRAFi-resistant melanoma cells to vemurafenib. Mechanistically, we propose a model in which off-target SFK inhibition results in decreased YAP1 activity, although this model is likely incomplete and more experimental validation will need to be performed to fully understand how ibrutinib reverses BRAFi resistance. The translational potential of this research is increased by the fact that ibrutinib is already FDA-approved and thus can be used off-label for other indications. These data would suggest that ibrutinib or other SFK inhibitors, many of which are already FDA-approved, could have utility in BRAFi/MEKi-resistant melanoma tumors, as well as other YAP1-driven cancers.
Authorship Contributions
Participated in research design: Misek, Newbury, Chen, Gallo, Neubig.
Conducted experiments: Misek.
Contributed new reagents or analytical tools: Doseff, Chen.
Performed data analysis: Misek, Newbury, Chekalin, Paithankar.
Wrote or contributed to the writing of the manuscript: Misek, Newbury, Chekalin, Chen, Gallo, Neubig.
Footnotes
- Received May 6, 2021.
- Accepted October 1, 2021.
↵1 S.A.M. and P.A.N. contributed equally to this work.
This work was supported by the Michigan State University Gran Fondo Skin Cancer Research Fund (to R.R.N.), Michigan State University Federal Credit Union Aitch Foundation Fellowship (to S.A.M.), National Institutes of Health (NIH) National Cancer Institute [F31-CA232555 to S.A.M.], NIH National Institute of General Medical Sciences [R01-GM134307 to B.C.], and NIH National Institute of Environmental Health Sciences [K01-ES028047 to B.C.].
↵
 This article has supplemental material available at molpharm.aspetjournals.org.

Abbreviations
- BRAF
- B-Raf proto-oncogene
- BRAFi
- BRAF inhibitor
- BTK
- Bruton tyrosine kinase
- CMap
- Connectivity Map
- CRISPR
- clustered regularly interspaced short palindromic repeats
- CTRP
- Cancer Therapeutics Response Portal
- FDA
- US Food and Drug Administration
- FDR
- false discovery rate
- LINCS
- Library of Integrated Network-Based Cellular Signatures
- LISA
- epigenetic landscape in silico deletion analysis
- MEKi
- mitogen-activated protein kinase kinase 1 inhibitor
- OCTAD
- Open Cancer Therapeutic Discovery
- PDGFR
- platelet-derived growth factor receptor
- RGES
- Reverse Gene Expression Score
- RNA-Seq
- RNA sequencing
- SFK
- Src family kinase
- SRC
- Src proto-oncogene
- sRGES
- Summarized Reverse Gene Expression Score
- TAZ
- WW domain–containing transcription regular 1
- TEAD
- TEA domain transcription factor
- TIDE
- Tracking of Indels by Decomposition
- YAP1
- Yes1-associated transcriptional regulator
- Copyright © 2021 by The American Society for Pharmacology and Experimental Therapeutics


