


Abstract
Filtered glucose is mostly reabsorbed by sodium-glucose cotransporter 2 (SGLT2) in the proximal tubules. SGLT2 is predominantly expressed in the human kidney. However, the regulatory mechanisms for SGLT2 gene expression in the human kidney remain unclear. We in this work elucidated the transcriptional regulatory mechanisms for the SGLT2 gene by nucleosome occupancy in the SGLT2 promoter region. Expressions of SGLT2 mRNA and protein were markedly weaker in human kidney-derived HK-2 cells than the human kidney. The nucleosome occupancy level in the SGLT2 promoter region was low in the kidney, but high in HK-2 cells. A treatment with a histone deacetylase inhibitor trichostatin A (TSA) decreased nucleosome occupancy in the promoter region and increased SGLT2 expression levels in HK-2 cells. The upregulation of SGLT2 expression by histone acetylation was accompanied by a higher binding frequency of hepatocyte nuclear factor (HNF) 1α, a transcriptional modulator of SGLT2 in the human kidney, to the promoter region. The transfection of a HNF1α expression plasmid into HK-2 cells resulted in the upregulation of SGLT2 mRNA expression in the presence of TSA, but not in the treatment of dimethylsulfoxide as a control. Nucleosome occupancy in the promoter region was markedly higher in the liver and small intestine than the kidney. Our results indicate that tissue-specific nucleosome occupancy plays an important role in the regulation of SGLT2 gene expression via HNF1α binding at the SGLT2 promoter region.
Introduction
The kidney plays an important role in the reabsorption of glucose from the glomerular filtrate. Approximately 180 g glucose is typically filtered by the kidneys each day and reabsorbed in proximal tubule epithelial cells (PTECs) by sodium-glucose cotransporters (SGLTs) (Wright, 2001; Chen et al., 2010; Gerich, 2010; Pérez López et al., 2010). In the S1 and S2 segments of the proximal tubule, approximately 90% of filtered glucose is reabsorbed through SGLT2 (Gerich, 2010). Previous studies demonstrated that a deficiency in SGLT2 expression decreased blood glucose levels. The knockout of Sglt2 in diabetic mice reduced blood glucose levels and prevented glomerular hyperfiltration (Vallon et al., 2013). Therefore, the inhibition of SGLT2 activity in the kidney is regarded as an effective strategy for glycemic control in diabetic patients. Selective SGLT2 inhibitors have been developed as a new class of oral medication for the treatment of type 2 diabetes mellitus. These drugs reduce glucose reabsorption by SGLT2 in the proximal tubules, thereby increasing urinary glucose excretion and lowering plasma glucose levels (Jabbour and Goldstein, 2008; Bołdys and Okopień, 2009; Misra, 2013).
Previous studies focused on the regulation of SGLT2 expression by transcription factors. Hepatocyte nuclear factor (HNF) 1α, which has been characterized as a modulator of SGLT2 expression, was shown to directly bind to the SGLT2 5′-flanking region (5′-FR) and control SGLT2 gene expression (Pontoglio et al., 2000; Freitas et al., 2008; Zhao et al., 2016). Additionally, HNF4α and SP1 have been reported to play an important role in SGLT2 expression (Kothinti et al., 2010; Bonner et al., 2015). Although these transcription factors are expressed in various tissues such as the liver and intestines, SGLT2 is not. Therefore, another mechanism for the regulation of SGLT2 expression appears to contribute to tissue-specific gene expression. The nucleosome is a basic unit of chromatin and consists of approximately 147 bp of DNA wrapped around histones. Nucleosome occupancy plays an important role in the epigenetic regulation of gene expression by inhibiting the initiation of transcription at gene promoters (Lorch et al., 1987; Workman, 2006). Previous studies demonstrated that nucleosomes control tissue-specific transcription factor binding to gene promoters, and, thus, contribute to tissue-specific gene expression (Hoffman et al., 2010; Hu et al., 2011; Tsui et al., 2011; Yang et al., 2013; Zhang et al., 2015). However, the relationship between nucleosome occupancy and tissue-specific SGLT2 expression remains unknown. Therefore, a clearer understanding of nucleosome occupancy at the SGLT2 promoter may provide significant insights into transcriptional regulatory mechanisms for the SGLT2 gene in the human kidney.
In the present study, we focused on the transcriptional regulation of the SGLT2 gene by nucleosome occupancy in SGLT2 5′-FR in the human kidney. We demonstrated that decreasing nucleosome occupancy in the SGLT2 promoter plays a critical role in the upregulation of SGLT2 expression. We also revealed that HNF1α binds to the SGLT2 promoter in the human kidney, and the activation of SGLT2 transcription by HNF1α requires low nucleosome occupancy through histone acetylation in the SGLT2 promoter.
Materials and Methods
Human Tissue.
A human kidney cortex and small intestine obtained from surgical specimens were purchased from Integrated Laboratory Services-Biotech (Chestertown, MD). A human liver sample was obtained from a Caucasian donor at the National Disease Research Interchange (Philadelphia, PA). All assays using human tissue samples were performed by three independent experiments (n = 3). The use of human tissues was approved by the Kyushu University Institutional Review Board for Human Genome/Gene Research (Fukuoka, Japan).
Cell Culture.
HK-2 cells were obtained from the American Type Culture Collection (Manassas, VA). Cells were cultured in DMEM/F12 medium (Thermo Fisher Scientific, Waltham, MA) supplemented with 10% fetal bovine serum at 37°C in an incubator with 5% CO2.
Construction of SGLT2 Reporter Plasmids.
The DNA fragment of SGLT2 5′-FR (−3185/+18) was amplified by a polymerase chain reaction (PCR) using primers (described as −3185 and +18 in Supplemental Table 1) and human genomic DNA as a template. The pGL4.10 vector (Promega, Madison, WI) was digested by KpnI and HindIII restriction enzymes and then ligated with the PCR product using the In-Fusion HD Cloning kit (TaKaRa, Shiga, Japan). Deletion constructs [−2320/+18, −1587/+18, −485/+18, −154/+18, −44/+18, and del-(−51/−37)] were generated by In-Fusion cloning or the QuikChange II site-directed mutagenesis method (Supplemental Table 1) using the −3185/+18 construct as a template. The sequences of these plasmids were confirmed by direct sequencing using primers (Supplemental Table 2) described previously (Nishimura et al., 2014).
Construction of a HNF1α Expression Plasmid.
The coding region of HNF1α was amplified by PCR using cDNA synthesized from the human kidney and primers (Supplemental Table 3). The pcDNA3.1(+) vector (Invitrogen, Carlsbad, CA) was digested by EcoRI and EcoRV restriction enzymes and then ligated with the PCR product using the In-Fusion HD Cloning kit. The sequence of the plasmid was confirmed by directed sequencing using primers (Supplemental Table 3).
Luciferase Assay.
HK-2 cells were seeded on 24-well culture plates at 0.2 × 10⁵ cells/well and incubated for 24 hours. A series of reporter constructs [equimolar amounts of the empty pGL4.10 plasmid (250 ng)], 500 ng HNF1α expression plasmid or the empty pcDNA3.1(+) plasmid, and 25 ng internal standard pGL4.70 (Promega) were transfected into HK-2 cells using FuGENE HD Transfection Reagent (Promega), according to the manufacturer’s instructions. After 48 hours, luciferase activities were measured using the Dual-Luciferase Reporter Assay System (Promega) and a TD-20/20 Luminometer (Promega). Transcriptional activities were expressed as the ratio of Firefly luciferase to Renilla luciferase activity.
RNA Interference.
The transfection mix was prepared in Opti-MEM (Invitrogen) with HNF1α small interfering RNA (siRNA) (siHNF1α; Sigma-Aldrich, St. Louis, MO) or control siRNA (MISSION siRNA Universal Negative Control; SIC-001; Sigma-Aldrich) and Lipofectamine RNAiMAX (Invitrogen), according to the manufacturer’s directions. The final concentrations of siRNA and lipofectamine added to the cells were 20 nM and 2 µl/ml, respectively. HK-2 cells were cultured in the presence of the transfection mixture for 24 hours, and cells were treated with dimethylsulfoxide (DMSO) or 1.0 μM trichostatin A (TSA; Wako, Osaka, Japan) for 24 hours. siHNF1α sequences were as follows: 5′-CAGUGAGACUGCAGAAGUAtt-3′ (sense sequence) and 5′-TACTTCTGCAGTCTCACTGtt-3′ (antisense sequence).
Total RNA Isolation and Capture of Nascent RNAs.
HK-2 cells were seeded on a six-well plate at 1.5 × 10⁵ cells/well and incubated for 24 hours, and cells were then transfected with 500 ng HNF1α expression plasmid or pcDNA3.1(+) plasmid using the FuGENE HD Transfection Reagent (Promega). After 48 hours, cells were treated with DMSO or 1.0 μM TSA, together with 0.2 mM 5-ethynyl uridine for 24 hours. Total RNA was isolated from the human kidney and HK-2 cells using ISOSPIN Cell & Tissue RNA (Nippon Gene, Tokyo, Japan). Ethynyl uridine–labeled nascent RNA was biotinylated and captured using a Click-iT Nascent RNA Capture Kit (Invitrogen), according to manufacturer’s instructions.
cDNA Synthesis and Quantitative PCR.
Total RNA (500 ng) or nascent RNA (200 ng) was transcribed using the Verso cDNA Synthesis Kit (Thermo Fisher Scientific). Quantitative PCR was performed on a StepOnePlus Real-Time PCR System (Applied Biosystems, Foster City, CA) with SYBR Premix Ex Taq (TaKaRa) under the following conditions: 95°C for 2 minutes, followed by 40 cycles at 95°C for 3 seconds and 60°C for 30 seconds. SGLT2 and HNF1α mRNA levels were normalized to 60S ribosomal protein L13 (RPL13) mRNA levels. The primers used in this study are listed in Supplemental Table 4.
Nucleosome Occupancy and Methylome Sequencing.
Nucleosome occupancy and methylome sequencing (NOMe-Seq) were performed according to the manufacturer’s instructions (Active Motif, Carlsbad, CA), with slight modifications. Approximately 50 mg frozen human tissues and 7.5 × 10⁵ of HK-2 cells were cross-linked by 1% formaldehyde at room temperature for 15 and 5 minutes, respectively, and cross-linking was quenched by adding 1.25 M glycine. Cells were homogenized in lysis buffer with 40 strokes of a Potter–Elvehjem homogenizer (Wheaton Industries, Millville, NJ). Homogenized kidney tissues were filtered through an 80-μm Nylon Woven Net Filter (Merck Millipore, Darmstadt, Germany) to remove tissue debris. Chromatin was sheared to fragments larger than 1 kb. Sheared chromatin was treated with 0 or 20 U GpC methyltransferase at 37°C for 4 hours. Reactions were stopped by the addition of stop solution and incubated at 95°C for 15 minutes. Bisulfite conversion was then performed on DNA. Bisulfite-converted DNA was used for PCR amplification with primers for SGLT2 5′-FR (Supplemental Table 5). PCR products were cloned into the pGEM-T easy vector (Promega). Twenty colonies in GpC methyltransferase-treated DNA and 10 colonies in nontreated DNA were subjected to colony PCR, followed by sequencing with primers (Supplemental Table 5) for the assessment of nucleosome occupancy and CpG methylation, respectively. GpCpG sites were removed from the analysis of nucleosome occupancy as they are both a GpC and CpG context.
Nucleosome Scanning Assay.
A nucleosome-scanning assay (NuSA) was performed using the EpiScope Nucleosome Preparation Kit (TaKaRa), according to the manufacturer’s protocol, with slight modifications. Approximately 20 mg frozen human kidney or 2.0 × 10⁶ of HK-2 cells was washed with ice-cold phosphate saline buffer and incubated in lysis buffer for 10 minutes. Tissue samples were homogenized and filtered, as described above. The nuclei released were treated with 0 or 4 U micrococcal nuclease for 30 minutes at 37°C and purified using NucleoSpin Gel and PCR Clean-up (TaKaRa). Nucleosomal DNA enrichment was evaluated by quantitative PCR with overlapping primer pairs (Supplemental Table 6), producing a high-resolution, quantitative map of the nucleosome location and occupancy. Relative nucleosome occupancy was presented by the ratio to the nucleosomal DNA enrichment of LINE-1 as a reference gene using the Pfaffl method (Pfaffl, 2001).
Chromatin Immunoprecipitation Assay.
Chromatin immunoprecipitation (ChIP) assays were performed using the EpiQuik ChIP or Tissue ChIP kit (Epigentek, Farmingdale, NY), according to manufacturer’s instructions. Briefly, approximately 50 mg human kidney or 1.0 × 10⁶ of HK-2 cells were cross-linked, homogenized, and filtered, as described above. Chromatin was sheared to fragments ranging from 300 to 600 bp. The sonicated lysate (5 μl) was used to quantify the total amount of DNA (input). Immunoprecipitation was performed for 90 minutes with 2 μg antibodies: anti-acetylated histone H3 (Merck), anti-HNF1α (sc-393925; Santa Cruz Biotechnology, Santa Cruz, CA), or normal mouse IgG as the negative control. Immunoprecipitated DNA and input DNA were analyzed by semiquantitative PCR or quantitative PCR using primers for SGLT2 5′-FR (Supplemental Table 7). Semiquantitative PCR was performed using Gene RED PCR Mix Plus (Nippon Gene). PCR products were resolved by electrophoresis on a 2% agarose gel and stained with ethidium bromide. The intensity of bands was quantified with the Lumino Image Analyzer LAS-3000 and Multi Gauge (Fujifilm, Tokyo, Japan).
Western Blot Analysis.
The human kidney was pulverized and dissolved in radioimmunoprecipitation assay buffer (10 mM Tris-HCl, pH 7.5, 150 mM NaCl, 1% sodium deoxycholate, 1% Nonidet P-40, and 0.1% SDS). HK-2 cells were harvested and homogenized with radioimmunoprecipitation assay buffer 24 hours after the TSA treatment. Deglycosylation was performed by incubation with peptide-N-glycosidase F (New England Biolabs, Ipswich, MA). Lysate samples were separated on 9% SDS-polyacrylamide gels and transferred to polyvinylidene difluoride membranes by Trans-Blot SD Semi-Dry Electrophoretic Transfer Cell (Bio-Rad, Richmond, CA). Membranes were blocked in phosphate-buffered saline with 0.1% Tween 20 and 5% nonfat dry milk at room temperature for 20 minutes and incubated with the primary anti–β-actin (ab6276, diluted at 1:5000; Abcam, Cambridge, UK), anti-SGLT2 (sc-393350, diluted at 1:200; Santa Cruz Biotechnology), and anti-HNF1α (sc-6547, diluted at 1:1000; Santa Cruz Biotechnology) antibodies at 4°C overnight. After washing, the membrane was incubated at room temperature for 1 hour with the ECL Mouse IgG, horseradish peroxidase–linked whole Ab (NA931, diluted at 1:10,000; GE Healthcare, Little Chalfont, UK), or donkey anti-goat IgG-horseradish peroxidase (sc-2020, diluted at 1:10,000; Santa Cruz Biotechnology). After washing the membrane, immune complexes were visualized using a chemiluminescence reagent (Amersham ECL Select; GE Healthcare) and captured with the Lumino Image Analyzer LAS-3000.
Statistical Analysis.
Results from three independent experiments are expressed as the mean ± S.D. Statistical analyses were performed with the statistical software program R. The means of two groups were compared with an unpaired Student’s t test (two-tailed). Comparisons of the means of multiple groups were performed with the Tukey–Kramer test. Two-way analysis of variance was used to examine the effects of two factors on an experimental response. All tests were considered significant at P < 0.05.
Results
Analysis of SGLT2 mRNA Levels and Nucleosome Occupancy in HK-2 Cells and Human Kidney Tissue.
SGLT2 is primarily expressed in the cortex of the kidney and located in the S1 and S2 segments of the proximal tubule. The HK-2 cell line, an immortalized PTEC line from a normal adult human kidney, is available as a human PTEC model (Ryan et al., 1994; Wilmer et al., 2010). However, a luciferase assay with HK-2 cells showed no significant changes in the luciferase activity of SGLT2 5′-FR reporter constructs (Fig. 1A). Quantitative PCR with cDNA synthesized from total RNA and Western blot analyses demonstrated that SGLT2 mRNA and protein levels were markedly lower in HK-2 cells than in the human kidney (Fig. 1, B and C). These results suggest different regulatory mechanisms for SGLT2 gene expression between HK-2 cells and the human kidney. Therefore, we performed NOMe-Seq to identify endogenous DNA methylation and the distribution of nucleosome occupancy in 5′-FR in HK-2 cells and the human kidney. NOMe-Seq results of CpG methylation profiles showed that 5′-FR was highly methylated in HK-2 and the human kidney (Fig. 2A). In NOMe-Seq, GpC methyltransferase may artificially methylate GpC sites that are not protected by nucleosomes or DNA-binding proteins. GpC methylation patterns represent the sites of a genome occupied by nucleosomes. To confirm whether GpC sites in GpC methyltransferase-treated samples were successfully methylated, we assessed GpC sites in the GAPDH promoter. These GpC sites were highly methylated in extracted DNA samples (Supplemental Fig. 1). The 5′-FR was occupied by more nucleosomes in HK-2 cells than in the human kidney (Fig. 2B; Supplemental Fig. 2A). We then performed NuSA to confirm nucleosome occupancy in SGLT2 5′-FR. Relative nucleosome occupancy was markedly higher in HK-2 cells than in the human kidney (Fig. 2C). These results indicated that SGLT2 5′-FR in HK-2 cells is highly occupied by nucleosomes.
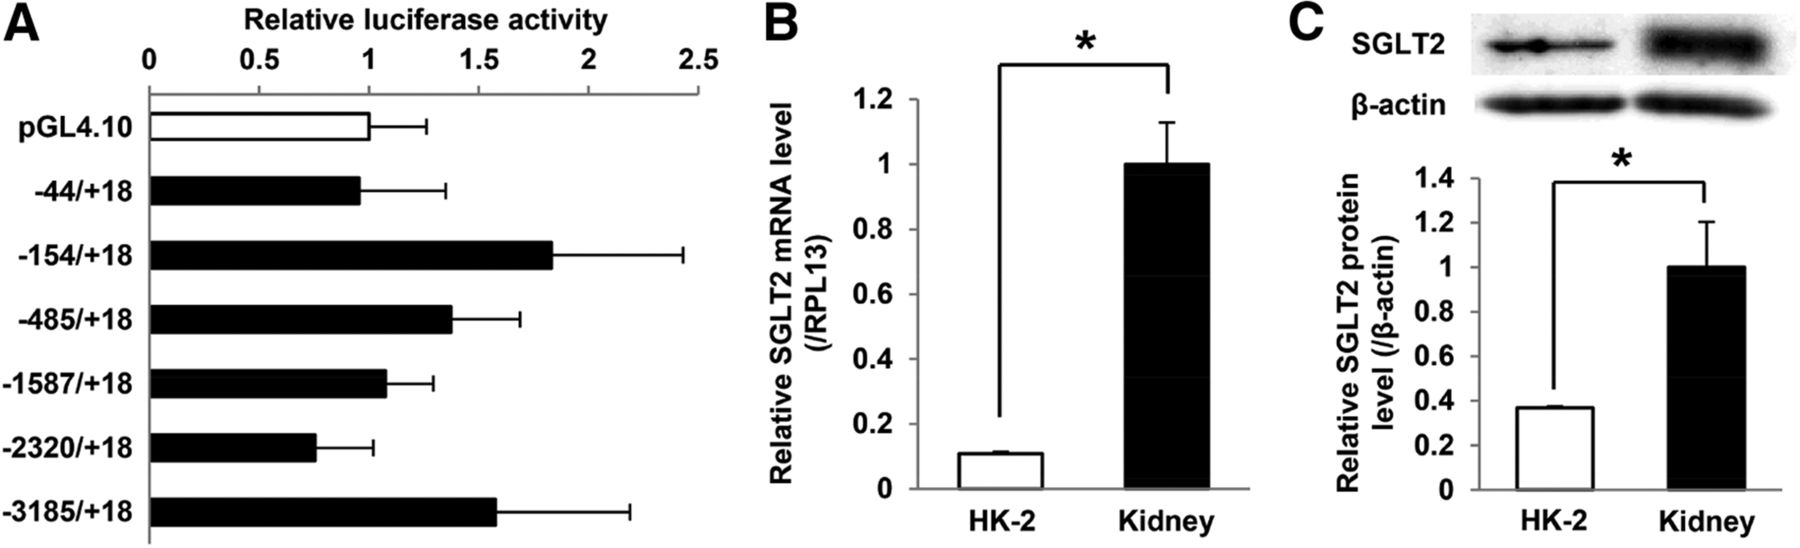
Analysis of transcriptional activity of SGLT2 5′-FR and SGLT2 expression levels in HK-2 cells. (A) Luciferase activity of a series of reporter constructs containing SGLT2 5′-FR in HK-2 cells. Results are expressed as fold increases in pGL4.10. (B) SGLT2 mRNA levels in HK-2 cells and the human kidney were measured by quantitative PCR and normalized to RPL13 mRNA levels. Results are expressed relative to SGLT2 mRNA levels in the human kidney. (C) Western blot analyses of SGLT2 and β-actin protein expression in HK-2 cells and the human kidney. SGLT2 protein levels represent the density ratio for the bands of SGLT2 and β-actin. Results are expressed relative to SGLT2 protein levels in the human kidney. Results represent the mean ± S.D. of three independent experiments. *P < 0.05.
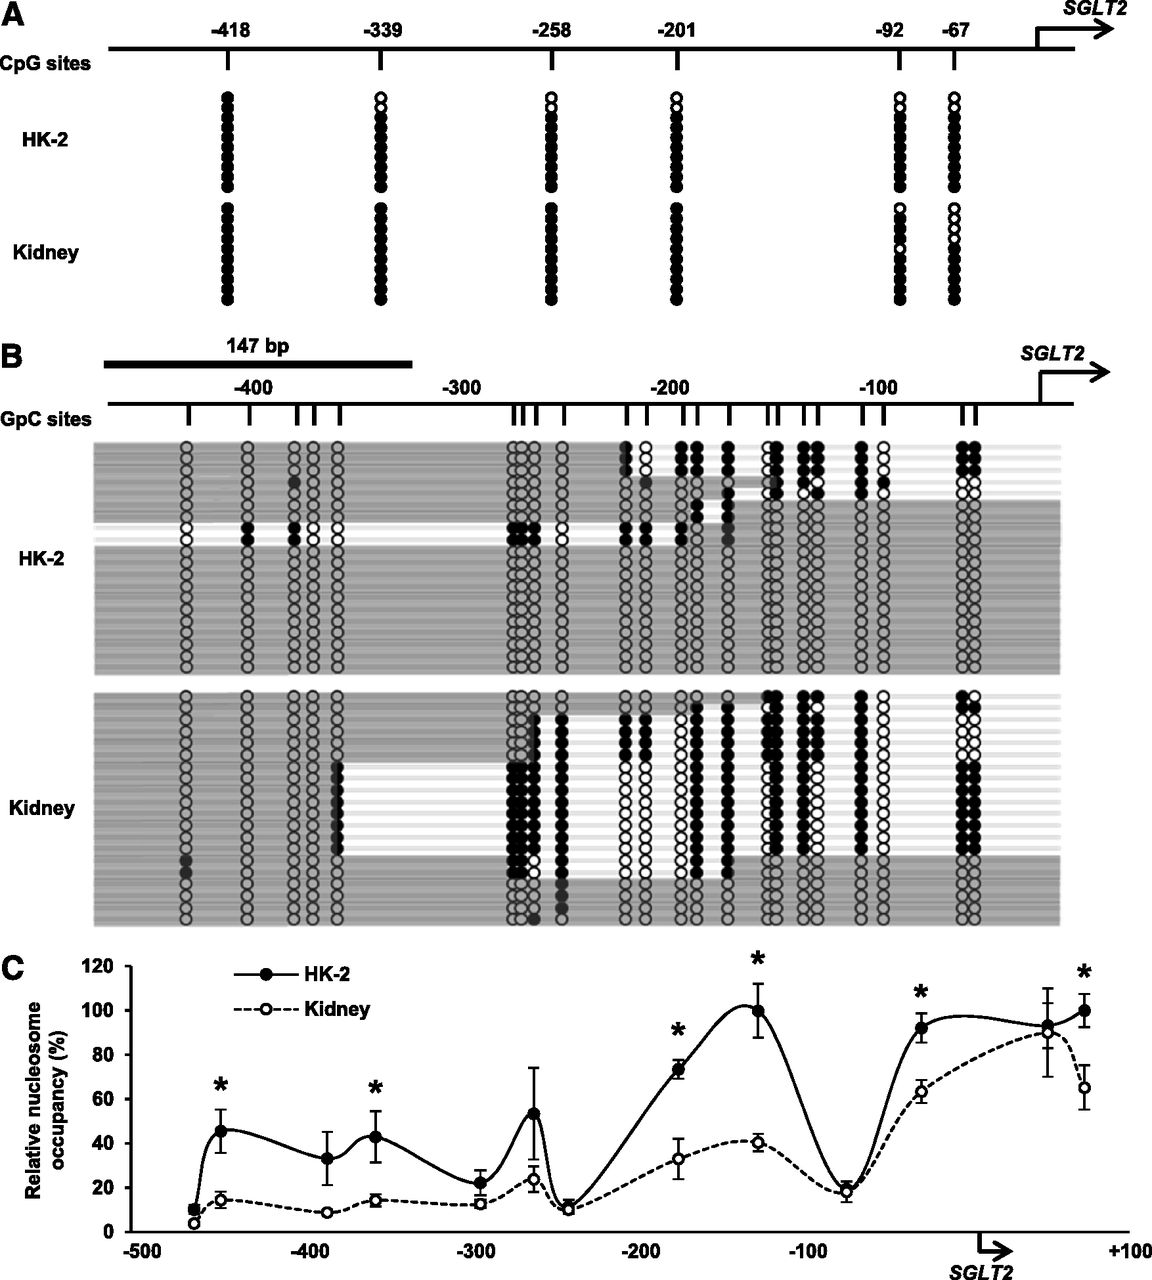
Analysis of epigenetic regulation in SGLT2 5′-FR in HK-2 cells and the human kidney. (A and B) NOMe-Seq data of SGLT2 5′-FR in HK-2 cells and the human kidney. The arrow indicates the SGLT2 TSS. (A) Vertical lines indicate CpG sites. White circles represent unmethylated CpG sites, and black circles represent methylated CpG sites. (B) Vertical lines indicate GpC sites. White circles represent unmethylated GpC sites, and black circles represent methylated GpC sites. Deep gray bars represent nucleosome occupancy, which is the region of consecutive unmethylated GpC sites over 147 bp. (C) NuSA data of 5′-FR in HK-2 cells (black circles) and the human kidney (white circles). Relative nucleosome occupancy is expressed relative to the level of nucleosome occupancy in each sample without the micrococcal nuclease treatment and indicated by the midpoints of each amplicon. Results represent the mean ± S.D. of three independent experiments. *P < 0.05 for HK-2 cells versus the human kidney.
Influence of the TSA Treatment on SGLT2 Expression and Nucleosome Occupancy in SGLT2 5′-FR in HK-2 Cells.
Histone acetylation is a well-known mechanism for epigenetic regulation that upregulates gene expression. Histone deacetylase inhibitors stimulate gene expression by enhancing histone acetylation. In the present study, HK-2 cells were treated with TSA, the most common histone deacetylase inhibitor, to evaluate the effects of histone acetylation on SGLT2 expression and nucleosome occupancy in SGLT2 5′-FR. Quantitative PCR with cDNA synthesized from total RNAs showed that the TSA treatment significantly upregulated SGLT2 mRNA expression (Fig. 3A). The ChIP assay showed that the TSA treatment induced the acetylation of histone H3 in the region between −145 and +135 bp upstream of the SGLT2 transcription start site (TSS), whereas histone H3 acetylation between −547 and −212 bp upstream of the TSS was not significantly induced (Fig. 3, B–D). We then performed NOMe-Seq and NuSA to assess changes in nucleosome occupancy in 5′-FR. The nucleosome occupancy level within approximately 300 bp upstream of the TSS was decreased by the TSA treatment, whereas nucleosome occupancy was not changed in the region between −500 and −300 bp upstream of the TSS (Fig. 4; Supplemental Fig. 2B). NOMe-Seq results also showed that the TSA treatment had no effect on endogenous DNA methylation in 5′-FR (Supplemental Fig. 3). These results indicate that histone acetylation by the TSA treatment upregulates SGLT2 expression and decreases nucleosome occupancy levels within approximately 300 bp upstream of the TSS.

Influence of the TSA treatment on SGLT2 expression and histone acetylation in SGLT2 5′-FR in HK-2 cells. HK-2 cells were treated with DMSO or TSA for 24 hours. (A) SGLT2 mRNA levels were measured by quantitative PCR and normalized to RPL13 mRNA levels. Results are expressed relative to SGLT2 mRNA levels in DMSO-treated cells (control). (B) Scheme of the ChIP assay in 5′-FR. The upper arrow indicates the SGLT2 TSS. Lower arrows indicate two sets of PCR primers targeting 5′-FR, designated as distal and proximal. (C) ChIP analyses targeting 5′-FR in DMSO- or TSA-treated cells using antibodies against normal IgG (white bars) and acetylated histone H3 (black bars). (D) Semiquantitative analyses of acetylated histone H3 enrichment in two regions in ChIP analyses in (C). Results are expressed as the percentage of the immunoprecipitate over total input DNA. Results represent the mean ± S.D. of three independent experiments. *P < 0.05.

Influence of the TSA treatment on nucleosome occupancy in SGLT2 5′-FR in HK-2 cells. (A) NOMe-Seq data of SGLT2 5′-FR in DMSO- or TSA-treated cells. Vertical lines indicate GpC sites. White circles represent unmethylated GpC sites, and black circles represent methylated GpC sites. Deep gray bars represent nucleosome occupancy, which is the region of consecutive unmethylated GpC sites over 147 bp. (B) NuSA data of 5′-FR in DMSO (black circles)- or TSA (white circles)-treated cells. Relative nucleosome occupancy is expressed relative to the level of nucleosome occupancy in each sample without the micrococcal nuclease treatment and indicated by the midpoints of each amplicon. Results represent the mean ± S.D. of three independent experiments. *P < 0.05 for DMSO group versus TSA group.
Analysis of HNF1α Expression and HNF1α-Binding Frequency After the TSA Treatment in HK-2 Cells.
Transcription factors capable of binding to SGLT2 5′-FR were screened by the Database Center for Life Science Galaxy (Institute in Research Organization of Information and Systems, Chiba, Japan). A binding site of HNF1α, which is a transcriptional modulator of SGLT2 in the human kidney, was found between −51 and −37 bp (−51/−37) upstream of the SGLT2 TSS. Chromatin immunoprecipitated (ChIP) assays with quantitative PCR demonstrated that HNF1α binding was detected in the region between −144 and +26 bp upstream, including the predicted HNF1α binding site (−51/−37), in the human kidney (Fig. 5A). TSA-treated HK-2 cells showed a significantly higher binding frequency than DMSO-treated cells (Fig. 5A). We next performed RNA interference with siHNF1α to evaluate a role for HNF1α in regulating SGLT2 gene expression in HK-2 cells. Quantitative PCR and Western blot analyses showed that the TSA treatment caused the upregulated HNF1α mRNA (Supplemental Fig. 4) and protein expression (Fig. 5, B and C). The transfection of siHNF1α in DMSO- or TSA-treated HK-2 cells significantly decreased HNF1α mRNA (Supplemental Fig. 4) and protein expression (Fig. 5, B and C). The knockdown of HNF1α decreased SGLT2 mRNA expression in TSA-treated HK-2 cells, whereas no significant changes were observed in DMSO-treated HK-2 cells (Fig. 5D). These results suggest that the TSA treatment upregulates SGLT2 gene expression by increased HNF1α binding in SGLT2 5′-FR in HK-2 cells.

Analysis of HNF1α expression and HNF1α-binding frequency after the TSA treatment in HK-2 cells. (A) ChIP analyses with quantitative PCR targeting the HNF1α binding site in SGLT2 5′-FR in DMSO- or TSA-treated cells and the human kidney using antibodies against normal IgG (white bars) and HNF1α (black bars). The relative binding frequency of HNF1α was measured by quantitative PCR and normalized to that of the input. (B) HK-2 cells were reverse transfected with negative control or siHNF1α for 24 hours and then treated with DMSO or TSA for 24 hours. Western blot analyses representing HNF1α and β-actin protein expression in HK-2 cells. (C) Protein levels represent the density of the ratio for the bands of HNF1α and β-actin in (B). Results were normalized to HNF1α protein levels in DMSO-treated cells (control). (D) SGLT2 mRNA levels were measured by quantitative PCR and normalized to RPL13 mRNA levels. Results are expressed relative to SGLT2 mRNA levels in DMSO-treated cells. Results represent the mean ± S.D. of three independent experiments. *P < 0.05.
Deletion Analysis of SGLT2 5′-FR in HNF1α-Expressing HK-2 Cells.
We performed luciferase assays using HNF1α-expressing HK-2 cells to clarify whether the predicted HNF1α binding site contributes to the transcription of the SGLT2 gene (Fig. 6). The transfection of the HNF1α-negative plasmid (pcDNA3.1) showed that luciferase activity levels were not significantly different in the four reporter constructs containing SGLT2 5′-FR from the control reporter plasmid (pGL4.10). The transfection of the HNF1α expression plasmid significantly enhanced the luciferase activities of the −154/+18 construct and −485/+18 construct, whereas no significant differences were observed in luciferase activities between −154/+18 and −485/+18. These constructs contained the predicted HNF1α binding site (−51/−37). We then measured the luciferase activity of the HNF1α binding site–deleted construct [del-(−51/−37)]. Cells transfected with del-(−51/−37) demonstrated that the deletion of the binding site resulted in loss of HNF1α-mediated luciferase activity. These results suggest that the predicted HNF1α binding site (−51/−37) is essential for HNF1α-mediated transcription of the SGLT2 gene.

Deletion analysis of SGLT2 5′-FR in HNF1α-expressing HK-2 cells. HK-2 cells were transfected with a series of reporter constructs or a control reporter plasmid (pGL4.10), together with the HNF1α-negative plasmid (pcDNA3.1, white bars) or HNF1α expression plasmid (black bars). The position of the deleted region is indicated with Del-(−51/−37). Relative luciferase activity is expressed as a fold increase in pGL4.10 and represents the mean ± S.D. of three independent experiments. *P < 0.05.
Quantitative Analysis of Effects of the TSA Treatment on SGLT2 mRNA Levels in HNF1α-Expressing HK-2 Cells.
Quantitative PCR with cDNA synthesized from total RNA and nascent RNA was performed to evaluate the effects of the TSA treatment on SGLT2 mRNA expression in HNF1α-expressing HK-2 cells (Fig. 7). In the present study, the nascent RNA was defined as RNA transcribed after the DMSO or TSA treatment. Total and nascent SGLT2 mRNA expression levels were significantly higher in HNF1α-expressing cells treated with TSA than in pcDNA3.1-transfected cells. Nascent SGLT2 mRNA levels were 1.8-fold higher than total SGLT2 mRNA in HNF1α-expressing cells treated with TSA. In contrast, no significant changes in SGLT2 mRNA expression levels were observed in HNF1α-expressing cells treated with DMSO. These results indicate that histone acetylation induced by the TSA treatment plays an important role in the HNF1α-mediated upregulation of the SGLT2 gene.

Quantitative analysis of effects of the TSA treatment on SGLT2 mRNA levels in HNF1α-expressing HK-2 cells. HK-2 cells were transfected with the HNF1α-negative plasmid (pcDNA3.1, white circles) or HNF1α expression plasmid (black circles) and treated with DMSO or TSA for 24 hours. Total and nascent SGLT2 mRNA levels were measured by quantitative PCR and normalized to RPL13 mRNA levels. Results are expressed relative to SGLT2 mRNA levels in empty pcDNA3.1-transfected cells treated with DMSO. Results represent the mean ± S.D. of three independent experiments. *P < 0.05 for HNF1α group versus pcDNA3.1 group.
Analysis of Nucleosome Occupancy in Human Kidney, Liver, and Small Intestine Tissues.
HNF1α is expressed in various tissues, such as the liver and intestines, whereas SGLT2 is not. We attempted to identify nucleosome occupancy in 5′-FR containing the HNF1α binding site in the human liver and small intestine. The region within approximately 300 bp upstream of the SGLT2 TSS showed markedly higher nucleosome occupancy in the liver and small intestine than in the kidney (Fig. 8). These results suggest that tissue-specific nucleosome occupancy in 5′-FR plays an important role in the regulation of SGLT2 expression via HNF1α binding.
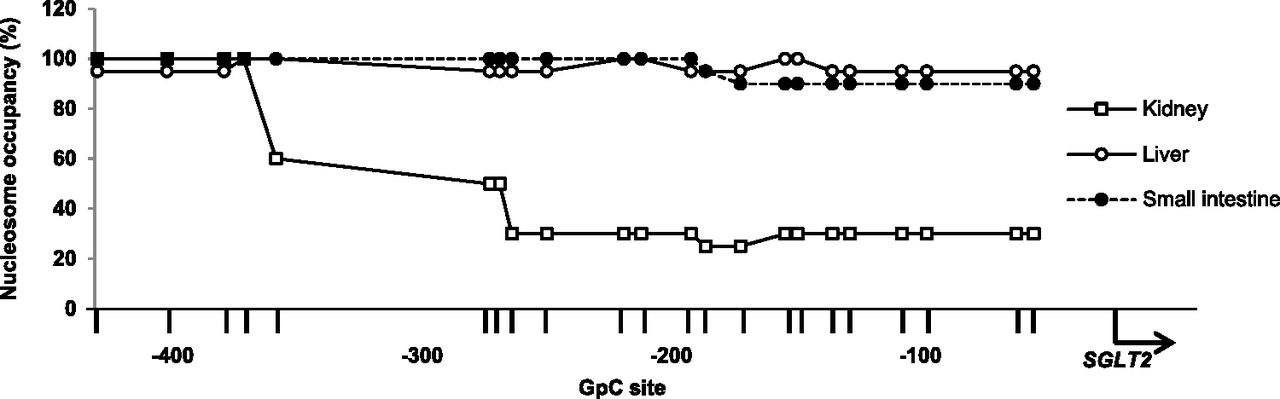
Analysis of nucleosome occupancy in human kidney, liver, and small intestine tissues. NOMe-Seq data of SGLT2 5′-FR in the human kidney (white squares), liver (white circles), and small intestine (black circles). Graph represents the proportion of nucleosome-occupied GpC sites in 5′-FR in the three tissues. The arrow indicates the SGLT2 TSS. Vertical lines indicate GpC sites.
Discussion
In the present study, we focused on the transcriptional regulatory mechanisms of the SGLT2 gene in the human kidney. SGLT2 is known to be expressed in PTECs of the human kidney. Some PTEC lines, such as LLC-PK1, KPT2, and MDCK cells, have been used to analyze expression and regulation of the SGLT2 gene in the kidney (Da Costa-Pessoa et al., 2014; Jiang et al., 2014; Zapata-Morales et al., 2014). The human kidney-derived HK-2 cell line, which is available as a human PTEC model (Ryan et al., 1994; Wilmer et al., 2010), has been used to evaluate the regulatory mechanism for the SGLT2 gene in PTECs of the human kidney (Panchapakesan et al., 2013). The principal portion of the kidney was divided into two distinct regions: renal cortex and renal medulla. The expression level was extremely higher in renal cortex than the renal medulla (You et al., 1995; Chen et al., 2010). The proximal tubule, which contains PTECs, is a portion of the renal cortex. Therefore, we performed in vitro analyses using the HK-2 cells derived from PTECs and the renal cortex to reveal the transcriptional profiles of the SGLT2 gene in the human kidney.
The regulatory mechanisms for SGLT2 gene expression in the human kidney remain unclear. Our results showed that HK-2 cells exhibited weak transcriptional activity for the SGLT2 gene (Fig. 1A). We demonstrated that the levels of SGLT2 mRNA and protein expression were extremely lower in HK-2 cells than the human kidney (Fig. 1, B and C). These results suggest that SGLT2 expression is not activated in HK-2 cells, which is derived from the PTEC of the human kidney. DNA methylation, which is a well-known epigenetic mechanism for transcriptional silencing (Jones and Baylin, 2007), plays an important role in the regulation of tissue-specific gene expression by inhibiting the binding of transcription factors to DNA (Song et al., 2005; Moore et al., 2013; Medvedeva et al., 2014). Previous studies have reported that kidney-specific expression of various genes is associated with DNA methylation of the promoter region around the TSS (Aoki et al., 2008; Kikuchi et al., 2010; Azuma et al., 2012). Our results of the assessment of CpG methylation using NOMe-Seq demonstrated that all CpG sites in SGLT2 5′-FR were highly methylated in HK-2 cells and the human kidney (Fig. 2A), suggesting that endogenous DNA methylation is not involved in the regulation of SGLT2 expression. In contrast, we found that 5′-FR in HK-2 cells was occupied by more nucleosomes than in the human kidney (Fig. 2B). The highly occupied 5′-FR in HK-2 cells was confirmed by NuSA (Fig. 2C). Nucleosome occupancy may regulate transcription by inhibiting the access of transcription factors to promoters (Lorch et al., 1987; Kornberg and Lorch, 1999). These results suggest that the weak SGLT2 transcriptional activity of HK-2 cells is due to high nucleosome occupancy in SGLT2 5′-FR.
Our results showed that the TSA treatment upregulated SGLT2 mRNA expression, induced the acetylation of histone H3, and decreased nucleosome occupancy in 5′-FR within approximately 300 bp upstream of the SGLT2 TSS (Figs. 3 and 4). TSA strongly increases the acetylation of the N-terminal tails of histone H3, which is a well-established acetylation target in nucleosome dynamics and gene activation (Choi and Howe, 2009; Hansen et al., 2010). Previous studies reported higher levels of histone H3 acetylation and lower nucleosome occupancy at active genes in promoter regions (Strenkert et al., 2011). Histone acetylation alters the nucleosomal conformation, which may increase the accessibility of transcriptional factors (Norton et al., 1989; Lee et al., 1993). Most transcribed genes have low nucleosome occupancy at promoters (Bell et al., 2011). These findings suggest that decreased nucleosome occupancy in SGLT2 5′-FR altered by the TSA-induced acetylation of histone H3 is involved in the upregulation of SGLT2 expression via the binding of transcription factors to 5′-FR.
Previous studies demonstrated that the TSA-mediated upregulation of gene expression is associated with histone H3 acetylation and the recruitment of HNF1α to the promoter (Yang et al., 2010). Our results using TSA-treated HK-2 cells showed an enhanced HNF1α-binding frequency in SGLT2 5′-FR (Fig. 5A). The knockdown of HNF1α decreased HNF1α protein levels in DMSO- or TSA-treated HK-2 cells (Fig. 5, B and C), but SGLT2 mRNA expression level was significantly decreased in TSA-treated cells, not in DMSO-treated cells (Fig. 5D). Furthermore, the HNF1α overexpression, which was confirmed by Western blot analysis (Supplemental Fig. 5), significantly enhanced the transcriptional activity of 5′-FR (Fig. 6). These results suggest that the upregulation of SGLT2 mRNA expression after the TSA treatment is associated with the enhanced HNF1α-binding frequency in 5′-FR. In contrast, the loss of HNF1α-mediated transcriptional activity was caused by the deletion of the predicted HNF1α binding site (Fig. 6). Previous studies reported that a promoter region of the rodent Sglt2 gene is located in 5′-FR around the HNF1α binding site (Pontoglio et al., 2000; Freitas et al., 2008). In addition, reduction in the HNF1α-binding frequency at the binding site suppresses SGLT2 mRNA expression (Zhao et al., 2016). Collectively, our results suggest that 5′-FR around the HNF1α binding site is a promoter region of the SGLT2 gene.
The upregulation of SGLT2 mRNA expression by HNF1α was observed in TSA-treated HK-2 cells (Fig. 7). The TSA treatment also caused a decrease in nucleosome occupancy in 5′-FR containing the HNF1α binding site (Fig. 4). Histone acetylation decreases nucleosome occupancy and enhances the accessibility of transcription factors to promoter regions (Li et al., 2005; Zampetaki et al., 2007; Haberland et al., 2009). These results indicate that nucleosome occupancy in 5′-FR plays a critical role in interfering with the binding of HNF1α, thereby regulating SGLT2 expression.
Previous studies reported that SGLT2 is predominantly expressed in the human kidney (Chen et al., 2010; Wright et al., 2011), whereas HNF1α is strongly expressed in the human kidney, liver, and small intestine (Cereghini, 1996; Harries et al., 2009; D’Angelo et al., 2010). Our results revealed markedly higher nucleosome occupancy in the human liver and small intestine than in the kidney (Fig. 8). In contrast, the results of the assessment of CpG methylation demonstrated that all CpG sites in SGLT2 5′-FR were highly methylated in the human kidney, liver, and small intestine (Fig. 2A; Supplemental Fig. 3B). These results suggest that the different nucleosome occupancy levels in these tissues may affect tissue-specific HNF1α-binding frequency and, thus, lead to tissue-specific SGLT2 expression. This hypothesis is supported by previous findings demonstrating that tissue-specific gene expression is associated with tissue-specific nucleosome occupancy in the upstream region of the TSS (Kikuchi et al., 2010; Chen et al., 2017).
The inhibition of SGLT2 has been reported as a new therapeutic strategy for diabetes (Chao and Henry, 2010; Terami et al., 2014). Previous studies demonstrated that SGLT2 expression levels are increased in patients with type 2 diabetes (Rahmoune et al., 2005; Wang et al., 2017). In contrast, the recent study reported that SGLT2 expression was significantly higher in healthy controls than participants with type 2 diabetes (Solini et al., 2017). Decreased SGLT2 expression levels were observed in patients with maturity onset diabetes of the young type 3 (Pontoglio et al., 2000), caused by mutations in the HNF1α gene (Menzel et al., 1998). However, the mechanisms responsible for the regulation of SGLT2 expression in these diabetic patients remain unclear. Our results demonstrated that SGLT2 expression levels are associated with the HNF1α-binding frequency in 5′-FR. An increased HNF1α-binding frequency in the Sglt2 promoter region is involved in the diabetes-induced overexpression of Sglt2 in the rat kidney (Freitas et al., 2008). In addition, a high sodium intake suppresses SGLT2 expression by reducing the HNF1α-binding frequency in 5′-FR (Zhao et al., 2016). Therefore, a clearer understanding of the HNF1α-binding frequency in 5′-FR in the human kidney will provide new insights into how SGLT2 expression is regulated in diabetic patients.
In conclusion, our results clearly demonstrate that the transcriptional regulatory mechanisms for the SGLT2 gene are controlled by nucleosome occupancy and HNF1α binding in the SGLT2 promoter. This is the first study on epigenetic mechanisms to regulate SGLT2 expression in human tissues. Further studies are required to investigate in more detail the histone modifications causing alterations in nucleosome occupancy in the SGLT2 gene related to the regulation of SGLT2 expression.
Acknowledgments
We thank the Research Support Center, Graduate School of Medical Sciences, Kyushu University, for technical support.
Authorship Contributions
Participated in research design: Takesue, Hirota, Ieiri.
Conducted experiments: Takesue, Hirota, Tachimura, Tokashiki.
Performed data analysis: Takesue, Hirota.
Wrote or contributed to the writing of the manuscript: Takesue, Hirota, Ieiri.
Footnotes
- Received January 16, 2018.
- Accepted June 27, 2018.
This work was supported by Japan Society for the Promotion of Science KAKENHI [Grant JP17K08954].
↵
 This article has supplemental material available at molpharm.aspetjournals.org.

Abbreviations
- 5′-FR
- 5′-flanking region
- ChIP
- chromatin immunoprecipitation
- DMSO
- dimethylsulfoxide
- HNF
- hepatocyte nuclear factor
- NOMe-Seq
- nucleosome occupancy and methylome sequencing
- NuSA
- nucleosome-scanning assay
- PCR
- polymerase chain reaction
- PTEC
- proximal tubule epithelial cell
- SGLT2
- sodium-glucose cotransporter 2
- siHNF1α
- HNF1α siRNA
- siRNA
- small interfering RNA
- TSA
- trichostatin A
- TSS
- transcription start site
- Copyright © 2018 by The American Society for Pharmacology and Experimental Therapeutics


