


Abstract
Guanine nucleotide-binding proteins (G proteins) facilitate the transduction of external signals to the cell interior, regulate most eukaryotic signaling, and thus have become crucial disease drivers. G proteins largely function at the inner leaflet of the plasma membrane (PM) using covalently attached lipid anchors. Both small monomeric and heterotrimeric G proteins are primarily prenylated, either with a 15-carbon farnesyl or a 20-carbon geranylgeranyl polyunsaturated lipid. The mevalonate [3-hydroxy-3-methylglutaryl-coenzyme A (HMG-CoA) reductase] pathway synthesizes lipids for G-protein prenylation. It is also the source of the precursor lipids for many biomolecules, including cholesterol. Consequently, the rate-limiting enzymes of the mevalonate pathway are major targets for cholesterol-lowering medications and anticancer drug development. Although prenylated G protein γ (Gγ) is essential for G protein–coupled receptor (GPCR)-mediated signaling, how mevalonate pathway inhibitors, statins, influence subcellular distribution of Gβγ dimer and Gαβγ heterotrimer, as well as their signaling upon GPCR activation, is poorly understood. The present study shows that clinically used statins not only significantly disrupt PM localization of Gβγ but also perturb GPCR-G protein signaling and associated cell behaviors. The results also demonstrate that the efficiency of prenylation inhibition by statins is Gγ subtype-dependent and is more effective toward farnesylated Gγ types. Since Gγ is required for Gβγ signaling and shows a cell- and tissue-specific subtype distribution, the present study can help understand the mechanisms underlying clinical outcomes of statin use in patients. This work also reveals the potential of statins as clinically usable drugs to control selected GPCR-G protein signaling.
Introduction
As a major source of morbidity and mortality in developed countries, cardiovascular diseases, specifically coronary heart diseases, have been in the spotlight for years. Most patients with cardiovascular diseases are diagnosed with atherosclerosis, which is associated with elevated serum cholesterol levels (Gordon and Kannel, 1971; Sytkowski et al., 1990). Although a fraction of serum cholesterol comes from dietary cholesterol, it is regulated primarily through hepatic cholesterol biosynthesis by the mevalonate pathway (Hajar, 2011) (Fig. 1A). The rate-limiting step of cholesterol biosynthesis in the liver is the conversion of 5-hydroxy-3-methylglutaryl-coenzyme A (HMG-CoA) to mevalonic acid (Rodwell et al., 1976). The enzyme HMG-CoA reductase catalyzes this process (Goldstein and Brown, 1990). Inhibitors of HMG-CoA reductase, also called statins, are heavily prescribed to reduce serum cholesterol. Initially, statins were identified as secondary metabolites in fungi, and mevastatin is the first natural statin to be identified (Endo et al., 1976; Alberts, 1988). All statins contain a region that resembles the HMG moiety and thus bind to the active site of the HMG-CoA reductase enzyme (Istvan and Deisenhofer, 2001). As a result, statins reversibly inhibit the enzymatic activity of HMG-CoA reductase and reduce mevalonic acid production (Istvan and Deisenhofer, 2001).
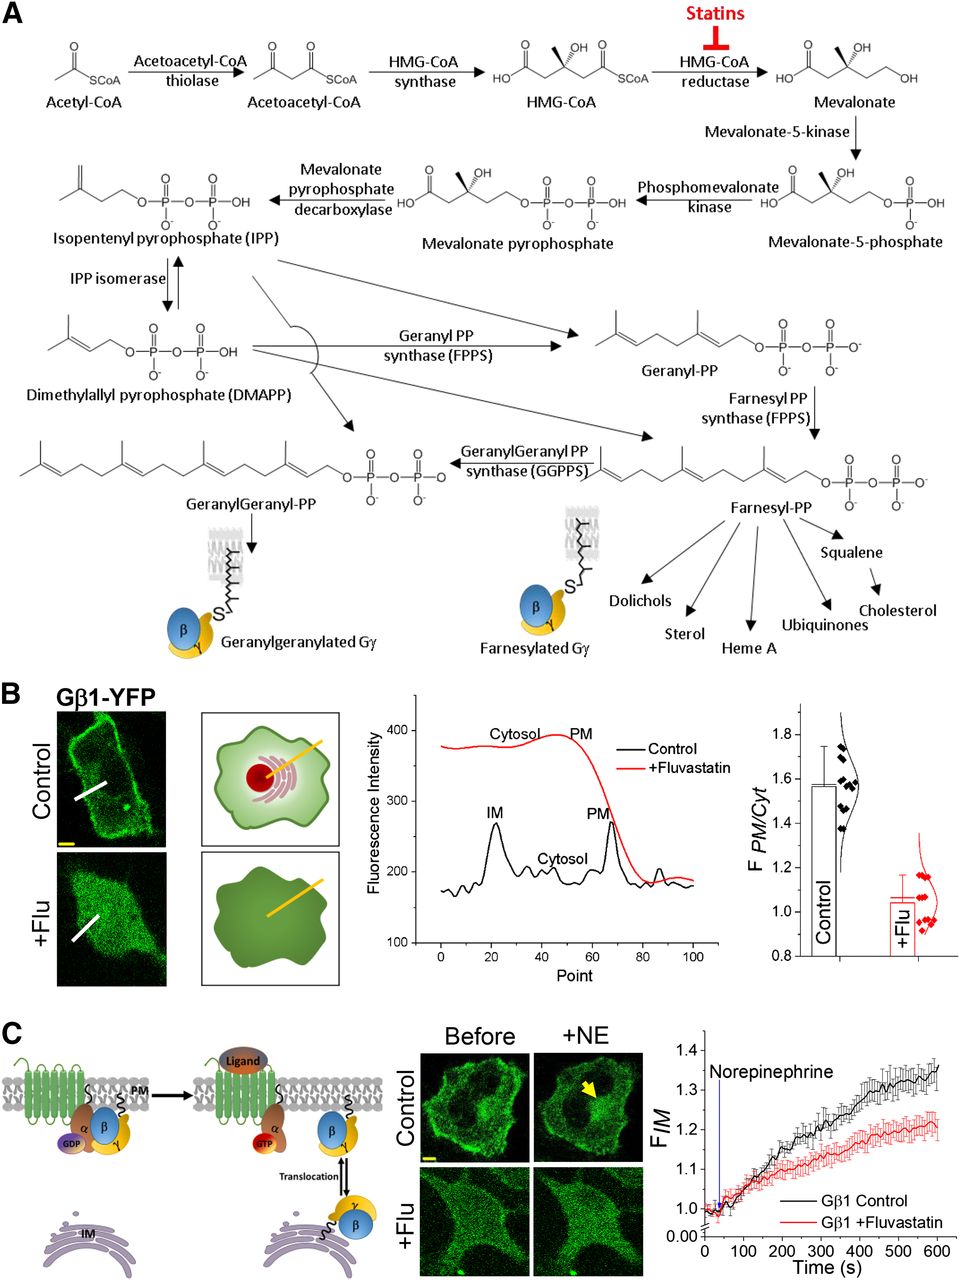
G-protein prenylation and fluvastatin induced inhibition of Gβ1γ localization on the PM. (A) Major steps of the hepatic cholesterol biosynthesis/mevalonate pathway. By inhibiting the rate-limiting step enzyme HMG-CoA reductase, statins reduce the biosynthesis of many lipids, including cholesterol. (B) Quantification of statin-mediated inhibition of G-protein PM localization in living cells. Images of HeLa cells expressing Gβ1-YFP. Cells treated with 2 μM fluvastatin exhibited a complete cytosolic distribution of Gβ1, whereas control cells showed primarily PM- and IM-localized Gβ1-YFP. Cartoon shows how the line-profile data were obtained to calculate the G proteins distribution ratio (FPM/Cytosol) in control and Fluvastatin-treated cells. Bar graph shows FPM/Cytosol < 1.0 for fluvastatin treated cells since Gβ1 is cytosolic, likely because of a lack of prenylation (error bars: S.E.M., n = 12 cells, P < 0.05). (C) Left: GPCR activation induced translocation of Gβγ dimer from the PM to IMs. In the GPCR-inactive state, G-protein heterotrimers reside on the PM, and upon activation, heterotrimers dissociate, generating Gα-GTP and free Gβγ. The resultant Gβγ then can translocate from the PM to IMs in a Gγ-type–dependent manner. Middle: Images show translocation of Gβ1 in control HeLa cells upon activation of endogenous α2-AR with 100 μM norepinephrine (NE). Fluvastatin-treated cells exhibited ∼50% attenuated translocation. Right: The plot shows the translocation dynamics of Gβ1. Yellow arrows indicate translocated Gβ1 on IMs (scale bar, 5 μm, error bars: S.E.M., n = 20 cells, two-tailed t test was performed after the time point the response reached equilibrium; data are statistically significant at the 0.0001 level).
Numerous side effects are associated with statin use, including myopathic effects, short-term memory loss, abnormal liver function, glucose intolerance, hyperglycemia, and increased risk for diabetes (Golomb and Evans, 2008; Davies et al., 2016; Ramkumar et al., 2016). Up to 25% of statin users report muscle symptoms, cramping, soreness, and fatigue, thereby forcing many patients to switch to lower doses, switch to lower potency statins, or to withdraw (Carris et al., 2017). Statins are also associated with ocular adverse effects, including blurred vision, visual impairment, visual-field defect, reduced visual acuity, myopia, hypermetropia, presbyopia, and astigmatism (Machan et al., 2012; Mizranita and Pratisto, 2015). Whereas one retrospective study indicated that all statins are associated with ocular side effects, atorvastatin showed higher incidences of muscle and liver problems (Mizranita and Pratisto, 2015). Age-related cataracts have occurred more frequently in patients receiving statin therapy (Machan et al., 2012). Furthermore, chronic cholesterol depletion using statins has impaired human serotonin 1A receptor function (Shrivastava et al., 2010).
Besides cholesterol, mevalonate pathway synthesizes several important lipid precursors, such as polyisopreneoids and sterols (Miziorko, 2011). Isoprenoid lipids—farnesyl pyrophosphate (FPP) and geranylgeranyl pyrophosphate (GGPP)—provide membrane-anchoring abilities to many proteins and thus are required for numerous functions, including cytoskeletal reorganization, differentiation, and proliferation (Casey, 1992; Chan et al., 2003; Buhaescu and Izzedine, 2007). FPP and GGPP are precursor lipids for G-protein prenylation. GPCRs and G proteins govern numerous biological processes and have become therapeutic targets in areas that include cancer, cardiac dysfunction, diabetes, central nervous system disorders, obesity, inflammation, vision, and pain. G protein–mediated signaling process consists of GPCRs, heterotrimeric G proteins Gα, Gβγ, and their effectors. Gα and Gβγ act as switches that transmit information from cell-surface receptors to intracellular effectors. N and C termini (NT and CT) of Gα and Gγ, respectively, are post-translationally modified with lipid anchors, facilitating heterotrimer formation and their anchoring to the plasma membrane (PM). N-myristoylation and N-palmitoylation mediate Gα-PM interactions (Chen and Manning, 2001). We showed that distinct PM-interacting properties of 12 mammalian Gγ types are controlled by their CT sequences (Senarath et al., 2018). This sequence comprises a polybasic pre-CaaX region and a CaaX motif (Watson et al., 1994; Wedegaertner et al., 1995; Cook et al., 2006). CaaX motif Cys is prenylated either with a 15-carbon farnesyl or 20-carbon geranylgeranyl polyunsaturated lipid anchors (Wedegaertner et al., 1995). Type of prenylation is dictated primarily by the CaaX motif sequence of each Gγ subtype (Wedegaertner et al., 1995), and lipid anchors for prenylation are synthesized by the HMG-CoA pathway (Lacher et al., 2017). Not only Gγ, but many other Ras superfamily G proteins, also use prenylation for membrane targeting. How statins perturb prenylation of Ras members has been extensively studied (Cordle et al., 2005; Dai et al., 2007; Mörck et al., 2009). Anticancer effects of statins are assigned to their ability to downregulate oncogenic Ras (Wong et al., 2002; Chan et al., 2003; Greenwood et al., 2006). Several studies have suggested that statins reduce isoprenylation of Gγ and subsequently attenuate GPCR signaling (Mühlhäuser et al., 2006; Schmechel et al., 2009); however, considering the necessity of Gγ for Gβγ signaling and their diverse cell- and tissue-wide expression, molecular details, including whether statins universally and equally inhibit prenylation of Gγ members and attenuate GPCR-G protein signaling, are not sufficiently explored.
Materials and Methods
Materials.
HeLa, adult retinal pigment epithelial-19 (ARPE-19), and RAW 264.7 mouse macrophage cell lines were purchased from American Type Culture Collection (Rockville, MD). Cell culture media—minimum essential medium (MEM), Dulbecco’s modified Eagle’s medium/nutrient mixture F-12, and Roswell Park Memorial Institute medium (RPMI 1640)—were obtained from Gibco-Thermo Fisher Scientific (Waltham, MA). FBS and dialyzed FBS (DFBS) were purchased from Atlanta Biologicals (Hall County, GA). The reagents included Lipofectamine 2000 (Thermo Fisher), fluvastatin, atorvastatin, lovastatin, and gallein (Cayman Chemical, Ann Arbor, MI), norepinephrine, and isoproterenol hydrochloride (Sigma-Aldrich, St. Louis, MO), c5a (ANASPEC, Fremont, CA), Fluo-4 AM (Molecular Probes, Eugene, OR), and 11-cis-retinal (National Eye Institute, Bethesda, MD).
DNA Constructs.
Blue opsin-mTurquoise, α2-AR-cyan fluorescent protein (CFP), Akt-PH-mCherry (mCh), GFP-Gγ9, GFP-Gγ3, Gβ1-yellow fluorescent protein (YFP), YFP-Gγ2, Gγ4, Gγ5, GFP-Rac1, and untagged K-Ras and M-Ras were kindly provided by Professor N. Gautam’s laboratory (Washington University, St. Louis, MO). mCh was amplified from Akt-PH-mCh with NheI and HindIII restriction sites and performed the restriction digestion of both Ras isoforms (vector: untagged K-Ras and M-Ras) and amplified mCh (insert). Digested insert and vectors were ligated and chemically transformed to generate N-terminally mCh-tagged K-Ras and M-Ras constructs. Nanobody 80 (Nb80) was kindly provided by Dr. Roshanak Irannejad (University of California, San Francisco, CA). To generate the Nb80-mCh construct, G-protein receptor kinase 2 (GRK2)-mCh was digested with BamHI and XbaI to remove GRK2. Polymerase chain reaction (PCR) product of Nb80 was then inserted into remaining mCh vector backbone, finally producing Nb80-mCh. Venus-GRK3ct was kindly provided by Dr. Nevin Lambert. mCh-Gγ3(C72A) construct was generated by substituting Cys 72 residue in mCh-Gγ3 with an Ala residue using the overlap PCR method.
Cell Culture and Transfections.
HeLa cells were cultured in MEM/10% DFBS/1% penicillin-streptomycin medium in a humidified 5% CO2 incubator at 37°C. RAW 264.7 cells were cultured in RPMI 1640/10% DFBS with 1% penicillin-streptomycin, and ARPE-19 cells were cultured in Dulbecco’s modified Eagle’s medium/nutrient mixture F-12 10% FBS/ with 1% penicillin-streptomycin. At 70%–80% confluency, the growth medium was aspirated, and cells were incubated with Versene EDTA (CellGro) for 2 minutes at 37°C. After incubation, cells were lifted and centrifuged at 1000g for 3 minutes. Versene-EDTA was then aspirated, and the cell pellet was resuspended in the growth medium and seeded on glass-bottomed dishes (In Vitro Scientific, Sunnyvale, CA) with a 1 × 10⁵/ml cell density. The following day, after seeding, Lipofectamine 2000–mediated transfection was performed according to the manufacturer’s instructions. After 3.5 hours of transfection, cells were replenished with the growth medium containing either dimethylsulfoxide (DMSO) or respective statins. The next day, live-cell imaging was performed.
Live-Cell Imaging, Confocal Microscopy, and Data Analysis.
An imaging system composed of a Nikon Ti-R/B–inverted total internal reflection microscope, a Yokogawa CSU-X1 spinning-disk unit (5000 rpm), an Andor FRAPPA (fluorescence recovery after photo-bleaching and photo-activation) module, and iXon ULTRA 897BV back illuminated deep-cooled EMCCD camera was used for live-cell imaging as well as optogenetics experiments. Grayscale confocal images were captured on to 512 × 512-pixel CCD with 16 × 16 μm2-pixel size. Pixel depths of the active area and gain register were, respectively, 180,000 e- and 800,000 e-. Images were acquired with 50-millisecond exposure with four-frame averaging. The EM gain was set for 300. Four, 40−100 mW 445, 488, 515, and 594 nm solid-state lasers and an acousto-optical tunable filter were used for excitation, optical activation, as well as photobleaching. Live-cell imaging was performed using 60×, 1.4 NA (numerical aperture) oil objective. Emission filters 478 ± 20 nm [cyan fluorescent protein (CFP), mTurquoise], 488 ± 20 nm [enhanced green fluorescence protein (eGFP)], 542 ± 30 nm [yellow fluorescent protein (YFP), and Venus], and 630 ± 30 nm (mCherry) were used, respectively, with 445 nm (∼40 μW), 488 nm (∼30 μW), 515 nm (∼20 μW), and 595 nm (∼60 μW) excitation lasers. The power listed was measured at the focal plane of the 60× objective using 1-cm2 sensor (Ophir PD300, North Logan, UT). For optical activation of blue opsin using the FRAPPA raster scanning, selected regions of cells were exposed to 445 nm (0.2–1.0 μW at the objective) light. Before optical activation, cells were incubated with 50 µM 11-cis-retinal for 3–5 minutes in dark. Digital image analysis was performed using Andor iQ 3.1 software (Andor Technology, South Windson CT), and color values were normalized using in-built Look Up Table tools in iQ 3.1, maintaining an approximately constant setting for each fluorescence sensors. Fluorescence intensities obtained from regions of interest (PM, IMs, and cytosol) were baseline normalized using the intensity of the background. Normalized data were then plotted using Origin Pro (OriginLab Corporation, Northamptom, MA). Results of all quantitative assays (Gβγ translocation, phosphatidylinositol 3,4,5-triphosphate generation, and calcium responses) in time curves were expressed with the S.E.M. from n number of cells (indicated in the figure legends).
Intracellular Ca2+ Measurements.
To measure cytosolic Ca2+, RAW 264.7 cells were cultured on glass-bottomed dishes with RPMI 1640/DFBS at 37°C with 5% CO2 as described in Cell Culture and Transfections section. Experiments were performed 2 days after seeding cells on glass-bottomed dishes. The day after seeding, cells were treated with 10 μM fluvastatin and incubated overnight in the 37°C incubator with 5% CO2. The following day, cells were washed twice with 1% (v/v) Hanks’ balanced salt solution containing NaHCO3 and Ca2+ (pH 7.2) supplemented with 10 μM fluvastatin. Washed cells were then incubated for 30 minutes at room temperature with a fluorescent calcium indicator, Fluo-4 AM (2.28 μM), and supplemented with 10 μM fluvastatin in dark conditions. Before the start of imaging, cells were again washed twice with 1% v/v) Hanks’ balanced salt solution containing NaHCO3, Ca2+, and 10 μM fluvastatin to remove excess Fluo-4 AM. Processed cells were imaged to capture fluorescent intensity of Fluo-4 AM (488 nm) at 1-second intervals using 488-nm excitation/515-nm emission after addition of 20 μM c5a to activate endogenous c5a receptors. The control cells were treated with the vehicle solvent DMSO and imaged the same way as fluvastatin-treated cells.
Western Blot Analysis.
After 12-hour incubation, with either carrier solvent (DMSO) or fluvastatin (2 μM), RAW 264.7 cells were exposed to 12.5 μM c5a for 30 minutes to activate endogenous c5aR. After incubation, cells were lysed, and the whole-cell lysate was subjected to SDS-PAGE to separate proteins. Proteins were transferred to a polyvinylidene fluoride membrane. After blocking with 5% nonfat milk, the membrane was incubated with the primary antibodies specific for p-Akt, t-Akt, and β-actin (no. 4060S; Cell Signaling, sc-5298, sc-47778; Santa Cruz, CA) overnight at 4°C. The next day, the membrane was incubated with the appropriate horseradish peroxidase–conjugated secondary antibodies (no. 1705047, no. 1705046; Bio-Rad, Hercules, CA) at room temperature for 2 hours. After incubating with chemiluminescent detection solutions, the membrane was exposed to an X-ray film. The protein-band intensities on X-ray films were quantified and normalized to the level of β-actin. Experiments were performed in triplicate with independent biologic replicates; quantification and statistical analysis were performed.
Transwell Invasion Assay.
Transwell invasion chambers (with 8-μm membrane pores) were coated with 1× Matrigel (100 μl). The next day, RAW 264.7 cells preincubated with DMSO, fluvastatin (2 μM), Rho-A inhibitors (EHop-016, 5 μM; EHT1864, 10 μM; GSK269962, 12.5 μM), or wortmannin (50 nM) for 24 hours were transferred on top of Matrigel-coated invasion chambers in serum-free RPMI (5 × 10⁴ cells/well). In transwell chambers, cells were also treated with either DMSO or the above-listed inhibitors. To asymmetrically activate endogenous c5aR, RPMI containing 10% DFBS with 12.5 μM c5a was added to the lower chambers. After incubation for 24 hours at 37°C and 5% CO2, the invaded cells on the lower surface of the insert membrane were fixed and stained using the Fisher HealthCare PROTOCOL Hema 3 fixative and solutions (Fisher Scientific) according to the manufacturer’s protocol. The number of invaded cells were counted under a light microscope at 200× total magnification. Every experiment was performed in triplicate, and all experiments were repeated four times over different days.
Statistics and Reproducibility.
Results of all quantitative assays (Gβγ translocation, PIP3 generation, cell migration, and Ca2+ response) were calculated as the mean ± S.E.M. or S.D. with the listed number of cells in figure legends from multiple independent experiments (˃3). P < 0.05 was considered the threshold for statistical significance. Distinct cellular conditions such as Gγ9 and Gγ3 cells and (or) exposed to several statins were compared using one- or two-way analysis of variance (ANOVA) to assess statistical significance. Statistical analyses of data, including Ca2+ and G-protein translocation responses for control and statin-treated cells, were performed using two-tailed unpaired t test. P < 0.05 was considered significant. Both Ca2+ and Western blot analysis data were presented as mean ± S.D.
Results
Statins Disrupt PM Localization and Signaling of Endogenous Gβγ in HeLa Cells
The goal was to examine whether statins interrupt the PM localization of endogenous Gβγ and their signaling activation by GPCRs in HeLa cells. Cells were transfected with Gβ1-YFP by incubating cells with transfection medium containing Lipofectamine 2000 reagent for 3.5 hours, and subsequently cells were transferred to the regular culture medium, additionally containing statins [i.e., fluvastatin (2 μM), lovastatin (2 μM), or atorvastatin (20 μM)] for 12 hours. These concentrations were selected considering their IC50 values (Martín-Navarro et al., 2013). In place of statins, control cells were treated with DMSO, the vehicle solvent of statins. Confocal time-lapse images of cells were captured using a 60× objective with a 1.49 NA. Subcellular distribution of GFP-Gβ1 was captured using 488-nm excitation and 515-nm emission. Cells treated with fluvastatin (+flu) exhibited primarily a cytosolic Gβ1 distribution (Fig. 1B, bottom), whereas control cells showed primarily a PM and a somewhat internal membrane (IM) distribution (Fig. 1B, top). Cytosolic GFP-Gβ1 distribution indicates that the associated Gγ lacks the prenyl modification at the Cys residue of the CaaX motif. Prenylated Gβγ usually resides either on the PM or IMs. To obtain a numerical value to quantify the extent of inhibition of PM localization, the ratio between fluorescence intensities of Gβ1-YFP on the PM and cytosol (FPM/Cytosol) was calculated. A line profile of fluorescence intensities across the PM to the cytosol was measured (Fig. 1B, cartoon and plot), and average fluorescence intensities on the PM and cytosol were calculated. Calculations showed FPM/Cytosol ≤ 1 for cells with completely inhibited PM localization of Gβγ and FPM/Cytosol > 1 for cells with a partial to no inhibition. Deviation of FPM/Cytosol of a treated cell from its control represents the extent of the presence of cytosolic Gβγ, indicating the extent of presumptive prenylation inhibition. For Gβ1 distribution, FPM/Cytosol was 1.04 ± 0.09 for +flu cells (Fig. 1B, bar graph). The images show that in the +flu cell, a distinguishable PM region is lacking since fluorescence in the cytosol and the PM is similar. The plot shows the steep drop in the intensity (red curve) at the edge of the cell to the level of the extracellular background. Overall, contrary to the control cell, +flu data suggest strong prenylation inhibition by fluvastatin. Next, the effect of fluvastatin on the availability of G- protein heterotrimers to be activated by GPCR was examined using GPCR activation induced Gβ1γ translocation. We have previously shown that, upon GPCR activation, Gβγ translocates from the PM to IMs (Ajith Karunarathne et al., 2012) (Fig. 1C, cartoon). Control HeLa cells exhibited a robust translocation of Gβ1-YFP upon activation of endogenous α2-ARs with 100 μM norepinephrine (Fig. 1C, top panel and plot); however, +flu cells exhibited 42.85% attenuated translocation (Fig. 1C, bottom panel and plot). This finding suggests it is likely that fluvastatin disrupts endogenous Gγ prenylation and thereby attenuates heterotrimer formation as well as Gβγ translocation.
Fluvastatin-Induced Inhibition of Gγ PM Localization is Gγ Identity-Dependent
The goal was to examine whether fluvastatin equally and universally inhibits PM localization of all Gγ types. This is crucial since Gγ shows a cell- and tissue-type specific distribution (Cali et al., 1992). Compared with the control HeLa cells, which exhibited GFP-Gγ9 distribution on the PM, +flu cells exhibited a completely cytosolic GFP-Gγ9 distribution (Fig. 2A, left images and bar graph). Upon activation of endogenous α2-AR, control cells exhibited a robust translocation of GFP-Gγ9 to IMs, indicating G-protein activation and heterotrimer dissociation (Fig. 2A, +NE-top images and plot). By contrast, fluvastatin-treated cells exhibited only a minor increase in their already cytosolic GFP-Gγ9 after α2-AR activation (Fig. 2A, +NE, +flu images and plot). Like Gγ9, control HeLa cells expressing geranylgeranylated GFP-Gγ3 also showed a prominent PM distribution (Fig. 2B, bottom left and bar graph). Even after 12-hour exposure to fluvastatin, Gγ3 was seen primarily on the PM, and only a minor cytosolic distribution was observed (Fig. 2B, middle left and bar graph). This nearly unperturbed PM-bound GFP-Gγ3 fluorescence in fluvastatin-treated cells indicated that perhaps a considerable population of Gγ3 is still prenylated. Activation of endogenous α2-AR receptors in both +flu and control cells exhibited GFP-Gγ3 translocation from the PM to IMs but exhibited a 1/3 lower magnitude in +flu cells (Fig. 2B, plot). These data suggest that fluvastatin is likely to attenuate prenylations of Gγ3 to a level that induces a detectable reduction of heterotrimer activation and free Gβγ translocation. To validate that the remaining PM-bound fraction of Gγ observed after fluvastatin treatment is still prenylated, we examined the subcellular distribution of a prenylation-deficient Gγ3 mutant. We generated Gγ3(C72A) mutant to eliminate its prenylation, and in HeLa cells, this mutant exhibited a completely cytosolic distribution (Supplemental Fig. 1A). This Gγ distribution was similar to the Gγ9 distribution observed in +flu cells. Therefore, we anticipated that membrane- bound Gγ is prenylated and that cytosolic Gγ lacks prenylation.

Fluvastatin differentially attenuates the PM localization of Gγ9 and Gγ3. (A) Images of control cells pretreated with the carrier solvent (DMSO) exhibited a clear distribution of GFP-Gγ9 on the PM, indicating prenylated Gγ9. Fluvastatin-treated cells showed near-complete cytosolic GFP-Gγ9, suggesting a complete inhibition of Gγ9 prenylation. +Flu + mevalonate cells show that supplementation of mevalonate abrogates fluvastatin action. Bar graphs show that of +flu cells with FPM/Cytosol ≤ 1, exhibiting lack of GFP fluorescence on the PM; both control and +flu + mevalonate cells with FPM/Cytosol > 1 indicating the PM-bound GFP fluorescence. Images (left) and the plot show endogenous α2-AR activation mediated Gγ9 translocation only in control and +flu + mevalonate cells. The t statistics show that at P < 0.05, mean FPM/Cytosol are not significantly different for control and +flu +mevalonate cells. In contrast, translocation in Fluvastatin-treated cells were significantly attenuated, indicating a lack of PM-bound heterotrimers (error bars: S.E.M., n = 12 cells; two-tailed t test was performed after the time point the response reached equilibrium, and the data are statistically significant at 0.05 level). (B) Partial prenylation inhibition of GFP-Gγ3 in HeLa cells. Like GFP-Gγ9-expressing cells, control and +flu + mevalonate cells showed that GFP-Gγ3 is on the PM. In contrast to Gγ9, +flu cells showed GFP-Gγ3 distribution only on the PM, whereas no Gγ3 residing in IMs is observed. Upon endogenous α2-AR activation, cells in all three conditions exhibited translocation. The plot (right) shows a ∼1/3 magnitude lower translocation in +flu cells compared with controls and +flu + mevalonate cells, which indicates that fluvastatin can attenuate Gβγ3 activation. Yellow arrows indicate Gβγ translocated to IMs (Scale bar, 5 μm, error bars: S.E.M., n = 15 cells; two- tailed t test was performed after the time point the response reached equilibrium, and the data are statistically significant at the 0.05 level).
To confirm that statins inhibit membrane attachment of Gγ by inhibiting mevalonate synthesis, HeLa cells expressing either GFP-Gγ3 or GFP-Gγ9 were exposed to fluvastatin (2 μM) for 12 hours in the presence and absence of mevalonate (0.5 mM). In contrast to control cells exposed to fluvastatin alone, Gγ9 and Gγ3 in +flu- and mevalonate-treated cells showed a completely PM distribution (Fig. 2, middle and bottom). These cells also exhibited translocation- like untreated cells upon endogenous α2-AR activation (Fig. 2, plots); however, +flu cells exhibited a 10-fold lower extent of translocation for Gγ9 and ∼2-fold lower for Gγ3 than the respective control cells. Additionally, Gγ9 distribution in cells exposed to farnesyl transferase inhibitor lonafarnib was similar to that of fluvastatin-treated cells (Supplemental Fig. 1E). These data collectively show that fluvastatin-induced inhibition of Gγ membrane anchoring is due to inhibition of mevalonate and subsequent reduction of isoprenyl pyrophosphate synthesis. These data also clearly show that the observed lack of Gγ PM attachment is not due to a nonspecific effect of statins on the cell cycle.
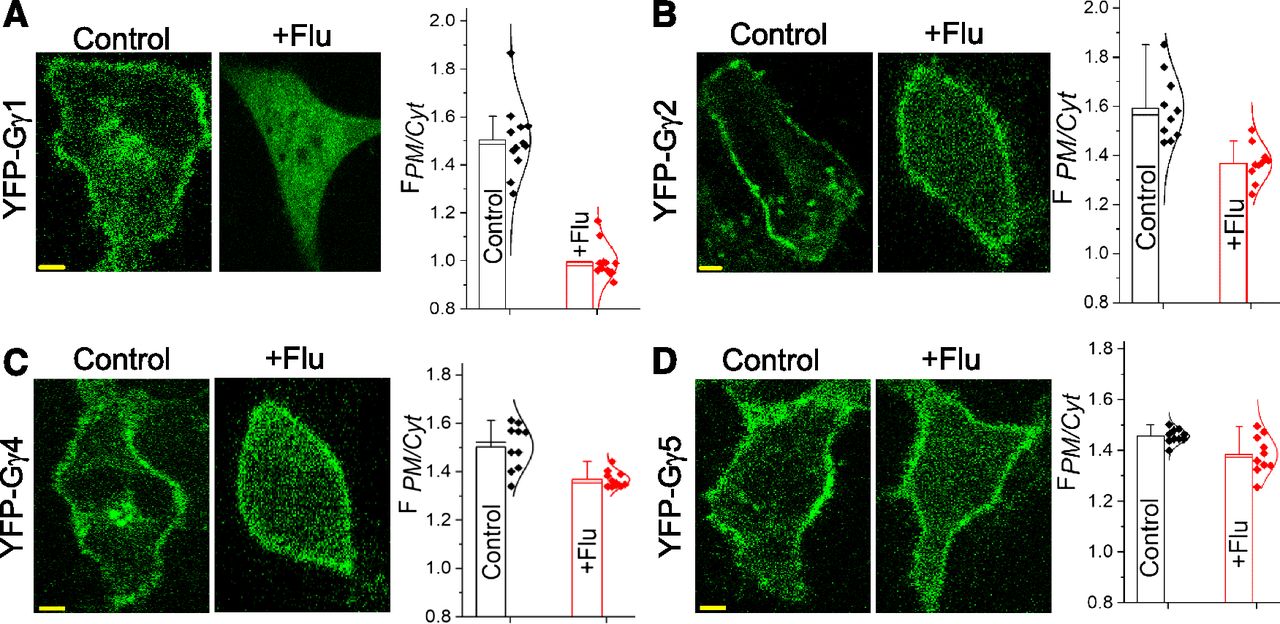
Since Gγ9 and Gγ3 are respectively considered farnesylated and geranylgeranylated based on their CaaX motif sequences, we examined whether the PM interaction of other farnesylated as well as geranylgeranylated Gγ types are similarly disrupted by fluvastatin. Like Gγ9, Gγ1 is identified as a farnesylated protein, and +flu cells exhibited a completely cytosolic distribution of YFP-Gγ1, whereas control cells showed a prominent PM distribution (Fig. 3A). Except Gγ1 9 and 11, other Gγ types are considered primarily geranylgeranylated. Fluvastatin-treated Gγ2- expressing cells exhibited a partial inhibition of YFP-Gγ2 membrane attachment (Fig. 3B), similar to that of Gγ3. Compared with Gγ1, fluvastatin also induced a more pronounced cytosolic distribution of Gγ4 and Gγ5 (Fig. 3, C and D). Nevertheless, control cells expressing these Gγ subtypes always exhibited primarily PM distributions (Fig. 3, A–D). To further support our observation that the PM localization of farnesylated Gγ types are more effectively inhibited by fluvastatin than by geranylgeranylated Gγs, the extent of observed inhibitions in +flu cells across Gγ types were normalized to their untreated controls (Supplemental Fig. 1B). Of the four Gγ types compared, the greatest inhibition of membrane anchorage was observed in Gγ1, whereas Gγ2, 4, and 5 are less affected by fluvastatin. Overall, the data suggest that presumptively fluvastatin inhibits farnesylation more effectively than geranylgeranylation.

Fluvastatin has distinct inhibition abilities of membrane localization of Gγ1, Gγ2, Gγ4, and Gγ5. HeLa cells expressing (A) YFP-Gγ1 (B) YFP-Gγ2 (C) YFP-Gγ4 and (D) YFP-Gγ5, pretreated overnight with 2 μM fluvastatin during transfection. Control cells showed a clear localization of Gγ on the PMs and in IMs. Fluvastatin-treated cells showed a complete cytosolic distribution of Gγ1-, Gγ2-, Gγ4-, and Gγ5-transfected cells exposed to fluvastatin and showed only a partial presence of YFP in the cytosol, similar to GFP-Gγ3 cells exposed to fluvastatin. Bar graphs show FPM/Cytosol in control and +flu cells in which Gγ1, Gγ2, and Gγ4 show a significant increase in cytosolic YFP compared with control cells; however, no significant difference in FPM/Cytosol of Gγ5 cells was observed between control and +flu conditions. (Scale bar, 5 μm, error bars: S.D., 10 < n < 15 cells, P < 0.05).
Heterotrimeric G proteins shuttle between the PM and IMs, as heterotrimers at the GPCR-inactive state and as free Gβγ (Ajith Karunarathne et al., 2012). Regardless of the type of Gγ in the heterotrimer, inactive-state shuttling allows heterotrimers to maintain a pool at IMs, whereas most heterotrimers reside at the PM. To examine whether fluvastatin treatment alters relative PM-IM distribution of heterotrimers, HeLa cells cotransfected with the endoplasmic reticulum marker, CFP-KDEL, and either GFP-Gγ9 or GFP-Gγ3 were exposed to fluvastatin. Unlike control cells which show heterotrimers on the PM and in IMs, both Gγ types were not observed in IMs in +flu cells; however, CFP-KDEL expression remained unchanged, indicating an intact endoplasmic reticulum (Supplemental Fig. 1C). This indicates that PM is the primary location for heterotrimers, and we anticipate that when cells have a surplus heterotrimers, they are docked in IMs. Since fluvastatin treatment is likely to reduce heterotrimer availability, as indicated by universal reduction of Gβγ translocation (Fig. 2), we hypothesize that +flu cells can accommodate the available heterotrimers at the PM. Additionally, the effect of statins on Gα distribution was examined by expressing Gαo-CFP, Gβ1-mCh, and Gγ9-YFP in the same cell. Although Gβ1 and Gγ9 showed primarily a cytosolic distribution, Gα stayed PM-bound in most cells (Supplemental Fig. 1D).
Mitigation Potentials of G Protein-Membrane Interactions of Different Statins Are Diverse
We compared how different statins perturb G protein-membrane interactions presumptively by reducing G-protein prenylation. In place of 2 μM fluvastatin, HeLa cells were exposed to either 2 μM lovastatin or 20 μM atorvastatin, and their effects on GFP-Gγ9 or GFP-Gγ3 distribution in HeLa cells were examined (Martín-Navarro et al., 2013) (Fig. 4A, top panel and plot). Two-way ANOVA shows that Gγ3 and Gγ9 responses to statins significantly differ, F (1,12) = 41.2, P < 0.05, such that the average inhibition was significantly higher for Gγ9; mean = 51.2%, S.E.M. = 10.8) than for Gγ3 (mean = 22.8%, S.E.M. = 5.4). The inhibitory effect on Gγ membrane interactions of drugs were also significant, F (2, 12) = 63.2, P > 0.05 such that +flu effect was significantly higher (mean = 74.6%, S.E.M. = 10.5), compared with lovastatin (mean = 28.1%, S.E.M. = 7.5) and atorvastatin (mean = 19.0%, S.E.M. = 3.4). The interaction effect was significant also, F(2, 12) = 8.5, P < 0.05, where fluvastatin on Gγ9 (mean = 92.0%, S.E.M. = 1.0) and fluvastatin on Gγ3 (mean = 49.0%, S.E.M. = 1.0) showed the greatest effect, whereas atorvastatin on Gγ3 (mean = 17.0%, S.E.M. = 3.7) and lovastatin on Gγ3 (mean = 11.0%, S.E.M. = 1.0) exhibit the lowest effect. Collectively, this analysis shows that Gγ9 and Gγ3 responded to drug treatments differently. Also, at the same confidence level, three drugs influenced each Gγ type differentially. Although the difference between influences of lovastatin and atorvastatin on each Gγ type was not significant, they both differed from fluvastatin (i.e., the presumed Gγ prenylation inhibition potential of both atorvastatin and lovastatin was significantly lower than that of fluvastatin).

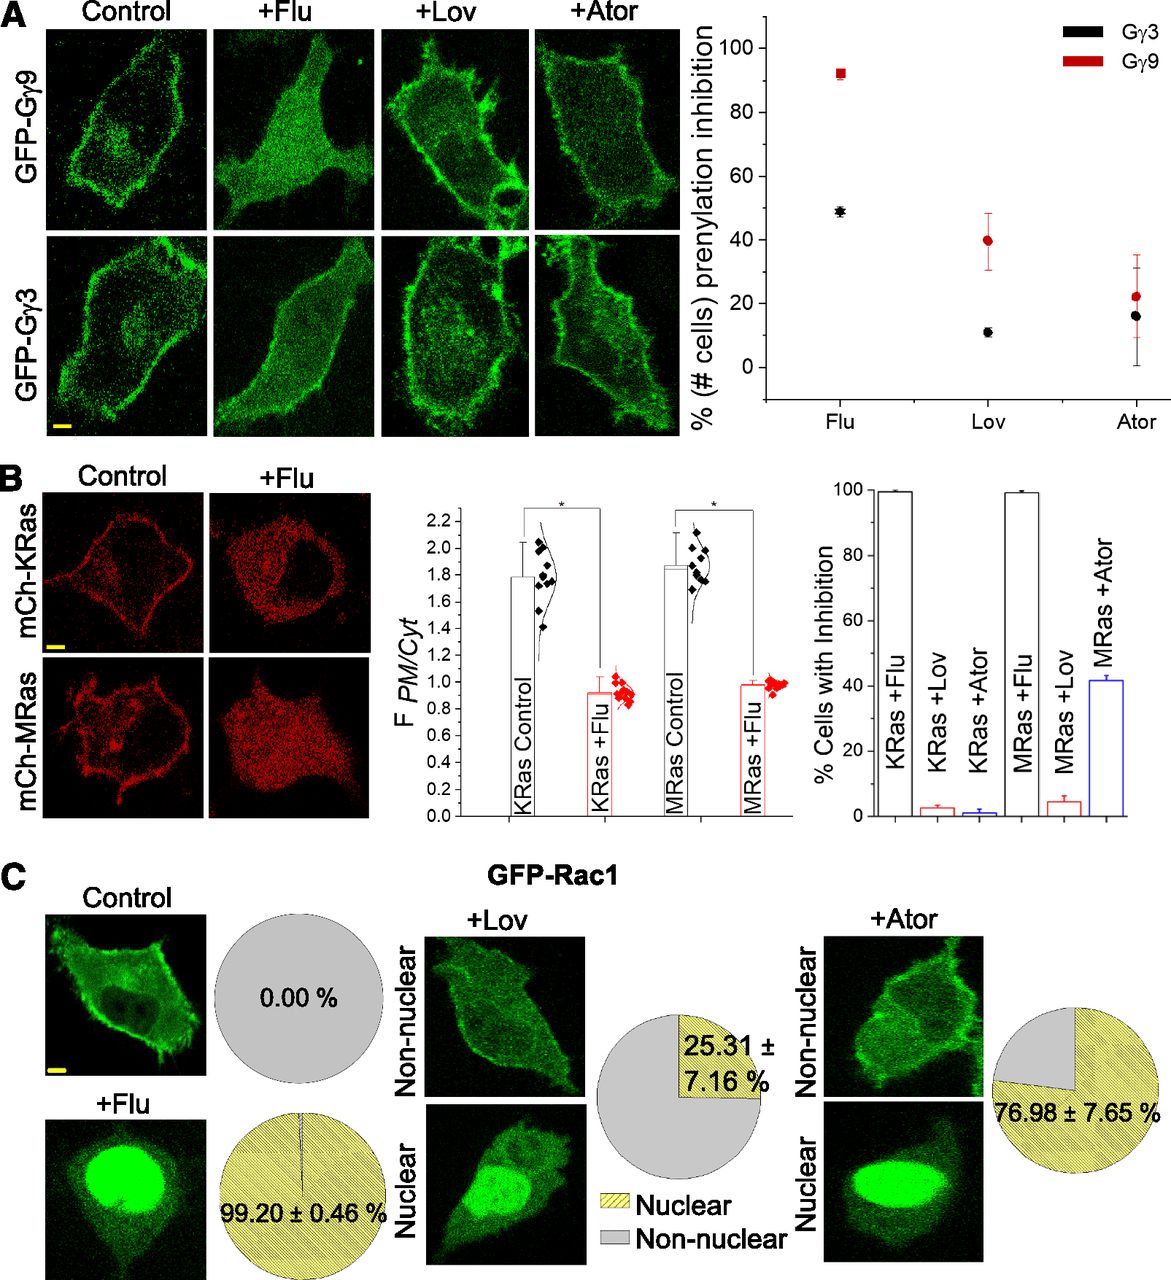
Different statins show distinct inhibitions of the PM localization of the same G protein. (A) Compared with Fluvastatin-treated cells, HeLa cells expressing GFP-Gγ9 and GFP-Gγ3 treated with either lovastatin or atorvastatin only exhibited a minor inhibition of the Gγ-PM localization. The plot shows the percentage of cells that showed at least partial membrane localization inhibition in the GFP-Gγ–expressing cell populations. Symbols ■, ٭ and • on the plot indicate complete, moderate, and minor inhibitions respectively (10 < n < 30 cells). A two-way ANOVA shows that Gγ3 and Gγ9 significantly differ, F (1,12) = 41.2, P < 0.05, such that the average inhibition was significantly higher for Gγ9 (M = 51.2%, S.E.M. = 10.8) than for Gγ3 (M = 22.8%, S.E.M. = 5.4). The inhibitory effect on Gγ membrane interactions of drugs were also significant, F (2, 12) = 63.2, P > 0.05 such that +flu effect was significantly higher (M = 74.6%, S.E.M. = 10.5), compared with Ator (M = 28.1%, S.E.M. = 7.5) and lovastatin (M = 19.0%, S.E.M. = 3.4). (B) HeLa cells expressing mCh-KRas and mCh-MRas pretreated with either DMSO (control) or fluvastatin. Compared with control cells, both KRas and MRas in +flu cells showed a complete cytosolic fluorescence distribution, indicating the near-complete inhibition of their farnesylation. Bar graph (middle) with FPM/Cytosol indicates significant differences in inhibitions between control and +flu cells in both KRas and MRas cells. Bar graph (right) with percentage of the number of cells with PM localization. +Flu shows effective inhibitions of both Ras members; atorvastatin shows ∼40% inhibition of MRas and near-zero inhibition of KRas. + Lovastatin exhibited minor inhibition of both Ras members (scale bar, 5 μm, error bars: S.E.M., n = 17 cells, P < 0.05). (C) HeLa cells expressing GFP-Rac1 showed a clear PM localization; +flu cells showed GFP fluorescence primarily in the nucleus. +Lov and +Ator treatments induced bi-phasic responses, i.e., only a fraction of cell population exhibited complete nuclear localization of Rac1 (scale bar, 5 μm, error bars: S.E.M., n ≥ 15 cells, P < 0.05).
We also examined whether these statins also attenuate α2-AR activation-induced GFP-Gγ3 or Gγ9 translocation from the PM to IMs (Supplemental Fig. 1E). One-way ANOVA showed that the inhibitory effects of statins on Gγ9 translocations were significant, F (3, 65) = 30.53, P < 0.05. The inhibitory effects of +flu and +lovastatin were significant, where (mean = 1.01, S.E.M. = 0.06) and (mean = 1.04, S.E.M. = 0.21), respectively, whereas the effect of +Ator was not significant (mean = 1.40, S.E.M. = 0.21). A one-way ANOVA with F (3, 86) = 9.74, P < 0.05 for the inhibitory effects of statins on Gγ3 translocation was significant. +Flu on Gγ3 translocation (mean = 1.16, S.E.M. = 0.11) and +Ator (mean = 1.22, S.E.M. = 0.12) were significant, whereas the effect of +lovastatin (mean = 1.36, S.E.M. = 0.24) was not significant. These data collectively suggest that different statins possess distinct abilities to attenuate prenylation of Gγ and thereby the extent of Gβγ translocation.
Next, we examined the ability of fluvastatin, lovastatin, and atorvastatin to attenuate prenylation of Ras superfamily members. Most of the Ras superfamily proteins are prenylated and interact with lipid membranes where they regulate designated biologic functions, such as cell proliferation and differentiation (Wang and Casey, 2016). The actions of the Ras superfamily proteins are tightly regulated, and their aberrant behaviors are found in many cancers (Fernández-Medarde and Santos, 2011). Together with chemotherapeutic agents, statins are prescribed to accelerate tumor cell apoptosis since they diminish the HMG-CoA pathway metabolites, FPP and GGPP, which are required for Ras protein prenylation (Hindler et al., 2006; Yu et al., 2018). HeLa cells incubated with fluvastatin exhibited a near-complete cytosolic distribution of mCh-KRas, as well as mCh-MRas, respectively, indicating their lack of prenyl anchors (Fig. 4B). This inhibition was quantified using the method in Fig. 1B. Control cells incubated with vehicle solvent exhibited primarily PM-bound KRas and MRas. At P = 0.05, mean FPM/Cytosol ratios of control and +flu are different where FPM/Cytosol (control) >> 1 ≥ FPM/Cytosol (+flu). These results were not surprising since both KRas and MRas are considered farnesylated (Berndt et al., 2011). Interestingly, HeLa cells exposed to lovastatin and atorvastatin exhibited primarily a PM distribution of KRas and MRas (Fig. 4B, bar graph right). Compared with the near-complete inhibition of PM interaction exhibited by fluvastatin, atorvastatin showed ∼40% inhibition of MRas and near-zero inhibition of KRas, whereas lovastatin exhibited minor inhibition of both Ras members. Collectively, these data suggest that fluvastatin, lovastatin, and atorvastatin exhibit distinct prenylation inhibitions of the same Ras protein.
Additionally, prenylation inhibition of small G-protein Rac1 by fluvastatin, lovastatin, and atorvastatin was examined in HeLa cells expressing GFP-Rac1. Rac1, being a member of Rho-GTPases, plays a major role in cell migration by contributing to lamellipodia formation (Cotton and Claing, 2009). Whereas the control cells treated with DMSO showed a clear Rac1 distribution on the PM (Fig. 4C, top right image and pie chart), fluvastatin-treated cells exhibited a nuclear localization (Fig. 4C, bottom left image and pie chart). The extent of inhibition of PM localization of Rac1 by lovastatin and atorvastatin was significantly lower than that by fluvastatin. A one-way ANOVA shows that three statins inhibit Rac1 localization at the PM to significantly different extents, F (2, 6) = 117.5, P < 0.01. Fluvastatin-treated cells showed the highest mean inhibition of 99.2% (S.D. = 0.5), whereas lower inhibitions were exhibited by lovastatin (77.0% ± 7.7%) and atorvastatin (25.0% ± 7.2%). Additionally, confirming that nuclear-localized Rac1 is unprenylated, cells incubated with lonafarnib (10 μM), a farnesyl transferase inhibitor, also exhibited nuclear localized Rac1-GFP (Supplemental Fig. 2A). Moreover, Gγ9 in lonafarnib-treated cells were cytosolic as well.
Ramifications of Gβγ Signaling in Statin-Treated Cells
Most Gβγ effectors are PM bound or interact with the PM during activation. The goal was to examine whether fluvastatin disrupts Gβγ effector signaling significantly. We also examined whether the signaling of Gβγ composed of specific Gγ types is more susceptible to be perturbed by fluvastatin.
Gβγ Induced Phospholipase C β (PLCβ) Activation and Subsequent Calcium Mobilization.
Compared with GαqGTP, Gβγ activates PLCβ to a lesser extent; however, it induces phosphatidylinositol 4, 5-bisphosphate hydrolysis, generating diacylglycerol and inositol 1, 4, 5-triphosphate (IP3) (Park et al., 1993). We previously demonstrated that, upon activation, Gi-coupled α2-AR using norepinephrine activates PLCβ and induces calcium mobilization (Gupta et al., 2017). Since our data show that statins reduce the concentration of PM-interacting Gβγ at near-complete to partial levels, we examined the effect of statins on Gβγ-governed calcium mobilization response. RAW 264.7 cells incubated with either 10 μM fluvastatin, 20 μM atorvastatin, or 10 μM lovastatin for 12 hours were pretreated with the small- molecule calcium indicator fluo-4 AM (2.28 μM). Calcium imaging was performed as described previously (Siripurapu et al., 2017). After baseline, fluo-4 fluorescence was captured, endogenous c5a receptors were activated with 20 μM c5a, and fluo4 imaging was continued. One-way ANOVA that yielded F (3, 36) = 157.3, P < 0.05 showed that, compared with the control cells in which 55.3% (S.D. = 5.7) cells showed c5A receptor activation-induced calcium responses, fluvastatin treated cells showed a significant inhibition of the response with a mean difference of 40.2% (S.E.M. = 2.0) cells (Fig. 5A, images and bar graph). Not only the percentage of the number of cells with calcium increase (15.1% ± 5.3%) was reduced in fluvastatin-treated cells, but the relative response magnitude was also reduced (Fig. 5A, plot). Lovastatin showed a minor inhibition of calcium response, whereas inhibition by atorvastatin was insignificant.

Fluvastatin perturbs Gβγ signaling in RAW 264.7 macrophages. (A) Upon activation of endogenous c5a receptor with 20 μM c5a, 55% of control (DMSO-treated) RAW 264.7 cells exhibited increase in fluo-4 fluorescence (green), indicating cellular calcium increase. By contrast, only ∼11% of 10 μM Fluvastatin-treated cells showed weaker calcium responses. The plot compares representative calcium responses by a control and +flu cell. Bar graph shows that, compared with control cells, +flu, +ator-, and +lov-treated cells exhibited varying levels of calcium-response inhibitions; however, the +ator cells were not significantly different from the responses of control cells (scale bar, 10 μm, number of fields ≥6, n < 30 cells in each field, error bars: S.D., P < 0.05). (B) RAW 264.7 cells expressing blue opsin-mTurquoise (Gi-coupled GPCR), Akt-PH-mCh (PIP3 sensor), and either GFP-GPI or GFP-Gγ3 preincubated with 50 μM 11-cis-retinal. Both WT control and GFP-Gγ3 cells showed PIP3 generation, indicated by the translocation of cytosolic Akt-PH-mCh to the PM (yellow arrow). Fluvastatin exhibited the highest inhibition in both WT control and GFP-Gγ3–expressing cells. Plots and a two-way ANOVA showed that the PIP3 production inhibitions by all three drugs are statistically significant (scale bar, 5 μm, error bars: S.E.M., n ≥ 15 cells, P < 0.05).
Gβγ Mediated Activation of Phosphatidylinositol-4, 5-Bisphosphate 3-Kinase, Subsequent PIP3 Generation, and Cell Migration.
Subsequently, we examined whether presumptive partial prenylation inhibition of geranylgeranylated Gγ types in RAW 264.7 cells by statins is translated into a reduction in signaling. We have demonstrated that farnesylated Gγ types, including Gγ9, attenuate Gβγ-effectors PLCβ and phosphatidylinositol-4, 5-bisphosphate 3-kinase (PI3K) activations, whereas geranylgeranylated Gγ types enhance their signaling (Senarath et al., 2018). We also showed that endogenously expressed Gγ3 in RAW cells are required for Gi pathway activation–mediated PIP3 production and PLCβ activation during cell migration (Siripurapu et al., 2017; Senarath et al., 2018). In migratory cells, lamellipodia formation at the leading edge is driven by PIP3, produced as a result of Gβγ-mediated PI3K activation (Kölsch et al., 2008). To interact with Gβγ, the p110 subunit of PI3K translocates from the cytosol to the PM and subsequently catalyzes PIP3 production (Braselmann et al., 1997; Brock et al., 2003). We used the translocation of fluorescently tagged PIP3 sensor (Akt-PH-mCh) from cytosol to the PM to measure PIP3 production. RAW 264.7 cells were transfected with blue opsin-mTurquoise (a Gi-coupled GPCR), Akt-PH-mCh, and either GFP-GPI (WT) or GFP-Gγ3. Cells were exposed to either fluvastatin (2 μM), lovastatin (2 μM), or atorvastatin (20 μM) for 12 hours after transfection. Both WT-control and Gγ3-control RAW264.7 cells were treated with DMSO. Cells were supplemented with 11-cis-retinal (50 μM) to generate light-sensing blue opsin and imaging of GFP using the 488-nm light activated opsin. Plots (Fig. 5B) and two-way ANOVA showed that PIP3 responses observed in WT or Gγ3 cells upon blue opsin activation were not significantly different [F(1, 57) = −0.026, P = 1]. Also, selected drugs to inhibit PIP3 production in WT or Gγ3 cells were not significantly different [F(4, 57) = 0.754, P = 0.56]; however, all three drugs exhibited significant differences in their PIP3 response both in WT and Gγ3 cells [F(4, 57) = 5.40 P < 0.01] such that, compared with WT-control and Gγ3-control cells, fluvastatin-treated cells showed, respectively, ∼73% and ∼82% reductions in PIP3 production. Similarly, lovastatin showed 38% and 58% and atorvastatin exhibited 13% and 79% reductions in WT and Gγ3-control cells, respectively.
We next determined whether the observed reduction of PIP3 generation in fluvastatin-treated RAW 264.7 cells also impairs optically directed migration through localized activation of blue opsin to activate the Gi pathway. Blue opsin in localized regions of RAW 264.7 cells (Fig. 6A, blue box) pre-reconstituted with 11-cis-retinal was activated using blue light, and cells exhibited directional migration towards the optical stimuli. Compared with the migration of the leading edge of control cells (6.8 μM ± 0.8), which also exhibited a robust lamellipodia formation and PIP3 production (Fig. 6A, yellow arrow), cells exposed to 10 μM fluvastatin exhibited significantly reduced (P < 0.05) migration (2.2 μM ± 0.2, (Fig. 6A, bar graph). Fluvastatin- treated cells showed a significantly attenuated PIP3 generation, ascertaining the data obtained for PIP3 generation after global activation of opsins (Fig. 5B, yellow arrow). Trailing-edge migration of fluvastatin-treated cells also exhibited a significantly reduced (P < 0.05) migration compared with control cells.

Fluvastatin attenuates Gi-pathway–governed cell migration and invasion and reduces Akt phosphorylation. (A) A RAW 264.7 cell-expressing blue opsin-mTurquoise and Akt-PH-mCh and incubated with 50 μM 11-cis-retinal exhibited a directional migration toward the optical stimuli upon localized optical activation of blue opsin (blue box). This migration is accompanied with lamellipodia and clear generation of PIP3 at the leading edge. In contrast, cells treated with 10 μM fluvastatin exhibited a significant reduction (P < 0.05) in cell migration, lamellipodia formation, and PIP3 generation (error bars: S.D., n > 10 cells, P < 0.05). (B) Bar graph shows invasion of RAW 264.7 cells in the transwell invasion assay, induced by endogenous c5a receptor activation using 12.5 μM c5a. Compared with control (DMSO) cells, fluvastatin, RhoA inhibitors (EHop-016, EHT1864, and GSK269962), and PI3K inhibitor (wortmannin)-treated cells exhibited significant reductions in cell invasion (n = 2). Compared with wortmannin-treated cells, Fluvastatin-treated cells exhibited ∼50% more inhibition, indicating that inhibition through fluvastatin can be due to prenylation inhibition of both Gγ as well as Ras family proteins (error bars: S.D., n < 3 independent experiments, P < 0.05). (C) Examination of Akt phosphorylation in cells exposed to fluvastatin using Western blot analysis. Images and bar graph show ∼40% less Akt phosphorylation in +flu cells, compared with control cells. Protein expressions were normalized to both total Akt and β-Actin. (error bars: S.D., n = three independent experiments, P < 0.05).
Cell migration and invasion play a critical role in cancer cell progression and subsequent cancer metastasis (Kirui et al., 2010). The role of Gβγ signaling in cell migration and invasion is thoroughly investigated and well documented (Kirui et al., 2010; Tang et al., 2011; Kim et al., 2012; Vázquez-Prado et al., 2016). In addition to PI3K, Gβγ signaling contributes to full activation of PIP3-dependent Rac exchanger 1 (P-Rex1) and thus to Rac1-mediated cell mobility (Dbouk et al., 2012; Kim et al., 2012). Blockade of Gβγ is found to diminish cancer metastasis (Tang et al., 2011). Therefore, the ability of fluvastatin to perturb cell invasion was tested by using transwell invasion assay for control, as well as fluvastatin (2 μM), Rho-A inhibitors (EHop-016, 5 μ; EHT1864, 10 μM; GSK269962, 12.5 μM) or wortmannin (50 nM)-treated cells for 24 hours. Compared with the number of cells invaded in controls, one-way ANOVA with F (3, 9) = 24, P < 0.01 showed that all three treatments significantly inhibited the number of cells invaded (Fig. 6B). Fluvastatin, RhoA inhibitors, and wortmannin exhibited, respectively ∼11-fold, 75-fold, and 6-fold reductions in their invasion. The higher reduction in cell invasion by fluvastatin compared with wortmannin can be attributed to the ability of fluvastatin to attenuate PM localization of both Gβγ and Rho GTPases such as Rac1, which facilitate cell migration.
Fluvastatin Exposure Attenuates Downstream Signaling of Gβγ.
The Akt/PKB pathway is one of the major signaling networks activated by Gβγ. Gβγ-induced phosphorylation of the PI3K and subsequent PIP3 generation recruits Akt to the PM. Activated Akt triggers numerous downstream responses, including cell survival, proliferation, growth, and cell migration (Hemmings and Restuccia, 2015). Since our data show that fluvastatin treatment diminishes Gβγ-mediated PI3K/PIP3 signaling and Akt links Gβγ with cell migration and invasion, Western blot analysis was used to examine the effect of fluvastatin on Akt phosphorylation. Raw264.7 cells were incubated either with 2 μM fluvatatin or DMSO for 24 hours. Cells were lysed and extracted proteins were separated using SDS-PAGE. Western blot analysis was performed using standard protocols, and total Akt, phospho-Akt, and actin were detected using specific primary and secondary antibodies. The phospho-Akt level was normalized to expression levels of both total-Akt and β-actin. The data revealed a 2-fold reduction in Akt phosphorylation compared with the DMSO-treated control cells (Fig. 6C; Supplemental Fig. 2B). These data further confirm the ability of fluvastatin to inhibit Gβγ signaling and Gβγ-mediated downstream cellular events.
Fluvastatin Suppresses Internalization of Activated β1-Adrenergic Receptors
Desensitization of activated GPCRs protects cells from excessive signaling and is achieved by receptor internalization (van Koppen and Jakobs, 2004). G-protein receptor kinases (GRKs) help physical removal of activated GPCR from the PM by phosphorylating the serine and tyrosine residues in the third cytosolic loop and the CT of the receptor (van Koppen and Jakobs, 2004; Evron et al., 2012). GRK2 (β-adrenergic receptor kinase 2) phosphorylates agonist-activated β-adrenergic receptors (β1-AR), promoting GPCR-βarrestin interactions and subsequent desensitization (Lefkowitz, 1998). GRK2 activity requires binding of Gβγ (Haga and Haga, 1990; Pitcher et al., 1992). Disruption of Gβγ binding domain of GRK2 eliminates this activation-dependent receptor phosphorylation (Carman et al., 2000). Recently, nanobody-80 (Nb80), a conformation-specific single domain antibody for activated β1-AR was used to monitor active-state β1-AR. Upon activation of β1-AR with its agonist, it has been shown that cytosolic Nb80-GFP translocates to the PM and binds to the agonist-bound activated β1-AR. When GRK2 induces internalization of activated β1-AR, bound Nb80 also internalizes, and this is indicated by the accumulation of Nb80-GFP fluorescence in IMs (Irannejad et al., 2017) (Fig. 7A, cartoon). Since Gβγ plays a key role in GRK2-mediated receptor internalization, we examined the internalization of activated β1-AR by monitoring subcellular location of Nb80-GFP in the presence and absence (control) of fluvastatin. To confirm Gβγ involvement, additional experiments were performed in the presence of gallein (Gβγ inhibitor) (Casey et al., 2010) and in cells expressing venus-GRK3ct (to sequester Gβγ) (Hollins et al., 2009). HeLa cells expressing β1-AR-CFP and Nb80-GFP were preincubated with 5 μM fluvastatin or DMSO for 12 hours. Using 20 μM isoproterenol, β1-AR was activated and the Nb80-GFP recruitment to IMs monitored (Fig. 7A, images and plot). One-way ANOVA showed that, compared with control cells with the mean normalized IM fluorescence of 2.061 ± 0.003, fluvastatin showed a significantly lower Nb80 recruitment to IMs (1.523 ± 0.002, ∼50%) at P < 0.05. Even more significant reductions (∼80%) were observed in gallein-treated cells (1.159 ± 0.06) and in GRK3ct-expressing cells (1.216 ± 0.002) compared with control cells. Since the extent of Nb80-recruitment inhibition by fluvastatin is between that of the control and gallein-treated as well as GRK3ct cells, fluvastatin-mediated Gβγ inhibition in Raw 264.7 cells appears to be partial.
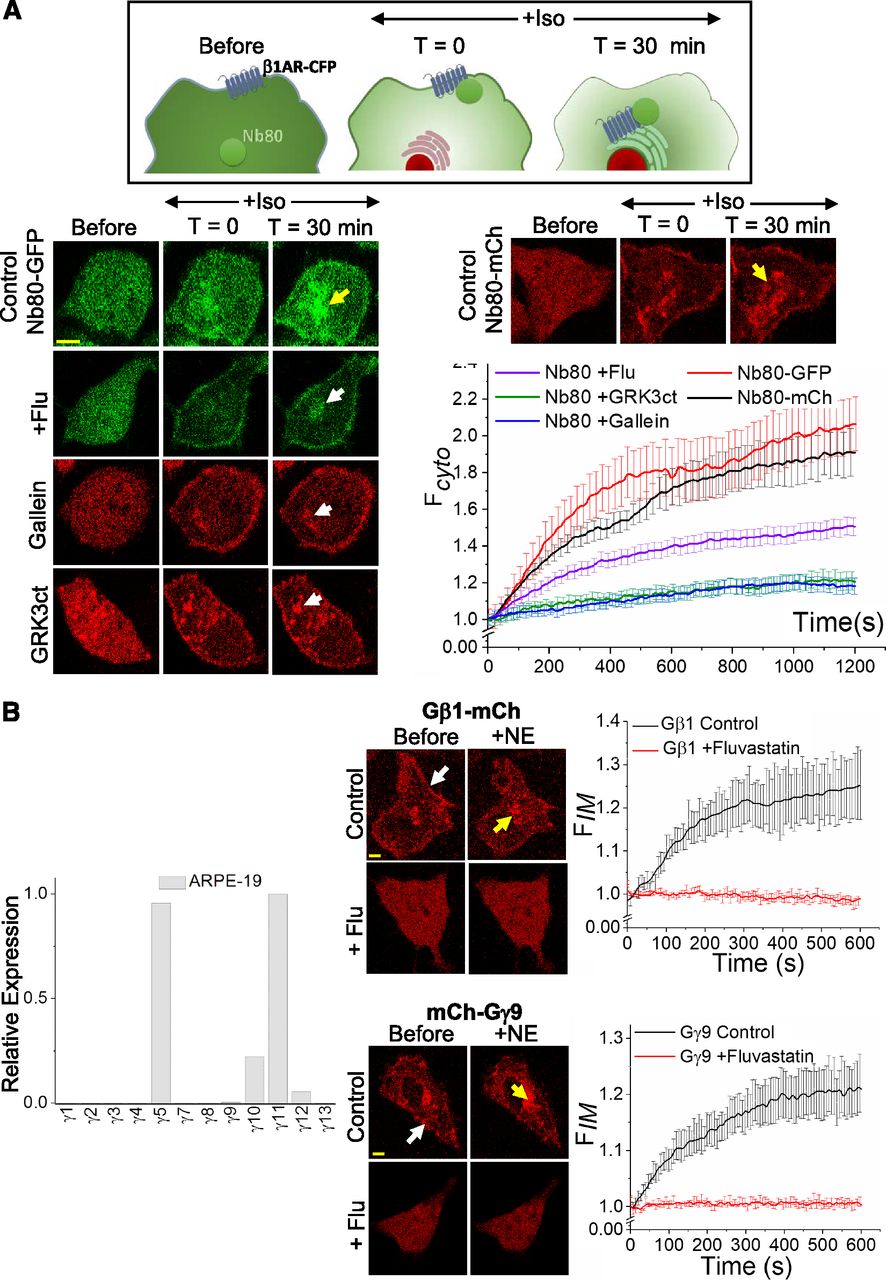
Fluvastatin (A) attenuates internalization of activated ß1-adrenergic receptors in HeLa cells and (B) impairs Gβγ-mediated signaling in ARPE-19 cells. (A) The schematic representation of Nb80 translocation to activated β1-AR and its subsequent internalization with the receptor. Images show the Nb80-GFP movement in HeLa cells expressing β1-AR-CFP upon receptor activation. After activation of β1-AR with 20 μM isoproterenol, control cells showed a robust recruitment of Nb80 (both GFP and mCh tagged) to the IMs with the internalized and active β1-AR (top image panel, yellow arrows). A comparatively reduced Nb80 recruitment was observed in +flu cells (second panel right, white arrow). The plot shows ∼50% reduced mean GFP fluorescence of Nb80 in the IMs in Fluvastatin-treated cells, indicating attenuated β1-AR desensitization (n = 20 cells from four independent experiments). Both 10 μM gallein (Gβγ inhibitor)-treated cells (third panel right, white arrow) and membrane-targeted venus-GRK3ct (mask Gβγ) expressing cells showed ∼80% lower Nb80 accumulation in IMs (white arrows), indicating the involvement of Gβγ in the pathway. Both Nb80-GFP and -mCh versions exhibited similar internalization in control cells (red and black curves respectively). (B) Real-time PCR quantification of relative expression levels of the 12 Gγ subtypes in ARPE-19 cells. Farnesylated Gγ11 showed the highest expression. Images show ARPE-19 cells expressing blue opsin-mTurquoise with either Gβ1-mCh or mCh-Gγ9 and incubated with 50 μM 11-cis-retinal. Gβ1 and Gγ9 in control cells were found primarily on the PM (white arrows), and upon blue opsin activation, both proteins exhibited robust translocations from the PMs to IMs (yellow arrows). Likely because of prenylation inhibition, both Gβ1 and Gγ9 distribution in +flu cells were completely cytosolic, and their translocations upon blue opsin activation were not detected. Collectively, these data indicate the lack of prenylation of endogenous Gγ types as well as transfected Gγ9 upon fluvastatin treatment. (Scale bar, 5 μm, error bars: S.E.M., n = 16 cells, P < 0.05).
Fluvastatin Significantly Impairs Heterotrimer Activation and Gβγ Translocation from the PM to IMs in Retinal Pigment Epithelial Cells
Use of statins is associated with ocular diseases, including vision impairment, blurred vision, and cataract development (Machan et al., 2012; Mizranita and Pratisto, 2015). Visual transduction requires the activation of G-protein heterotrimers by light-activated opsins, and cells in the retina primarily use farnesylated Gγ types (Gγ1 and Gγ9) in heterotrimers. Since statins greatly perturb the PM localization of the farnesylated Gγ types, we examined whether statins reduce Gβγ translocation (which is considered a measure of heterotrimer activation) (Senarath et al., 2016) in adult retinal pigment epithelial-19 (ARPE-19) cells. Gγ-subtype expression profile of ARPE-19 cells was determined using quantitative real-time PCR (qRT-PCR). Data have shown that the major Gγ subtypes endogenously expressed in ARPE19 cells are Gγ11 and Gγ5 (Fig. 7B, bar graph). Since Gγ11 is farnesylated and possesses a low PM affinity (Ajith Karunarathne et al., 2012), we examined GPCR activation–induced translocation of Gβγ in fluvastatin-exposed ARPE-19. ARPE19 cells were transfected with Gβ1-mCh and α2AR-CFP while being exposed to 2 μM fluvastatin. Control cells treated with DMSO exhibited a prominent distribution of Gβ1-mCh on the PM and IMs, whereas Gβ1 distribution was completely cytosolic in cells exposed to 2 μM fluvastatin (Fig. 7B, top panel). Similarly, inhibition of membrane distribution of Gγ9 was also examined by transfecting ARPE19 cells with mCh-Gγ9. Like Gβ1, Gγ9 also exhibited a complete cytosolic distribution in cells exposed to Fluvastatin, whereas control cells showed a membrane distribution (Fig. 7B, bottom panel). Next, the effect of fluvastatin on heterotrimer activation in ARPE19 cells was investigated by monitoring mCh-Gγ9, as well as Gβ1-mCh translocation from the PM to IMs after activating the transfectedα2AR. Analogous to the observations in HeLa cells, both Gβ1 and Gγ9 exhibited a robust translocation from PM to the IM in control cells, whereas Fluvastatin-treated ARPE-19 cells failed to exhibit detectable translocations of either Gβ1 or Gγ9 (Fig. 7B, plots).
Discussion
Statins are globally used as effective lipid-lowering medications, primarily to reduce the risk of cardiovascular diseases and associated mortality; however, several side effects, such as myopathy, ocular adverse effects (including blurred vision and visual impairment), cognitive effects (such as short-term memory loss), abnormal liver function, glucose intolerance, and increased risk for diabetes are reported in patients treated with statins (Golomb and Evans, 2008; Mizranita and Pratisto, 2015; Davies et al., 2016). Being a competitive inhibitor of the enzyme, HMG-CoA reductase, a crucial enzyme of the mevalonate (or cholesterol synthesis) pathway, statins effectively reduce not only the production of cholesterol but also other lipids, including isoprenoids (Miziorko, 2011). Isoprenoids are precursors for the synthesis of prenyl pyrophosphates, which are required for the prenylation of a large cohort of G proteins. The present study draws a clear link between the use of statins and the perturbation of GPCR and heterotrimeric G-protein signaling, providing potential explanations for some of the side effects related to statin use (Golomb and Evans, 2008).
Membrane anchorage is a crucial factor for the functioning of Ras superfamily and heterotrimeric G proteins. Being able to modulate and prevent the activity of Ras superfamily G proteins, statins exert several pleiotropic side effects, such as reduction of cell proliferation, that consequently has expanded its usage as a chemotherapeutic agent for cancers (Liao and Laufs, 2005). The data presented in this study show that statins perturb the PM localization of Gγ, and thereby Gβγ in a Gγ subtype–dependent manner, as a result of the reduction of prenyl anchors required for Gγ prenylation (Wedegaertner et al., 1995; Hildebrandt, 2011). Data show that Gγ types that are being prenylated with geranylgeranyl anchors are only partially susceptible to statin-mediated likely inhibition of prenylation. This differential inhibition is also characterized by near-complete inhibition of PM localization of farnesylated Gγ, attenuating activation of heterotrimers with farnesylated Gγ. The effectiveness of statins to inhibit farnesylation is also evident from the near-complete inhibition of primarily farnesylation-sensitive Ras family proteins, such as KRas, NRas, and HRas.
It has been suggested that the CT sequence that determines the type of prenylation is not limited to CaaX motif (Senarath et al., 2018). Also suggested was the ability of proteins that usually prefer farnesylation can undergo geranylgeranylation in the presence of farnesyl transferase inhibitors (Whyte et al., 1997). We hypothesized that Gγ types are not completely farnesylated or geranylgeranylated. Although 9 of 12 Gγ types are primarily identified as geranylgeranylated proteins, to a certain degree, they are also farnesylated. It appears that the major anchoring type of a Gγ is recognized as the type of prenylation. Our experimental data showed varying degrees of likely inhibition of Gγ geranylgeranylation upon exposure to statins, supporting this hypothesis. For instance, the extent of the presence of cytosolic Gγ indicates a minor Gγ2, Gγ3, Gγ4, and Gγ5 prenylation inhibition and also suggests that a considerable fraction in Gγ4, as well as Gγ5, are likely to be farnesylated. A larger reduction of NE-induced Gγ3 translocation compared with that of Gβ1 by fluvastatin was observed, although their subcellular distribution data show a relatively a lesser inhibition of Gγ3 prenylation by fluvastatin. We believe this is due to partially cytosolic YFP-Gβ1 interfering with the detection of YFP-Gβ1 translocation. The observed differential effects of statins on farnesylated and geranylgeranylated Gγ, likely indicating distinct prenylation inhibition patterns, can be partly due to the higher incidence of GGPP production. This is in addition to the conversion of FPP to GGPP by GGPP synthase. Examination of cholesterol synthesis pathway indicates that, compared with FPP, a cell can have a relatively higher population of GGPP through the direct conversion of isopentenyl-PP to GGPP. Alternatively, in addition to being used to produce farnesylated proteins, FPP is also consumed to produce other lipids in the mevalonate pathway, including GGPP and cholesterol. Collectively, these differences can explain why Gγ types are differentially susceptible to prenylation inhibition by statins (Fig. 1A). The near-complete inhibition of both Gγ1 and Gγ9 suggests that, in the absence of farnesylation, these Gγ types cannot effectively undergo geranylgeranylation.
Translocation of Gβγ in cells expressing different Gγ subtypes upon activation of GPCR indicates activation G proteins (Ajith Karunarathne et al., 2012). Attenuated translocation has been observed in statin-exposed cells in a Gγ-dependent manner, thus signifying the reduction of heterotrimer activation. Therefore, it is likely that heterotrimeric G-protein signaling is similarly perturbed in patients treated with statins. Gγ types show cell- and tissue-specific subtype distributions (Cali et al., 1992). Our data therefore suggest that G-protein signaling perturbation by statins can differentially influence GPCR-G protein–controlled processes in a tissue- and organ function-specific manner. Extensive inhibition of Gγ farnesylation by statins, which is pronounced after effects in tissues and organs that predominantly use farnesylated Gγ types, can be anticipated. For instance, photoreceptor cells in the retina of the eye express Gγ1 and Gγ9 as the major Gγ (Pearring et al., 2013). This unique Gγ expression can be understood by examining the visual transduction in which GTP-bound Gα-transducin is the major signal transducer, generated by the activated opsin to trigger cGMP signaling. Here, cells appear to use Gβγ with farnesylated Gγ owing to their low PM affinity to prevent unnecessary, as well as potentially deleterious, Gβγ signaling for photoreceptor cells. If statins significantly reduce farnesylation, consequently, transducin-containing heterotrimer formation is reduced as well, hampering cGMP pathway activation. Recovery from the effects on statin discontinuation has also been reported (Leuschen et al., 2013). These observations are consistent with the ability of statin to temporarily inhibit HMG-CoA. Data from ARPE19 cells with primarily farnesylated endogenous Gγ showed significant inhibition of PM localization and GPCR activation–induced Gβγ translocation on exposure to fluvastatin and indicate the likely after-effects of statins on the vision system. Based on these facts and data, we propose that the dominant expression of farnesylated Gγ types in photoreceptor cells is linked to the occurrence of ocular disorders in patients using statins.
Several studies have shown interference of immune responses by statins owing to the attenuated production of downstream metabolites in the HMG-CoA pathway, including FPP and GGPPs. Like Gγ, these lipids are required for PM anchoring of small GTPases, such as RhoA, Rac, and Ras. Our data show an impairment of their PM localization in cells exposed to statins. Our data also show that statins induce perturbation of Gβγ-mediated cell migration and invasion, which are critical steps of immune responses and metastasis. Prolonged exposure to statins including fluvastatin, has been shown to negatively impact cognitive function (Golomb and Evans, 2008; Ramkumar et al., 2016). Of 12 γ subtypes, Gγ2 and Gγ3 are predominant in the brain (Yim et al., 2017); partial inhibition of their membrane localization by fluvastatin and the consequent perturbation of associated signaling can be partially responsible for the development of cognitive effects in patients using statins. Our previous findings show that Gi pathway–governed PIP3 production is Gγ subtype-dependent, and Gγ3 is the foremost Gγ that supports PIP3 production (Senarath et al., 2018). Partially delocalized Gγ3 from the PM to the cytosol upon fluvastatin treatment thus explains the attenuation of downstream signaling of Gβγ, including Akt phosphorylation, cell migration, and invasion.
Cardiac muscle activities are strongly regulated by GPCRs, including β-adrenergic, acetylcholine, and angiotensin receptors; thus, they have become therapeutic targets for cardiovascular diseases (Bathgate-Siryk et al., 2014). Agonist-activated cardiac β-adrenergic receptors undergo desensitization upon phosphorylation. This process is controlled by Gβγ and GRKs, attenuating GPCR signaling (Reiter and Lefkowitz, 2006). Upregulation of GRK isoforms, such as GRK2 and GRK5, markedly cause chronic heart failure owing to reduction of β-adrenergic receptors in cardiac muscles (Lymperopoulos et al., 2012). Patients treated with statins have exhibited substantially lower cardiac problems, including reduced damage from ischemia-reperfusion injury. Excessive β-adrenergic receptor internalization is a leading cause of ischemia-reperfusion injury (Tilley and Rockman, 2006). Gβγ triggers GRK2-induced β-adrenergic receptor phosphorylation, marking it for internalization (Ribas et al., 2007; Cahill et al., 2017), and thus Gβγ signaling is deleterious during a myocardial infarction (Tilley and Rockman, 2006). Our data not only show that statins reduce Gβγ signaling but also exhibit a significant reduction in β-adrenergic receptor desensitization. Our findings therefore suggest added beneficial effects of statins on cardiac function, in addition to their ability to lower cholesterol biosynthesis.
In summary, we show for the first time that statins perturb GPCR-G protein signaling in a Gγ type–dependent manner. Our data conclusively show that fluvastatin strongly inhibits prenylation of farnesylation-sensitive Gγ and also suggests that functions in cells and tissues predominantly expressing these Gγ types are more susceptible to be interfered by statins. Additionally, we show that several crucial Gβγ-controlled cellular processes, including chemokine cell migration and internalization of β-adrenergic receptors, are significantly attenuated by statins. Our findings also indicate that numerous GPCR-G protein-governed cellular functions, whether beneficial or not, are likely to be differentially perturbed by statins and thus require further investigations.
Acknowledgments
We thank Dr. Deborah Chadee for providing experimental support for the Western blot analysis; Dr. N. Gautam, Dr. Roshanak Irannejad, and Dr. Nevin Lambert for G-protein subunits, Nb80 and GRK3ct constructs; the National Eye Institute for providing 11-cis-retinal; Kasun Ratnayake and Diniti Welivita for comments; and the Departments of Chemistry and Biochemistry and Biological Sciences at The University of Toledo for providing access to various instrumentation.
Authorship Contributions
Participated in research design: Tennakoon, Kankanamge, Karunarathne.
Conducted experiments: Tennakoon, Kankanamge, Senarath.
Performed data analysis: Tennakoon, Kankanamge, Senarath, Fasih.
Wrote or contributed to the writing of the manuscript: Tennakoon, Kankanamge, Senarath, Fasih, Karunarathne.
Footnotes
- Received October 6, 2018.
- Accepted January 25, 2019.
This research was supported in part by the University of Toledo and National Institutes of Health National Institute of General Medical Sciences (Grant 1R15GM126455-01A1).
↵
 This article has supplemental material available at molpharm.aspetjournals.org.

Abbreviations
- α2-AR
- α2-adrenergic receptor
- ANOVA
- analysis of variance
- ARPE-19
- adult retinal pigment epithelial-19
- β1-AR
- β1-adrenergic receptor
- CFP
- cyan fluorescent protein
- CT
- C terminus
- DFBS
- dialyzed fetal bovine serum
- DMSO
- dimethylsulfoxide
- FBS
- fetal bovine serum
- FPP
- farnesyl pyrophosphate
- G proteins
- guanine nucleotide-binding proteins
- GGPP
- geranylgeranyl pyrophosphate
- GPCR
- G proteincoupled receptor
- GRK
- G-protein receptor kinase
- Gγ
- G protein γ
- HMG-CoA
- 3-hydroxy-3-methylglutaryl-coenzyme A
- IM
- internal membrane
- IP3
- inositol 1, 4,0 5-triphosphate
- mCh
- m cherry
- MEM
- minimum essential medium
- Nb80
- nanobody-80
- PCR
- polymerase chain reaction
- PI3K
- phosphatidylinositol-4, 5-bisphosphate 3-kinase
- PLC β
- phospholipase C β
- PM
- plasma membrane
- RPMI 1640
- Roswell Park Memorial Institute medium
- YFP
- yellow fluorescent protein
- Copyright © 2019 by The American Society for Pharmacology and Experimental Therapeutics


