


Article Figures & Data
Figures
- Fig. 1.
PMA-induced activation of human TRESK is prevented by the S264A and S264E, but not by the S252A and PQAAAS-AQAP, mutations of the channel. (A) Representative K+ currents were measured in Xenopus oocytes expressing wild-type (upper), PQAAAS-AQAP (middle), or S264A mutant (lower) human TRESK, before (left) and after the application of PMA (100 nM) for 42–46 minutes (right recordings). TRESK current was measured as the difference of inward currents at −100 mV, when EC [K+] was transiently changed from 2–80 mM, as indicated above the upper left curve. This protocol and the scale bars apply to all recordings. (B) Relative activation of TRESK current by PMA was calculated from the same experiment as illustrated in (A). The number of cells is indicated in the columns. (C) Wild-type, S264E, and S252A mutant TRESK were tested in a similar experiment as introduced in (A and B), in a different oocyte preparation. Note that the S264E mutation, similarly to S264A, completely prevented TRESK activation by PMA. *P < 0.01; ***P < 0.0005, Welch’s ANOVA followed by Games-Howell test; ns, not significant; wt, wild type.
- Fig. 2.
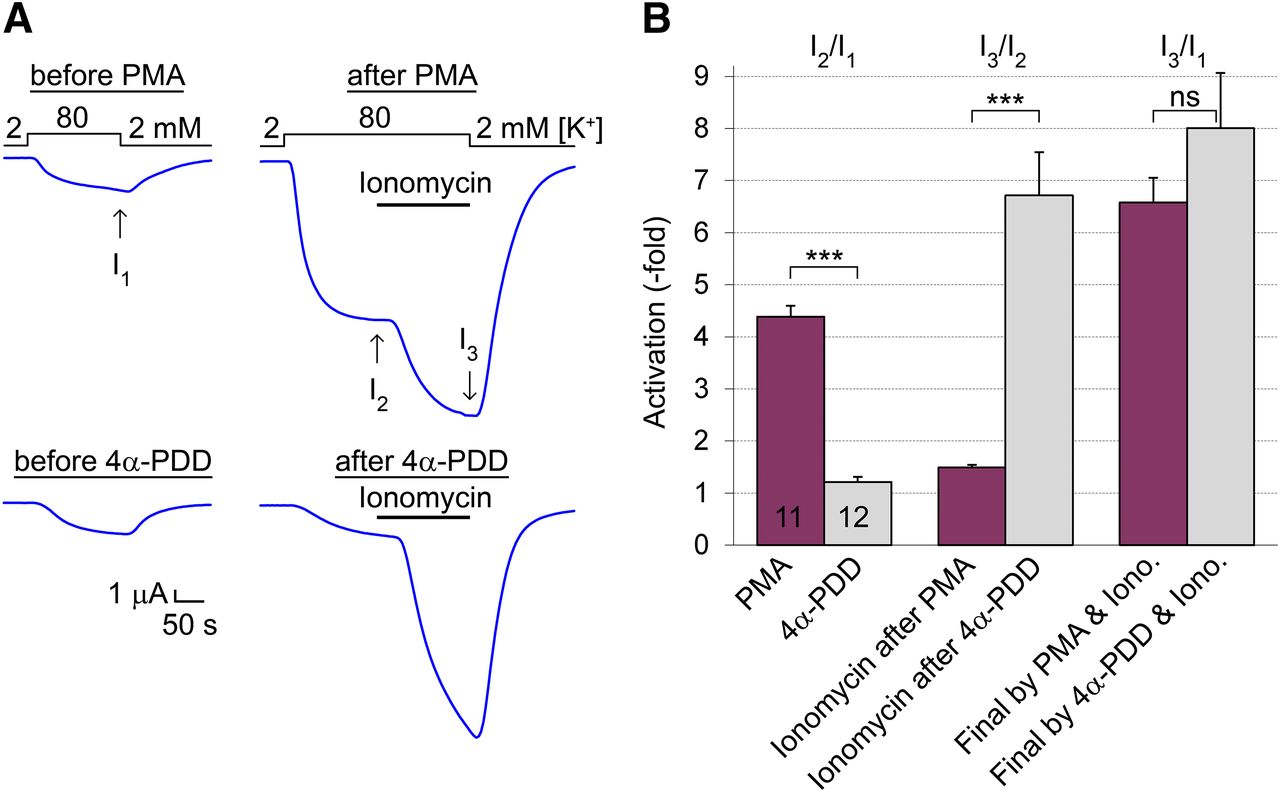
Ionomycin activates TRESK to the same degree after PMA and 4α-PDD treatment. (A) Representative TRESK currents were recorded before (left) and after (right) the application of PMA (100 nM, upper curves) or the inactive analog 4α-PDD (100 nM, lower curves) for 44–48 minutes. At the end of the second measurement, ionomycin (0.5 μM) was administered for 160 seconds in 80 mM [K+] as indicated by the horizontal black bar. The basal TRESK current at the beginning of the experiment, the current after the phorbol treatment, and the final current after the application of ionomycin are indicated as I1, I2, and I3, respectively, by the vertical arrows. The small nonspecific leak current measured in 2 mM [K+] was subtracted from the values of I1, I2, and I3 in the calculations. (B) Relative activations of TRESK current by PMA (purple, left pair of columns, I2/I1) or 4α-PDD (gray) were calculated from the same experiment as illustrated in (A). The subsequent activation by ionomycin was estimated by comparing the currents measured before and after application of the ionophore (i.e., after the PMA or 4α-PDD treatment, middle pair of columns, I3/I2). The final activation was calculated by normalizing the current recorded at the end of ionomycin administration to the basal current at the beginning of the experiment (right pair of columns, I3/I1). Note that TRESK current reached the same (about 7-fold) final level of activation when ionomycin was applied after PMA or 4α-PDD pretreatment. ***P < 0.0005 Mann-Whitney U test, also significant after Bonferroni’s correction; ns, not significant.
- Fig. 3.
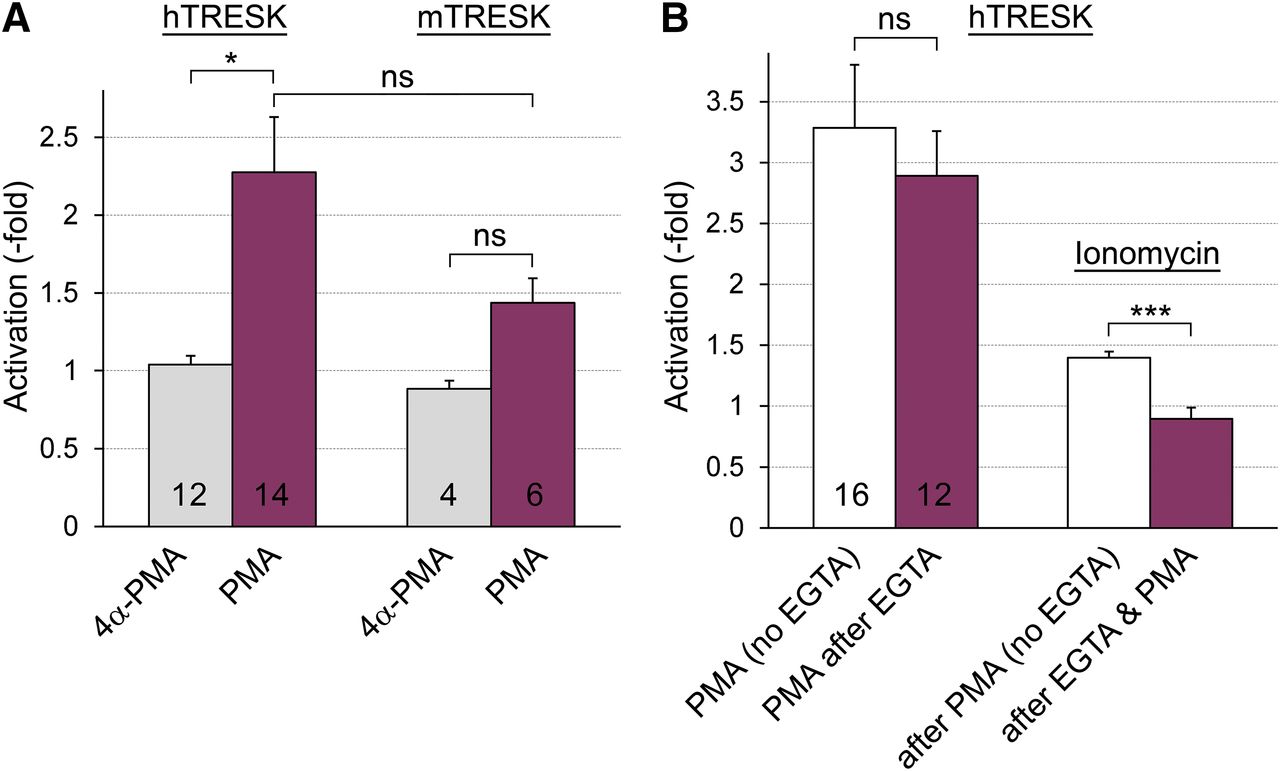
The effect of PMA is weak on mouse TRESK, and it is not affected by EGTA microinjection. (A) The K+ currents of Xenopus oocytes expressing human or mouse TRESK were measured before and after the application of PMA (100 nM, for 49–56 minutes) or the inactive analog 4α-PMA (as indicated below the columns, protocol as in Fig. 1A). The current measured after the phorbol treatment was normalized to the basal value, and the averages were plotted in the graph. (B) The relative activations of human TRESK current by PMA and ionomycin were analyzed by using a protocol similarly to that in Fig. 2A. The cells were (purple, PMA after EGTA group) or were not (white, no EGTA group) microinjected with 50 nl of solution containing 50 mM EGTA plus 50 mM HEPES after the first measurement of K+ current, before the application of PMA (100 nM). Note that the microinjection of EGTA did not influence TRESK activation by PMA (left pair of columns). The cells were finally challenged with ionomycin (0.5 μM), and the relative activations (calculated as I3/I2 in Fig. 2A) are shown as the right pair of columns. Note that EGTA prevented TRESK activation by ionomycin (compare the third white with the fourth purple column). *P < 0.05 Welch’s ANOVA followed by Games-Howell test, ***P < 0.0005 Mann-Whitney U test (also significant after Bonferroni’s correction); ns, not significant.
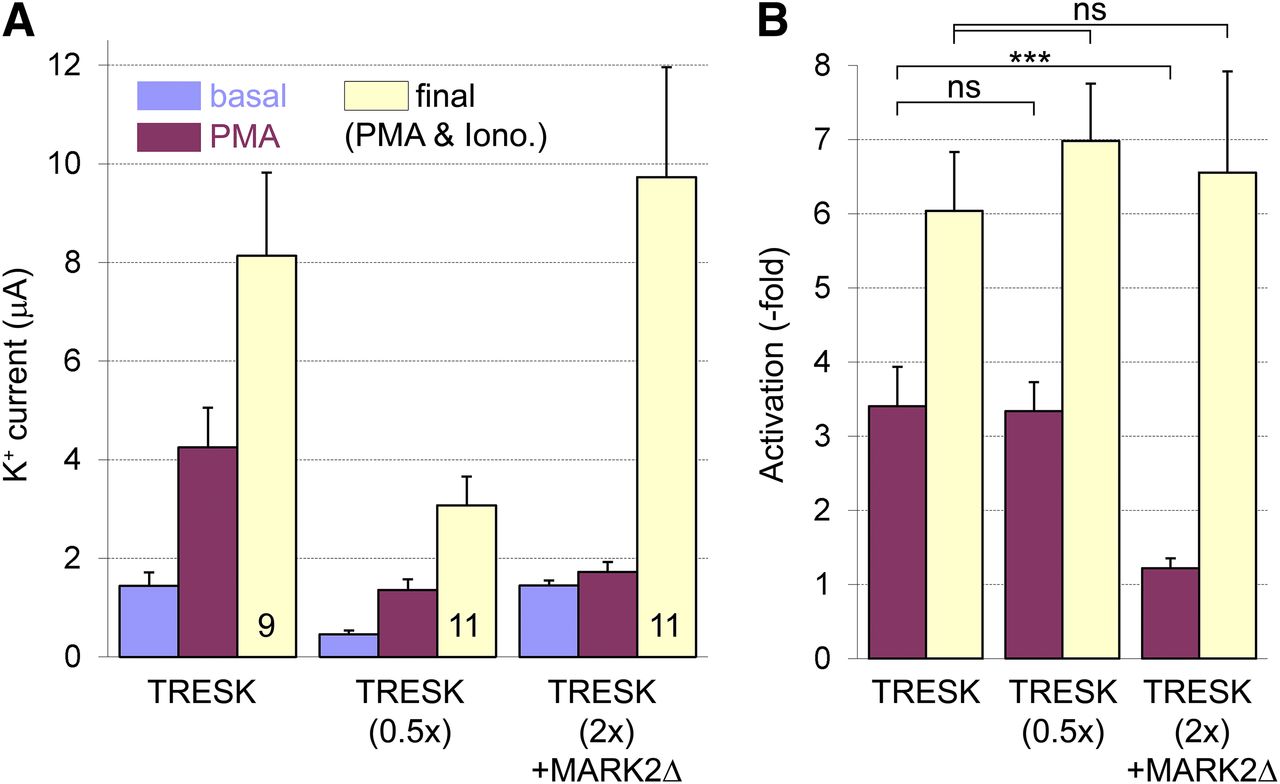
- Fig. 4.
Coexpression of a truncated construct of MARK2 kinase with TRESK prevents activation of the channel by PMA. (A) The average amplitudes of basal TRESK currents, the currents after the application of PMA (100 nM), and the currents after the final administration of ionomycin (light blue, purple, and yellow columns, respectively, as I1, I2, and I3 in Fig. 2A) are represented. Three groups of oocytes expressing human TRESK, injected with half amount of TRESK cRNA, or coexpressing TRESK with MARK2Δ are illustrated (three triads of columns, respectively, as indicated below the triads). (B) Relative activations of TRESK currents by PMA (purple, as I2/I1 in Fig. 2A) and the final activations by ionomycin (0.5 μM) after PMA (yellow, as I3/I1 in Fig. 2A) were calculated for the three groups from the data shown in (A). Note that the activation by PMA was diminished in the presence of MARK2Δ (compare the purple columns); however, the effect of ionomycin was not influenced by the coexpression of the kinase (yellow columns). In this experiment, a double amount of TRESK cRNA was coinjected with MARK2Δ to obtain the same basal K+ current amplitude as in the control (TRESK) group. In a previous similar experiment, when equal amounts of TRESK cRNA were injected, the coexpression of MARK2Δ also prevented the activation of TRESK by PMA, although the basal K+ current was reduced in the cells coexpressing MARK2Δ compared with the control group (not shown). Note that the average K+ current after the application of PMA is in the same range in the TRESK (0.5×) as in the TRESK (2×) + MARK2Δ group, verifying that the degree of TRESK activation by PMA was independent of the current amplitudes in this experiment. ***P < 0.001, MANOVA followed by Tukey HSD test; ns, not significant.
- Fig. 5.
PMA slows the return of TRESK current to the resting state after the activation by ionomycin. Three groups of oocytes expressing human TRESK were stimulated with ionomycin (0.5 μM), ionomycin (0.5 μM) plus PMA (100 nM), or PMA alone as indicated by the red bar (purple, orange and light blue curves, respectively, n = 5 in each group; S.E. is shown as gray error bars). The currents were measured at the end of 300-millisecond voltage steps to −100 mV applied every 4 seconds in 2 or 80 mM [K+], as indicated above the graph. Note that the application of PMA in addition to ionomycin prevented the recovery of TRESK current toward the resting state (orange curve).
- Fig. 6.
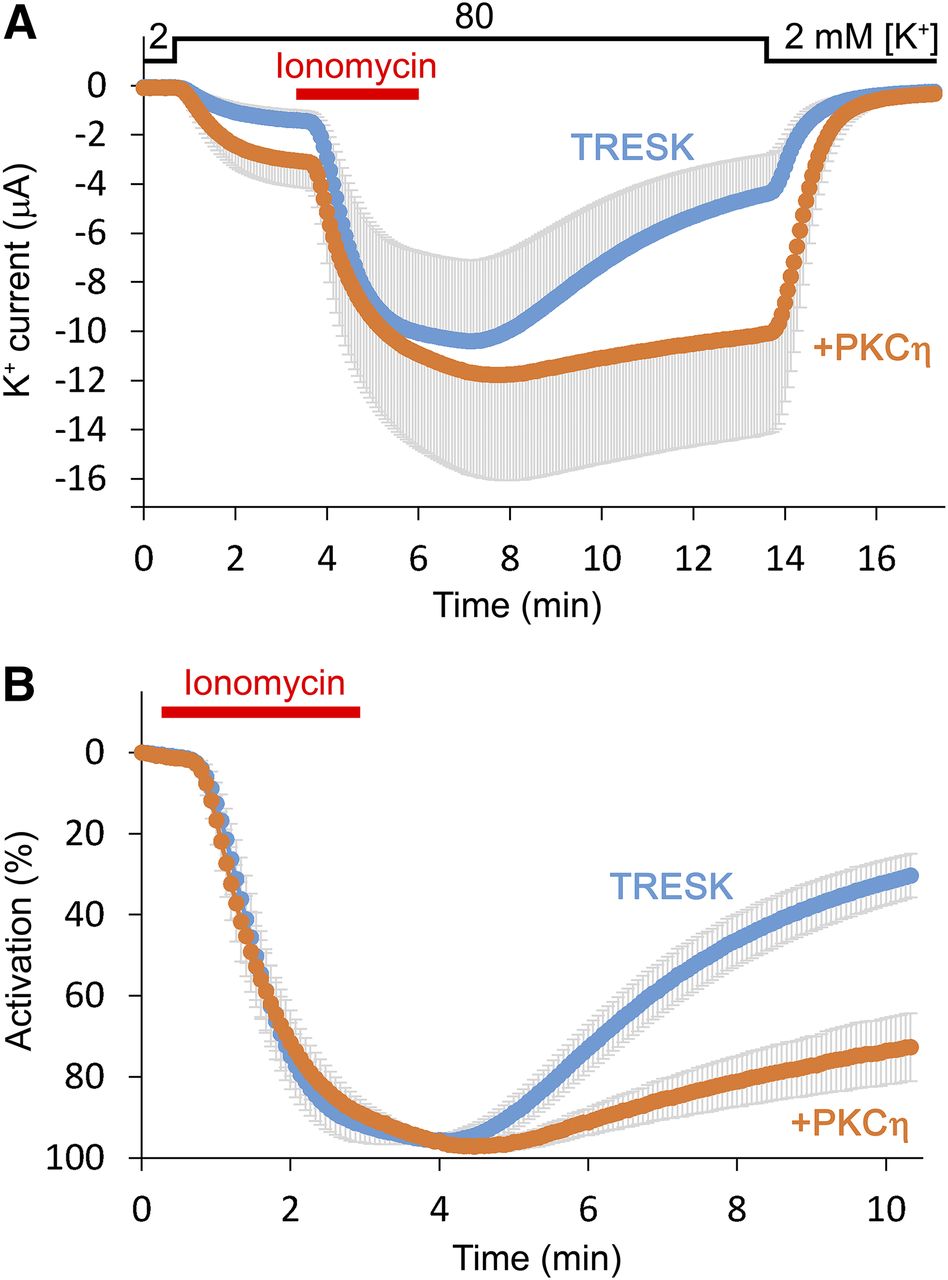
Coexpression of novel-type PKC with TRESK slows recovery of the current from the activation induced by ionomycin. (A) The average K+ currents of Xenopus oocytes expressing human TRESK (light blue, n = 7) or coexpressing the channel with PKCη (PKCη, orange, n = 5) are plotted. Cells were stimulated with ionomycin (0.5 μM), as indicated by the red bar. Afterward, the return of the current to the resting state was recorded for a long period in 80 mM EC [K+]. [K+] changes are shown above the graph. Only plus or minus error bars (gray, S.E.) are shown. (B) Activation of the same currents as in (A) was plotted as percentage values. The K+ current measured before the application of ionomycin was normalized to 0% activation, whereas the maximum current amplitude to 100%. The major part of the variation of data in (A) was caused by the different channel expression in the oocytes, and recovery from activation was rather uniform within the groups (see gray error bars). Note that recovery from the activated state was significantly slowed in the presence of PKCη.
- Fig. 7.
MARK2Δ restores the basal inhibition of TRESK in the presence of PKCε and accelerates the recovery of the K+ current to the resting state after ionomycin. The average K+ currents of Xenopus oocytes coexpressing human TRESK with the constitutively active A159E mutant PKCε (PKCε-CA, orange, n = 10), or coexpressing the channel with PKCε-CA and MARK2Δ (triple coexpression, PKCε-CA + MARK2Δ, blue, n = 9) are plotted. Cells were stimulated with ionomycin (0.5 μM), as indicated by the red bar. The method of representation is similar to that in Fig. 6A. Note the reduced basal TRESK current in the presence of MARK2Δ and the identical peak currents in the two groups. The recovery to the resting state after ionomycin was accelerated in the cells also coexpressing MARK2Δ compared with the group coexpressing only PKCε-CA and TRESK.
- Fig. 8.
Dephosphorylation of TRESK protein in response to PMA treatment of the cells is demonstrated by Phos-tag SDS-PAGE, followed by anti-HA immunoblot. (A1–A3) The oocytes expressing N70Q mutant, double HA-tagged human TRESK were incubated with CsA (1 μM) plus FK506 (1 μM) for 45 minutes (lane 2), with ionomycin (1 μM) for 3 minutes (lane 3), or with PMA (100 nM) for 45 minutes in the presence of CsA + FK506 (lane 4). The plasma membrane proteins from another group of oocytes treated with CsA + FK506 (as in lane 2) were in vitro dephosphorylated with λ phosphatase (lane 5). Noninjected cells, treated with CsA + FK506 (non-inj.), were applied as a control for the specificity of the anti-HA Western blot (lane 1). The proteins of the plasma membrane preparation from all groups of these cells were analyzed on 8% SDS-PAGE gels containing 15 μM Phos-tag reagent and 45 μM Zn2+, using the neutral (Tris-MOPS) buffer system. Dephosphorylated TRESK is indicated with an asterisk (*), the region of phosphorylated TRESK proteins with a double asterisk (**), whereas dimeric TRESK with a hash (#). The phosphorylation status of TRESK was examined in three independent representative experiments, and in each experiment, five groups of equal numbers of Xenopus oocytes were used (n = 11, 34, and 26 for each group, in (A1–A3), respectively). Lanes 3 and 4 were loaded in reverse order in (A1). (B1–B3) The same samples as in (A1–A3), respectively, were run on conventional SDS-PAGE gels without Phos-tag and visualized by anti-HA Western blot to compare the amounts of total (phosphorylated + dephosphorylated) TRESK protein. Numbering of the lanes corresponds to the samples in (A1–A3). In (B2a and B2b), the image of the same blotting membrane is shown with a longer and shorter exposition time, respectively. In (B1 and B3), the Tris-MOPS buffer system was used for the SDS-PAGE; in the (B2), the Tris-Gly system.
- Fig. 9.
Schematics illustrating the mechanism of TRESK activation by novel-type PKC. TRESK is activated by the dephosphorylation of the S262, 264, 267 serine cluster (only S264 is shown), whereas it is inhibited by the phosphorylation of the same regulatory region. Novel-type PKC inhibits the kinase activity responsible for TRESK phosphorylation (i.e., PKC activates the channel by the release of inhibition). After the inhibition of the TRESK-inhibitory kinase, the channel is slowly dephosphorylated by a weak protein phosphatase activity in a process different from the rapid and robust calcium-dependent activation of the channel by calcineurin. Microtubule-affinity regulating kinase 2 (MARK2) can be used to phosphorylate the S262, 264, 267 cluster under experimental conditions, but other kinases may also phosphorylate TRESK in vivo. The S252 regulatory site of TRESK is not depicted, since it does not contribute to the effect of novel-type PKC.


