


Abstract
Three small conductance calcium-activated potassium channel (SK) subunits have been cloned and found to preferentially form heteromeric channels when expressed in a heterologous expression system. The original cloning of the gene encoding the intermediate conductance calcium-activated potassium channel (IKCa) was termed SK4 because of the high homology between channel subtypes. Recent immunovisualization suggests that IKCa is expressed in the same subcellular compartments of some neurons as SK channel subunits. Stochastic optical reconstruction microscopy super-resolution microscopy revealed that coexpressed IKCa and SK1 channel subunits were closely associated, a finding substantiated by measurement of fluorescence resonance energy transfer between coexpressed fluorophore-tagged subunits. Expression of homomeric SK1 channels produced current that displayed typical sensitivity to SK channel inhibitors, while expressed IKCa channel current was inhibited by known IKCa channel blockers. Expression of both SK1 and IKCa subunits gave a current that displayed no sensitivity to SK channel inhibitors and a decreased sensitivity to IKCa current inhibitors. Single channel recording indicated that coexpression of SK1 and IKCa subunits produced channels with properties intermediate between those observed for homomeric channels. These data indicate that SK1 and IKCa channel subunits preferentially combine to form heteromeric channels that display pharmacological and biophysical properties distinct from those seen with homomeric channels.
Introduction
The cloning of small conductance calcium-activated potassium channels (SKs) identified three channel subtypes, termed SK1–3, which are widely expressed in various tissues (Weatherall et al., 2010). For example, activation of these channels by a rise of intracellular calcium (Ca2+) underlies generation of the medium afterhyperpolarization in hippocampal neurons (Stocker et al., 1999; Bond et al., 2004). In contrast, cloning of the cDNA encoding intermediate conductance calcium-activated potassium channels (IKCa) revealed a sequence that showed approximately 40% similarity to SK channels at the amino acid level (Joiner et al., 1997). This level of homology ensured that the clone was originally named SK4. This subunit was originally identified in epithelial‐ and endothelial‐rich tissues and in the immune system (Balut et al., 2012). Expression of IKCa subunits gave rise to Ca2+-activated channels that, similar to SK1–3 channels, produced a voltage-independent current (Joiner et al., 1997). However, the pharmacology of SK4-mediated current is very different from SK1- to SK3-mediated current, and expressed SK4 channels exhibit a higher single-channel conductance than expressed SK channels (Köhler et al., 1996; Joiner et al., 1997).
Coexpression of SK channel subtypes has been demonstrated to form heteromeric channels (Church et al., 2015; Hancock et al., 2015). It is particularly obvious with coexpression of SK1 and SK2 subunits that heteromeric channels are preferentially formed, giving rise to a heteromeric channel that exhibits a sensitivity to inhibition by apamin that is intermediate to that observed with homomeric channels (Church et al., 2015). SK channel subunits coassemble by interaction between the carboxyl termini of subunits to form functional channels. The degree of amino acid sequence homology between carboxyl termini of IKCa and SK channels suggests that heteromerization might occur. Recently, it has been shown that IKCa subunit expression also occurs in the same cell types as SK channel subunits. IKCa subunits are expressed in neurons (Neylon et al., 2004; Mongan et al., 2005; Nguyen et al., 2007; Engbers et al., 2012; King et al., 2015; Turner et al., 2015, 2016) with IKCa subunits, for example, being expressed with all SK channel subunits in dorsal root ganglion and spinal cord neurons (Mongan et al., 2005). In addition, IKCa subunits are expressed in brain regions, such as the cortex, cerebellum, and thalamus (Mongan et al., 2005; Engbers et al., 2012; Turner et al., 2015, 2016). In particular, IKCa subunits are expressed in the soma of hippocampal neurons, coincident with the location of expressed SK1 subunits (Bowden et al., 2001; Turner et al., 2015, 2016).
Through stochastic optical reconstruction microscopy (STORM) imaging and fluorescence resonance energy transfer (FRET), we found that IKCa and SK1 fluorescent signals are closely associated when coexpressed in tsA-201 cells. Super-resolution imaging revealed overlapping clusters of fluorescent labels of tagged channels, and the strict requirements for proximity of proteins to exhibit FRET are consistent with the formation of heteromeric channels by IKCa and SK1 subunits. Expression of homomeric SK1 or IKCa channels gave currents that were sensitive to classic inhibitors/blockers, while coexpression of both subunits formed heteromeric channels with distinct pharmacology. Single-channel analysis showed that coexpression of both subunits formed heteromeric channels with properties that were intermediate between those exhibited by each homomeric channel. These data demonstrate that IKCa and SK1 subunits prefer to form heteromeric channels when coexpressed in a heterologous system that will alter their responsiveness to pharmacological tools typically used to define their expression pattern.
Materials and Methods
Direct STORM
Immunostaining.
For STORM imaging, tsA-201 cells grown on 18-mm No. 1.5 coverslips (VWR VistaVision, Canada) at 37°C were transfected with untagged human SK1 (hSK1) and human IKCa (hIKCa) cDNAs. After 32–48 hours, cells were washed with 1× PBS (Sigma-Aldrich, Canada) followed by fixation in 4% paraformaldehyde (Electron Microscopy Sciences, Canada) in 1× PBS for 10 minutes. After three rounds of washing in 1× PBS, cells were incubated with blocking medium consisting of 1× PBS, 5% (w/v) bovine serum albumin, and 0.2% (v/v) Triton X-100 for 45 minutes at room temperature (RT) (∼25°C). Cells were then incubated in blocking solution containing primary antibodies against SK1 (rabbit anti-KCa2.1; APC-039; Alomone Laboratories, Israel) and IKCa channels (mouse monoclonal IK1; sc-365265; Santa Cruz Biotechnology) at 1:250 dilution for 45 minutes (RT). After washing three times with blocking medium for 10 minutes each (RT), cells were treated with Alexa Fluor-647–conjugated goat F(ab′)2 anti-rabbit IgG (111-606-047; Jackson ImmunoResearch) or Cy-3–conjugated rabbit F(ab′)2 anti-mouse IgG (315-166-047; Jackson ImmunoResearch) in blocking medium at 1:1000 dilution for 45 minutes (RT). Stained cells were post fixed in 4% paraformaldehyde and 0.1% glutaraldehyde solution in 1× PBS for 10 minutes. TetraSpek beads (100-nm diameter; Thermo Fisher, Canada) were added to the coverslips for 30 minutes (RT), and then cells were thoroughly washed and stored at 4°C in 1× PBS until imaging. The specificity of anti-hSK1 and anti-hIKCa antibodies was verified by colabeling tsA-201 cells expressing either cDNA in isolation (Supplemental Fig. 1). Labeling and imaging were performed from cells prepared from a minimum of three different experiments.
Direct STORM Data Acquisition.
STORM imaging was performed in a freshly prepared buffer consisting of 1× PBS, 10% (w/v) glucose, 10 mM β-mercaptoethanol, as well as an oxygen-scavenging GLOX solution containing 0.5 mg/ml glucose oxidase (Sigma-Aldrich) and 40 µg/ml catalase (Sigma-Aldrich). A 10× glucose oxidase + catalase (GLOX) solution was prepared as a stock and stored in aliquots at −20°C. On the day of imaging, one aliquot of GLOX solution was thawed and used to prepare the direct STORM imaging buffer. Cells on 18-mm coverslips were then sealed onto concavity slides (Eisco Laboratories, Canada) containing STORM imaging buffer with the help of VALAP sealing (equal parts of paraffin, Vaseline, and lanolin).
Samples were positioned on the piezo Z-controlled stage of a Diskovery Flex microscope (Quorum Technologies, Guelph, ON, Canada) equipped with 405-, 561-, and 637-nm solid-state laser lines. Total internal reflection fluorescence (TIRF) illumination was used with a Leica HC Plan Apo 63X/NA 1.47 oil immersion objective, and the stochastic blinking was detected with an Andor iXon Ultra 897 EMCCD camera. The TIRF signal was imaged within 100–150 nm of the membrane surface. Stronger-intensity laser illumination was used to photoswitch the vast majority of fluorophores into a temporary dark state (laser power: 561 nm, 55 mW at 100%; 647 nm, 53 mW at 100%). Subsets of active fluorophores were then imaged at a lower laser intensity (70%–95% excitation) at 20-ms intervals (frame rate of 50 Hz) between consecutive frames. During image acquisition, the 405-nm laser line was used to reactivate the Alexa Fluor-647 or Cy-3 dyes. For individual experiments 20,000–35,000 image frames were acquired that were further processed offline to reconstruct a super-resolution image.
Image Reconstruction and Analysis.
Image reconstruction of the STORM data streams was carried out using the ThunderSTORM plug-in for FIJI (ImageJ; National Institutes of Health) (Schindelin et al., 2012; Ovesný et al., 2014). Using this plug-in, the image streams were wavelet filtered using defined camera settings (pixel size: 150 nm; photoelectrons per analog/digital (A/D) count: 8.98; base level A/D count: 200; electron multiplying gain: 300) and rendered as a two-dimensional Gaussian fit of each localization. Single-molecule events were detected using an eight-point neighborhood local maxima principle, and a weighted least-squares fitting of two-dimensional Gaussian was used to localize the subpixel centroids. The reconstructed images were displayed using a normalized Gaussian algorithm. Cross-correlation and fiducial bead-based drift correction were carried out through alignment of 3- to 6100-nm fiducial TetraSpek beads (Thermo Fisher) contained within the field of view to ensure the images were registered spatially. In most cases, mechanical drift over the time frame required for imaging (30–40 minutes) ranged no more than 0–500 nm, with any cases approaching 1 µm excluded from analysis. Spatial coordinates (X and Y) and intensity information of individual point localizations were exported as a text file for further analysis in the open-source Localization Microscopy Analyzer (LAMA) software (Malkusch and Heilemann, 2016) and in MATLAB (MathWorks). The X-Y coordinates of fiducial beads were used as the reference point to align signals for IKCa and hSK1 channels using the affain registration function of LAMA.
Cluster Analysis.
Clusters of individual proteins were detected based upon size and intensity information using a morphologic cluster analysis algorithm (LAMA) (Malkusch and Heilemann, 2016). The background intensity level was used for thresholding the data sets. A minimum radius criterion of 40 nM was set for cluster detection, considering that localization precision was ∼25–35 nm, excluding clusters less than 40-nm diameter from analysis. The cluster centroid (X, Y) positions outputted by LAMA were calculated to determine the distances between clusters of fluorophores tagged to hSK1 or IKCa channels, and between the clusters of tagged hSK1 and IKCa channels using MATLAB. In all, the minimum Euclidean distances between the points in the hSK1 data sets, the IKCa data sets, and between the hSK1 and IKCa data sets were determined. Cluster sizes are presented as the mean ± S.D. across seven cells by STORM imaging of ∼450–1000 clusters per cell. Mean values presented were thus derived from 3866 clusters of hIKCa and 3059 clusters of hSK1 immunolabels. The sample value (n = 7) thus represents the number of cells from which all clusters were identified.
FRET.
For FRET imaging, tsA-201 cells were seeded onto poly-l-lysine–coated 35-mm glass-bottom petri dishes. Fluorescent-tagged constructs were generated using PCR-based amplification of hSK1 and hIKCa open reading frames, excluding the stop codon, bearing overhanging HindIII and AgeI restriction sites. Amplified products of hSK1 and hIKCa and empty pmKate2 vector (referred to as mKate throughout) were double digested with HindIII and AgeI restriction enzymes (New England Biolabs [NEB]) followed by ligation with T4 DNA ligase (NEB) for generation of hSK1–enhanced green fluorescent protein (eGFP) and hIKCa-mKate–tagged constructs. In both hSK1-eGFP and hIKCa-mKate, fluorophores were attached to the C terminus of hSK1 and hIKCa channels. Restriction digestion and DNA sequencing were carried out to validate tagged constructs.
For FRET analysis, cells were transiently transfected with combinations of hSK1-eGFP (2 µg/ml cDNA), hIKCa-mKate (2 μg/ml cDNA), eGFP (2 µg/ml cDNA), or mKate (2 µg/ml cDNA). Cells were then incubated for 48 hours at 37°C and 5% CO2, washed, and replaced with colorless imaging medium composed of 148 mM NaCl, 3 mM KCl, 10 mM HEPES, 3 mM CaCl2, 10 mM glucose, and 1 mM MgCl2 (pH 7.3) at 25°C. Cells were examined with a Nikon C1si spectral confocal laser-scanning microscope with a 40×/1.3NA oil immersion objective. hSK1-eGFP was excited at 457 nm, and hIKCa-mKate at 561 nm. Emission spectra of eGFP and mKate were recorded between 400 and 750 nm, and ImageTrak software (P. K. Stys, http://www.ucalgary.ca/styslab/imagetrak) was used to analyze the imaging data as described previously (Asmara et al., 2017; Sahu et al., 2017). Spectral images were linearly unmixed, collapsing a 32-channel spectral image into a 2-channel image representing the integrated intensities of eGFP and mKate fluorescence emissions. Efficiency of FRET was calculated using the formula EFRET = FA / (FA + FD), where FA corresponds to peak emission intensity of acceptor fluorophore, FD corresponds to peak emission intensity value of donor fluorophore, and EFRET corresponds to efficiency of FRET between donor and acceptor fluorophore (Erkens et al., 2013).
Cell Culture and Electrophysiology.
The tsA-201 cell line was maintained as described previously (Lamy et al., 2010). Cells were transiently transfected with hSK1 or hIKCa or both using polyethyleneimine (Alfa Aesar, Inc.) by combining channel plasmid DNA with eGFP cDNA at a ratio of 1:5 (maximal plasmid content: 1.5 µg). The ratio of coexpressed subunit plasmid DNA was 1:1. Cells were used for electrophysiology 16–24 hours after transfection. For functional validation of the hSK1-eGFP and hIKCa-mKate cDNAs used for FRET imaging, 2 µg of either cDNA was cotransfected with eGFP (1 µg/ml) in tsA-201 cells using a calcium phosphate–based transfection reagent and whole-cell patch-clamp recordings performed 24–48 hours after transfection.
Expressed currents were recorded in the excised outside-out patch configuration for pharmacology and in the whole-cell configuration to verify tagged construct properties using symmetrical high (∼160 mM) K+ conditions and an internal solution that contained 1 µM free Ca2+. Pipettes were fabricated from KG-33 glass (Friedrich & Dimmock, Inc.) and filled with an internal solution of the following composition: 97 mM KAsp and 20 or 117 mM KCl, 10 mM HEPES, 10 mM EGTA, 1.5 mM Na2ATP, 9.65 mM CaCl2 (1 µM calculated free [Ca2+]i), and 2.34 mM MgCl2 (1 mM calculated free [Mg2+]i) (pH 7.4), with ∼40 mM KOH. Cells were bathed in a control external solution that consisted of 97 mM KAsp and 20 or 127 mM KCl, 10 mM HEPES, 10 mM EGTA, 6.19 mM CaCl2 (60 nM calculated free [Ca2+]i), and 1.44 mM MgCl2 (1 mM calculated free [Mg2+]i) (pH 7.4), with ∼40 mM KOH. Expressed currents were revealed by a 1-second voltage ramp from −100 to +100 mV. Apamin (Sigma-Aldrich, UK; or Abcam, Canada); 6,12,19,20,25,26-hexahydro-5,27:13,18:21,24-trietheno-11,7-metheno-7H-dibenzo [b,n] [1,5,12,16]tetraazacyclotricosine-5,13-diium dibromide (UCL1684; Tocris Biosciences, Bristol, UK); charybdotoxin (Ctx; Santa Cruz Biotechnology); and 1-[(2-Chlorophenyl)diphenylmethyl]-1H-pyrazole (TRAM-34; Tocris Biosciences, UK/Canada) were added to the external bath solution. TRAM-34 was dissolved in DMSO at 10 mM stock concentration, and aliquots were stored at −20°C until used. UCL1684 was dissolved at a stock concentration of 100 μM in DMSO, and aliquots were stored at −20°C. Finally, apamin and Ctx were dissolved in distilled water at a stock concentration of 100 μM, and aliquots were stored at −20°C. All compounds were defrosted on the day of recording, with aliquots only thawed once, and desired concentrations were prepared by dilution in bath solution.
For concentration-inhibition relationships, data points representing current block were fit with a variable-slope Hill equation in the following form: where Icont is the amplitude of current at −60 mV in the absence of drug, I is the amplitude of current observed at a given concentration of blocker ([X], expressed in logarithmic units), Amin is Imin/Icont, Amax is Imax/Icont, IC50 is the concentration of blocker that blocks 50% of the sensitive current, and nh is the Hill coefficient.
Inside-Out Patch Electrophysiology
HEK293 cells expressing hSK1, hIKCa, or hSK1 and hSK1 channel subunits were bathed in a solution of the following composition: 97 mM KAsp, 30 mM KCl, 10 mM HEPESNa, 10 mM EGTA, 9.28 mM CaCl2 (1 µM calculated free [Ca2+]i), and 2.5 mM MgCl2 (1 mM calculated free [Mg2+]i) (pH 7.4), with ∼40 mM KOH. Quartz electrodes (1.5-mm o.d., 0.5-mm i.d.) were filled with the same solution and had resistances of 8–14 MΩ. Channel activity was recorded at −30, −50, −70, and −90 mV from a holding potential of 0 mV, with all potentials expressed as the negative of that which was applied to the patch. Data were acquired with an Axopatch 200A amplifier, filtered at 1 kHz (low-pass 8-pole Bessel), and sampled at 10 kHz using Pulse (HEKA, Germany). Single-channel events were analyzed using Tac and TacFit (Bruxton), which utilizes a spline interpolation procedure and the “50% threshold” technique to quantify event amplitudes and durations. Threshold was adjusted for each opening, and all events were manually inspected before being included in analysis. Amplitude histograms used only events >1 ms to ensure that events had reached full amplitude. Missed short events due to the rise time of the filter were not accounted for. All amplitudes for a given voltage in a single patch were binned and fit with a Gaussian distribution, the mean of which represented the amplitude at that voltage.
Open-time distribution histograms were logarithmically binned, with the square root of the number of events (√#evts) plotted against log10 duration. Histograms were fit with a sum of exponential probability density functions (PDFs) of the following form: where N is the number of PDFs required to best fit the data, ai is the proportional weighting of each PDF
  , τi is the time constant of each PDF, and t is the time bin. Data were fit using the maximum likelihood method, with the minimum number of exponential PDFs required to best describe the data that were used.
Statistical Analysis.
All numerical values are expressed as the mean ± S.D. Group sizes were not prespecified before acquisition of data. All intergroup statistical comparisons were decided before initial data had been obtained. Data were analyzed with a Student’s t test or one-way ANOVA (GraphPad Software, San Diego, CA). All statistical comparisons that were performed are reported in the manuscript. A paired two-tailed t test was used to compare inhibition of current by added inhibitor, while an unpaired two-tailed t test was used to compare the magnitude of inhibition of homomeric and heteromeric current by an inhibitor. An unpaired t test was used to test the cluster radius using GraphPad Prism 4.0 (GraphPad Software). Representative current traces were drawn using Origin 9.1 (Microcal Software Inc., Northampton, MA). Finally, reported statistical comparisons did not test a prespecified null hypothesis and are only descriptive.
Results
SK1 and IKCa subunits are derived from the same gene family of Ca2+-dependent potassium channels, but functional homomeric channels display distinct pharmacological profiles that arise from sequence differences between channel isoforms. We used possible changes in pharmacological response, together with point localization and FRET microscopy, to determine whether expressed hSK1 and hIKCa in tsA-201 cells assemble as homomeric or heteromeric channels.
hSK1 and hIKCa Coclusters Detected by STORM.
At the molecular level, a functional heteromeric channel will be composed of SK1 and IKCa channel α subunits in very close proximity. Structural studies of single voltage-gated and calcium-activated potassium channels predicted that an assembled channel exhibits a diameter of ∼10–15 nm (Doyle et al., 1998; Jiang et al., 2002; Wang and Sigworth, 2009). Imaging structures of this size using standard optical microscopy is restricted by diffraction, with a typical resolution of approximately ∼250 nm. To probe structures below the resolution limit, complementary techniques, such as STORM and FRET, can be applied to determine if hSK1 and hIKCa subunits associate with a proximity consistent with heteromeric channel formation when coexpressed in tsA-201 cells.
Cells transiently expressing untagged hSK1 and hIKCa subunits were fixed and processed for immunolabeling of each channel subunit. STORM imaging was conducted with TIRF illumination at a depth of ∼100–150 nm to capture fluorescent signals arising from proteins residing in the plasma membrane or immediate subplasma membrane compartment (Zhang et al., 2016; Vivas et al., 2017). STORM can be used to determine the location of proteins according to the detection of stochastic blinking of fluorophores upon return from a dark state to the ground state (Rust et al., 2006; Bates et al., 2007; van de Linde et al., 2011). Each final STORM-TIRF image was derived from 20,000–35,000 individual images to capture a cloud of individual blinking events, followed by Gaussian filtering to define the spatial location of fluorophore-tagged channel proteins (Thunderstorm, ImageJ) (Ovesný et al., 2014). The images were corrected for any drift or chromatic aberration by aligning two to six 100-nm fiducial beads located within the field of view using affain registration (LAMA) (Malkusch and Heilemann, 2016). The precision of localization was then measured using a least-squares-based localization algorithm (Thompson et al., 2002). Through this process, proteins could be localized with a precision of 37.1 ± 4.5 nm for hSK1 channels and 26.2 ± 4.2 nm for hIKCa channels (n = 7).
STORM-TIRF images of tsA-201 cells coexpressing hSK1 and hIKCa channel subunits revealed a relatively uniform pattern of punctate immunolabeling for channels across the surface of the cell (Fig. 1A). A morphologic cluster analysis was applied to elucidate the spatial relationship between immunolabels (LAMA) (Malkusch and Heilemann 2016). A minimum criterion corresponding to a 40-nm radius was used to define a cluster, given our estimated precision of SK1 and IKCa fluorescent signals of approximately 25–35 nm. This analysis indicated that cluster radii varied substantially (40–600 nm) but had a similar mean radius for hSK1 of 175 ± 113 (n = 7) and for hIKCa of 170 ± 96 nm (n = 7). Since the width of individual potassium channels is ∼10–15 nm, the mean radius for hSK1- and hIKCa-immunolabeled clusters is interpreted to reflect signals that arise from multiple channels (see Discussion).

STORM imaging revealed close apposition and overlap between clusters of fluorescent-tagged hSK1 and hIKCa channels expressed in tsA-201 cells. (A and B) Low-magnification immunofluorescence images of hSK1 (red) and hIKCa (green) channels coexpressed in tsA-201 cells (A), with indicated regions-of-interest (ROIs) expanded below (B). Clusters of fluorescent tags localized by STORM imaging and analysis are often overlapping (open blue arrows); closely opposed (solid blue arrow); or, in some cases, overlapping signals for hIKCa (solid white arrow) or hSK1 (open white arrow). Scale bars, 5 µm (A) and 500 nm (B). (C–E) Gaussian-distributed histogram plots of the minimum nearest-neighbor Euclidean distances between centroids of neighboring clusters for the indicated pairs of labels (bin width, 25 nm).
Close examination of the distribution of immunolabels revealed that the vast majority of hSK1- and hIKCa-labeled clusters were in close apposition or partially overlapped with one another, with only a few isolated clusters (Fig. 1B). After cluster centroids were identified, a nearest-neighbor analysis indicated that the minimum distance between neighboring hSK1-hSK1 clusters followed a normal distribution, with a peak of 875 ± 68 nm (n = 7) (Fig. 1C). The nearest-neighbor distance between hIKCa-hIKCa cluster centroids was also normally distributed, with a peak of 975 ± 11 nm (n = 7) (Fig. 1D). However, a histogram plot of the hSK1-hIKCa nearest neighbors was skewed to the right, with a peak of 205 ± 76 nm (n = 7) (Fig. 1E). These data suggest no specific association between clusters of a given fluorophore-labeled subunit but a preferred close association between hSK1-hIKCa clusters, as found in the overlap of fluorescent labels in Fig. 1, A and B.
Fluorophore-Tagged hSK1 and hIKCa Channel Subunits Exhibit FRET.
Spectral FRET imaging was used to examine if hSK1 and hIKCa subunits can physically associate with a proximity (<10 nm) expected for a heteromeric channel. Specifically, imaging for FRET was tested between a C-terminal eGFP-tagged SK1 subunit (donor) and a C-terminal mKate-tagged IKCa subunit (acceptor). Control recordings of fluorophore-tagged channels expressed in tsA-201 cells verified both tagged subunits generated the appropriate current when expressed alone and displayed block by apamin (hSK1) or TRAM-34 (hIKCa) (Supplemental Fig. 2). When both constructs were coexpressed in tsA-201 cells, excitation with a 457-nm laser line yielded fluorescence emission consistent with FRET, as indicated by dual emission spectra for both hSK1-eGFP and hIKCa-mKate (Fig. 2A). By comparison, excitation using a 561-nm laser line produced, as expected, emission spectra of hIKCa-mKate alone (Fig. 2B). Further, no FRET was detected in cells coexpressing eGFP-tagged hSK1 with mKate cDNA (Fig. 2, C and D) or in cells coexpressing mKate-tagged hIKCa with eGFP (Fig. 2, E and F). The ability to detect FRET between channel subunits expressed in homomeric assembly was tested by coexpressing hSK1 cDNAs tagged with eGFP or mKate (Fig. 2G) or hIKCa cDNA tagged with eGFP or mKate (Fig. 2H). Together these data reveal high-efficiency FRET between channel subunits coexpressed as either homomeric or heteromeric combinations in tsA-201 cells (Fig. 2I). FRET measurements thus support the results obtained from the STORM-TIRF analysis of a heteromeric assembly of hSK1 and hIKCa subunits.

hSK1 channels associated with hIKCa channels to support FRET. Fluorescence spectral confocal images of tsA-201 cells expressing combinations of constructs for hSK1-eGFP (donor molecule) and hIKCa-mKate (acceptor molecule) excited at either 457 or 561 nm. The associated plots show the average emission spectrum for each condition obtained from 30 to 40 cells from three to four independent experiments. Vertical lines denote the laser line of excitation. (A and B) Excitation at 457 nm for cells coexpressing hSK1-eGFP and hIKCa-mKate channels induced FRET, as indicated by a dual emission spectra for eGFP (A) due to a direct excitation of eGFP and for mKate through energy transfer, as compared with only an hIKCa-mKate emission spectra when excited at 561 nm (B). (C–F) No FRET is detected in cells coexpressing hSK1-eGFP channels and mKate cDNA (C and D), or in cells coexpressing hIKCa-mKate channels and eGFP cDNA (E and F). (G and H) FRET measurements evoked at 457 nm in tsA-201 cells expressing hSK1-eGFP and hSK1-mKate (G) or cells expressing hIKCa-eGFP and hIKCa-mKate (H). (I) Mean bar plots of FRET efficiency between the indicated pairs of expressed cDNAs when excited at 457 nm. High-efficiency FRET emissions are detected for homomeric and heteromeric coexpressions. Scale bars (20 µm) refer to all panels.
Pharmacology of Expressed Currents.
Previous work has shown that heteromeric assembly of alpha subunits from different channel isoforms can alter channel properties (Manganas and Trimmer, 2000; Akhtar et al., 2002; Etxeberria et al., 2004; Sokolov et al., 2007; Al-Sabi et al., 2010; Abi-Gerges et al., 2011; Brueggemann et al., 2011; Jenkins et al., 2011). We used a pharmacological approach to compare the properties of homomeric hSK1 and hIKCa channels to those formed when subunits are coexpressed. Outside-out patches excised from tsA-201 cells expressing hSK1 channel subunits had inward-rectifying currents activated by 1 μM Ca2+ contained in the electrode solution, revealed by voltage ramps from −100 to +100 mV (Fig. 3). As expected from previous studies, hSK1 current was inhibited by apamin (100 nM) (Fig. 3A) or UCL1684 (100 nM) (Fig. 3B) but was insensitive to TRAM-34 (10 μM) (Fig. 3C) or Ctx (100 nM) (Fig. 3D). In contrast, excised outside-out patches from cells expressing hIKCa channel subunits displayed Ca2+-dependent currents that exhibited various degrees of inward rectification. Extracellular application of TRAM-34 (10 μM) (Fig. 4A) or Ctx (100 nM) (Fig. 4B) blocked current, whereas the SK current inhibitors apamin (Fig. 4C) and UCL1684 (Fig. 4D) were without effect. These data demonstrate that homomeric hSK1 and hIKCa channel currents display distinct pharmacology.
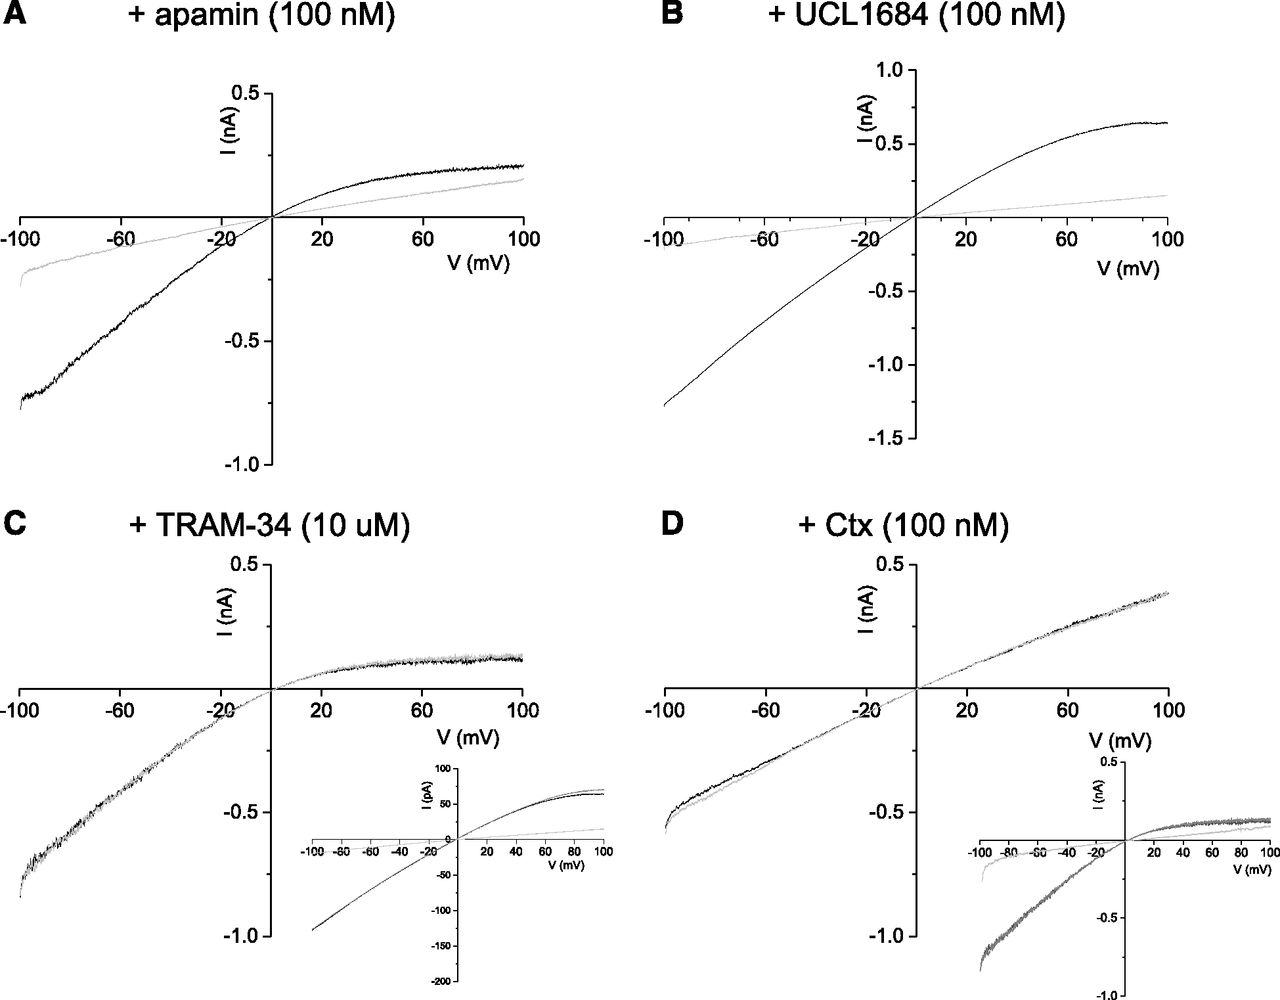
Pharmacology of homomeric hSK1 channel current. Membrane currents evoked by a voltage ramp from −100 to +100 mV (1-second duration) from outside-out patches excised from cells transiently expressing hSK1 subunits. hSK1-mediated current was inhibited by both apamin (100 nM) (n = 9) (A) and UCL1684 (100 nM) (n = 13) (B) but not affected by TRAM-34 (10 μM) (n = 7) (C) or Ctx (100 nM) (n = 5) (D). Inset in (C) shows subsequent addition of UCL1684 (100 nM) inhibited current not affected by TRAM-34, while inset in (D) illustrates subsequent block of Ctx-insensitive hSK1 current by apamin.

Pharmacology of homomeric hIKCa channel current. Membrane currents evoked by a voltage ramp from −100 to +100 mV (1-second duration) from outside-out patches excised from cells transiently expressing hIKCa subunits. hSK1-mediated current was completely inhibited by both TRAM-34 (10 μM) (n = 7) (A) and Ctx (100 nM) (n = 4) (B) but not affected by apamin (100 nM) (n = 9) (C) or UCL1684 (100 nM) (n = 6) (D). Insets in (C and D) show that subsequent addition of TRAM-34 (10 μM) inhibited IKCa current that was insensitive to the SK current inhibitors apamin (C) and UCL1684 (D).
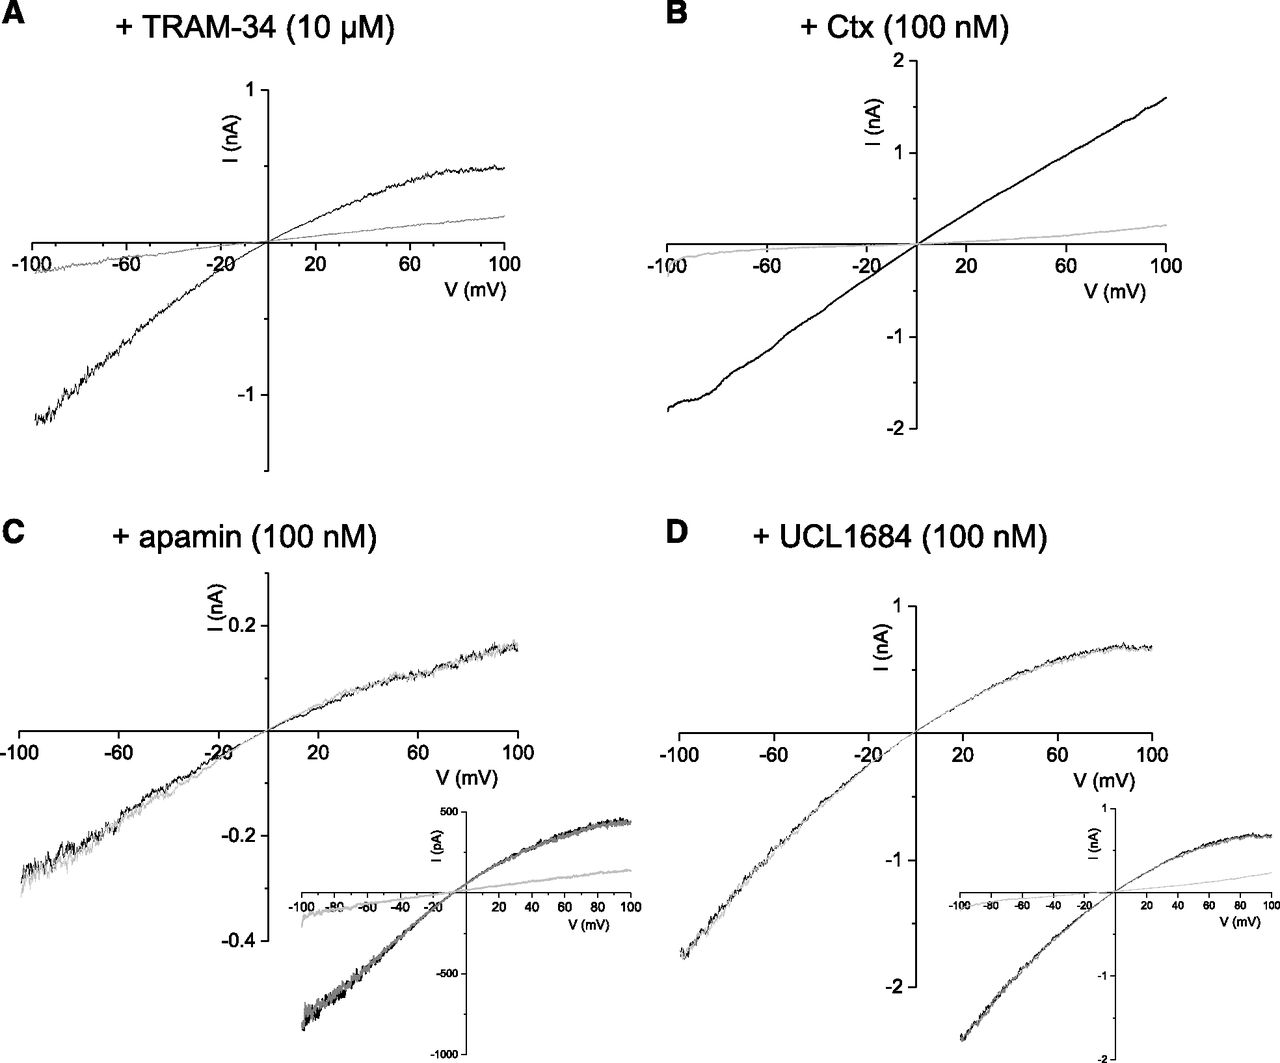
Coexpression of hSK1 and hIKCa channel subunits produced inward-rectifying current, revealed by a voltage ramp from −100 to 100 mV (Fig. 5). Extracellular application of inhibitors to excised outside-out patches revealed a different pharmacology from that seen with homomeric channels. Application of apamin (100 nM) (Fig. 5A) and UCL1684 (100 nM) (Fig. 5B) had no significant effect on current, demonstrating that no homomeric hSK1 channels were formed. In contrast, current was only partially inhibited by TRAM-34 (10 μM) (Fig. 5C) or Ctx (100 nM) (Fig. 5D). For example, addition of TRAM-34 (10 μM) inhibited 92% ± 1.4% of homomeric hIKCa current at −60 mV (n = 7, P = 0.0001), whereas only 54.6% ± 9.1% inhibition was observed for heteromeric hSK1-hIKCa current (n = 10, P = 0.0001) (P value of difference in block). A similar change in sensitivity to Ctx was noted, where homomeric hIKCa current was blocked by 95.5% ± 11% by 100 nM Ctx (n = 4, P = 0.0001), but only a 30.6% ± 23.1% block was observed for heteromeric hSK1-hIKCa current (n = 7, P = 0.0001).

Pharmacology of heteromeric hSK1-hIKCa channel current. Membrane currents evoked by a voltage ramp from −100 to +100 mV (1-second duration) from outside-out patches excised from cells transiently expressing both hSK1 and hIKCa subunits. hSK1-IKCa–mediated current was partially inhibited by both TRAM-34 (10 μM) (n = 10) (A) and Ctx (100 nM) (n = 7) (B) but not affected by apamin (100 nM) (n = 7) (C) or UCL1684 (n = 12) (100 nM) (D). Insets in (A and B) show that subsequent addition of TRAM-34 (10 μM) inhibited hSK1-hIKCa current that was insensitive to the SK current inhibitors apamin (A) and UCL1684 (B).
Inhibition by TRAM-34 was further investigated by generation of concentration-inhibition relationships from outside-out patches excised from cells expressing only hIKCa channel subunits and from those coexpressing hSK1 and hIKCa channel subunits. TRAM-34–mediated inhibition of homomeric hIKCa current was best fit by a single Hill coefficient, with an IC50 of 41 nM and a maximum inhibition of 92% (Fig. 6, A and C). In contrast, the concentration-inhibition relationship for current from cells coexpressing hSK1 and hIKCa channel subunits showed that sensitivity of heteromeric channels is reduced, with an IC50 of 557 nM (Fig. 6, B and C). In addition, only approximately 55% of the current was sensitive to TRAM-34 (Fig. 6C). These data confirm that functional heteromeric channels displayed a unique pharmacology.
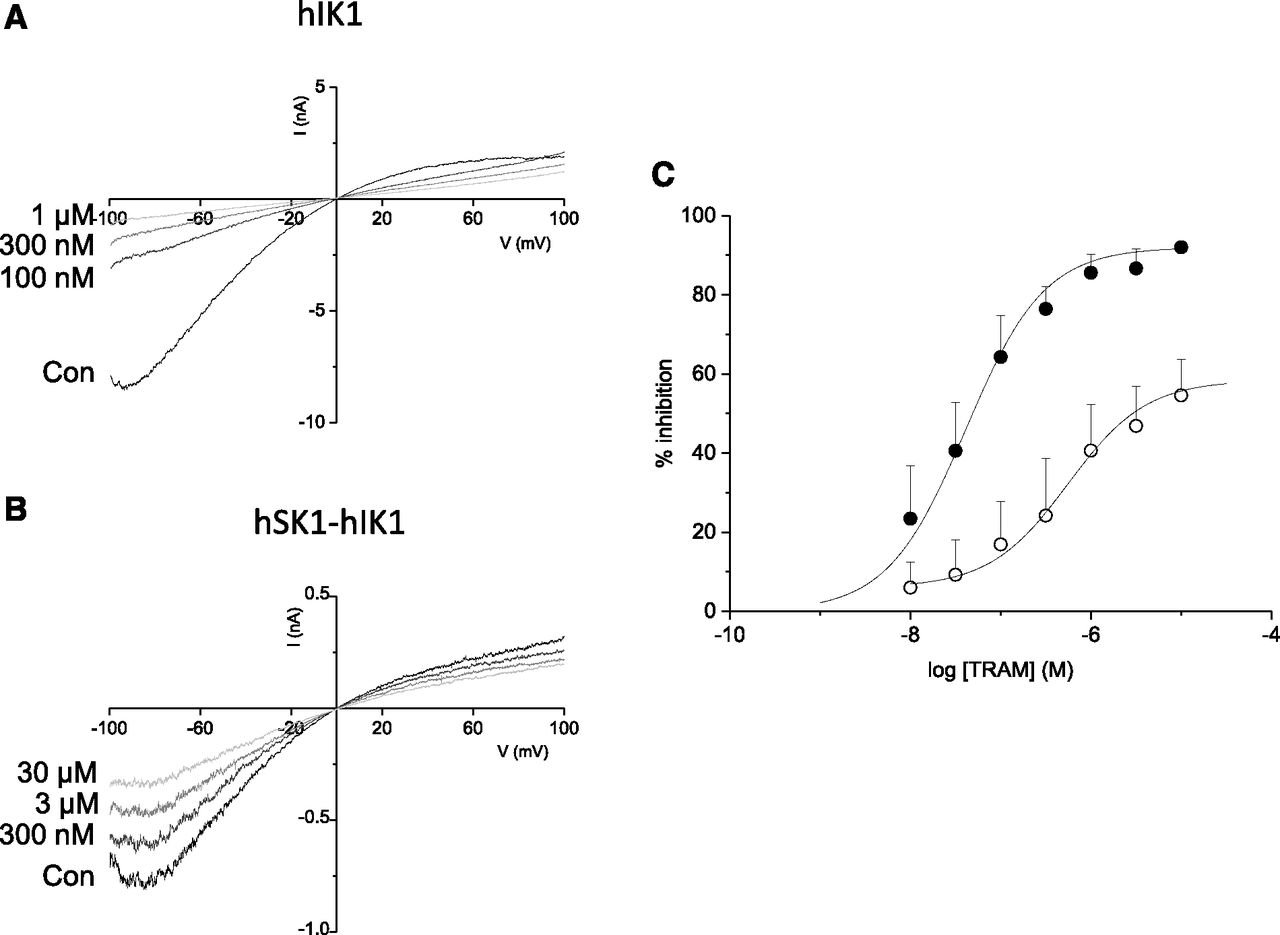
Comparison of the sensitivity of homomeric IKCa current and heteromeric hSK1-hIKCa current to inhibition by TRAM-34. (A) Membrane currents evoked by a voltage ramp from −100 to +100 mV (1-second duration) from an outside-out patch excised from a cell transiently expressing only hIKCa subunits. Current was inhibited in a concentration-dependent manner by increasing concentrations of TRAM-34. (B) Ramp currents evoked from an outside-out patch excised from a cell coexpressing hSK1 and hIKCa subunits. Evoked current was progressively inhibited by increasing concentrations of TRAM-34. (C) Concentration-inhibition relationships for TRAM-34–mediated inhibition of homomeric IKCa channel current (⬤) (n = 7) and heteromeric hSK1-hIKCa channel current (○) (n = 10). Homomeric current was inhibited by TRAM-34 with an IC50 of 41 nM, while heteromeric current was less sensitive, being inhibited by TRAM-34 with an IC50 of 557 nM. In addition, the maximum inhibition of heteromeric current was reduced when compared with inhibition of homomeric current. Con, control.
Single-Channel Properties of Expressed Channels.
The single-channel properties of expressed homomeric SK or IKCa channels have been reported under various ionic conditions. SK channels display a single-channel conductance of approximately 10–20 pS under isotonic K+ conditions (Köhler et al., 1996; Hirschberg et al., 1999; Goodchild et al., 2009). In contrast, IKCa channels display a single-channel conductance of approximately 11–50 pS (Ishii et al., 1997; Joiner et al., 1997; Logsdon et al., 1997; Vogalis et al., 2002; Neylon et al., 2004; Wulff et al., 2007; King et al., 2015). However, differences in experimental conditions make comparison difficult. Expressed homomeric hSK1 channels exhibited a conductance of 20 pS under isotonic 150 mM K+ conditions (10 out of 28 patches contained channel activity) (Fig. 7, A and B). In contrast, homomeric hIKCa channels displayed a conductance of 53 pS under identical conditions (7 out of 15 patches contained channel activity) (Fig. 7, A and B). The single-channel conductance of heteromeric channels was different from that observed for homomeric channels. Heteromeric hSK1-hIKCa channels displayed a conductance of 36 pS, intermediate between the values of each homomeric channel (7 out of 15 patches contained channel activity) (Fig. 7, A and B). The open-state kinetics of hSK and hIKCa channels exhibited marked differences. hSK1 channels exhibited a biexponential distribution with open-time constants of 3 and 23 ms (Fig. 7C). In contrast, hIKCa openings were clearly more brief, exhibiting a single exponential distribution with an open-time constant of 3 ms (Fig. 7C). The open-state kinetics of heteromeric channels were closer to those seen with homomeric hIKCa channels rather than hSK1 channels. Openings were best described by a single exponential distribution of time constant of 5 ms (Fig. 7C).

Single-channel properties of homomeric and heteromeric channels. (A) Membrane current traces from inside-out patches excised from cells expressing hSK1 (left), hSK1-hIKCa (center), and hIKCa (right) subunits. (B) Single-channel amplitudes were plotted against voltage to obtain conductance estimates for each channel complement, with hSK1 channels exhibiting a conductance of 20 pS (n = 3), hIKCa channels displaying a conductance of 53 pS (n = 3), and heteromeric hSK1-hIKCa channels exhibiting an intermediate conductance of 36 pS (n = 4). (C) Summed open-state kinetics differed between channel subtypes, with hSK1 displaying a biexponential open-time distribution of time constants (τ) of 3.4 and 22.5 ms. Homomeric hIKCa channels exhibited a monoexponential open-time distribution of time constant (τ) of 2.7 ms. Open-state kinetics of heteromeric hSK1-hIKCa channels were best described by a single exponential distribution of time constant (τ) of 4.9 ms.
Discussion
Formation of heteromeric channels adds more diversity to an already extensive population of functional K+ channels. It has been demonstrated that SK channel subunits preferentially form heteromeric channels, with no evidence of a mixture of heteromeric and homomeric channels when expressed in a heterologous system (Church et al., 2015). Such heterogeneity is seen with the SK3 variant SK3-1C, which can coassemble with all SK channel subunits and IKCa subunits to prevent expression in heterologous cells (Kolski-Andreaco et al., 2004). Obviously, this property of forming heteromeric channels can only be fulfilled in situ if subunits are expressed and reside in the same subcellular compartment. It is now documented that IKCa channels are expressed in both peripheral and central neurons and are present in cells that express both SK and IKCa channel subunits (Neylon et al., 2004; Mongan et al., 2005; Nguyen et al., 2007; Engbers et al., 2012; King et al., 2015; Turner et al., 2015; Tiwari et al., 2018).
The association between different proteins and the potential formation of heteromeric channels has been studied before through STORM in the case of KCNQ and Cav1.2/TRPV channels (Zhang et al., 2016), Cav1.3 and BK potassium channels (Vivas et al., 2017), and calcium channels in relation to presynaptic release machinery (Dani et al., 2010).
Analysis of the STORM data yielded cluster radii ranging between 40 and 600 nm of hSK1 and hIKCa channel subunits. It is important to recognize that, in these STORM experiments, we were not reporting on the localization of the channels themselves but rather the signal emitted from fluorophore-conjugated secondary antibodies. The number of primary or secondary antibodies associated with a single channel is unknown but could reflect at least four antibody complexes given the potential to label any of the four subunits in a homomeric channel. Similarly, the spatial orientation of antibodies and fluorophores is unknown. Given that both primary and secondary antibodies are ∼5–10 nm in size and fluorophores are 2 to 3 nm (i.e., Alexa 657), it is conceivable that an antibody complex oriented lateral to the imaging plane could add another ∼25-nm signal to the side of a single potassium channel. Thus, with a lateral dimension of 10–15 nm for a channel together with ∼50 nm for an assumed total width of fluorophore signals, the potential minimum cluster size increases to 65 nm. The smallest clusters of 40 nm detected here might then imply signals arising from single channels. Nevertheless, we recognize that this is the extreme case, suggesting that cluster dimensions more likely reflect signals associated with multiple ion channel–fluorophore localizations.
STORM imaging revealed a close association between hSK1- and hIKCa-related clusters (Fig. 1, A and B). Analysis of the Euclidean distance between nearest neighbors indicates that hSK1 and hIKCa subunits were preferentially associated (Fig. 1E). Further, a mean distance of 205 nm between the centroids of hSK1-hIKCa clusters (Fig. 1E) is close to the mean value of ∼170 nm for hSK1 and hIKCa cluster radii (Fig. 1C). These measures could account for the extensive overlap detected in adjacent hSK1 and hIKCa fluorescent clusters (Fig. 1B), results that are consistent with a very close association between hSK1-hIKCa subunits and heteromeric channel formation. We obtained further support for this conclusion by using FRET, which depends on an interaction between a pair of fluorophores positioned within a 10-nm distance (Bajar et al., 2016). Thus, the ability for hSK1-eGFP to enable FRET with hIKCa-mKate is again consistent with an extremely close association between hSK1 and hIKCa channel subunits expected for heteromeric channel formation.
The presence of functional heteromeric channels was demonstrated using pharmacological inhibition of expressed channel current. The presented data showed that coexpression of hSK1 and hIKCa channel subunits produced current that exhibited a pharmacological profile different from that observed with expressed homomeric channel current. A prominent difference between heteromeric hSK1-hIKCa channel current and homomeric hIKCa channel current is the sensitivity to inhibition by TRAM-34. Concentration-inhibition relationships showed that heteromeric current is more than 10-fold less sensitive to the organic inhibitor, and that the maximum inhibition is significantly reduced (Fig. 6C). Importantly, application of apamin to current remaining in TRAM-34 was without effect (data not shown). These data suggest that there was not a detectable population of homomeric hSK1 channels that could be identified by pharmacology, and that hSK1 subunits prefer to combine with hIKCa subunits to form heteromeric channels. Similarly, the reduced maximum inhibition observed with TRAM-34 inhibition of heteromeric channels indicates that there was not a detectable population of homomeric hIKCa channels, and again suggests that this subunit prefers to form functional heteromeric channels.
It is clear that formation of heteromeric channels between SK1 and IKCa subunits changes sensitivity to one of the most specific blockers of IKCa channel current. TRAM-34 is a triarylmethane drug developed through modification of clotrimazole that typically exhibits an IC50 of around 25 nM (Fig. 6C) (Wulff et al., 2000, 2007; Jenkins et al., 2013). Pharmacological tests suggest a working concentration of up to 1 µM TRAM-34 can be applied in most tissues without significant secondary block of other channels (Jenkins et al., 2013). While IKCa channel expression has been widely reported in cells of the immune system and peripheral enteric neurons (Neylon et al., 2004; Wulff et al., 2007), the expression and role for these channels in central neurons have only recently come to light (Engbers et al., 2012; Turner et al., 2015, 2016). The apparent sensitivity to TRAM-34 can also differ between neuronal cell types, with the parallel fiber-evoked afterhyperpolarization in cerebellar Purkinje cells blocked by 100 nM TRAM-34 (Engbers et al., 2012), while reduction of the slow afterhyperpolarization in hippocampal pyramidal cells required 5 µM TRAM-34 (King et al., 2015; Sahu et al., 2017; Tiwari et al., 2018). It is possible that these differences reflect channel subunit expression or stoichiometry.
Inhibition of SK channel current by apamin displays positive cooperativity but only when two subunits that can bind apamin are adjacent to each other in the channel tetramer (Lamy et al., 2010). Apamin is a negative allosteric modulator of SK channels that binds to both the outer turret of the channel and the extracellular loop between transmembrane domains S3 and S4 (Nolting et al., 2007; Lamy et al., 2010; Weatherall et al., 2011) and modulates channel gating through an asparagine residue that is distant from the conducting pore (Lamy et al., 2010). Importantly, the high-affinity binding site for apamin requires that two subunits that can bind the toxin are adjacent in the tetramer because the S3-S4 extracellular loop is donated to the adjacent subunit to allow apamin to bind to both the outer pore turret and the extracellular loop (Weatherall et al., 2011). Coexpression of hSK1 and hIKCa channel subunits produced a heteromeric channel that proved to be insensitive to apamin. These data indicate that the heteromeric channel always forms with either one hSK1 subunit and three hIKCa subunits only or two hSK1 subunits that are not adjacent to each other in the tetramer and alternate with IKCa around the tetramer.
Inhibition of homomeric IKCa channel current by TRAM-34 is disrupted when threonine 250 in the pore loop is mutated to serine and/or valine 275 in transmembrane domain S6 is mutated to alanine, residues that are in equivalent positions in SK3 and SK1 (Wulff et al., 2001). Interaction with T250 might suggest that TRAM-34 is an open-channel blocker, although that has yet to be determined. It has been suggested that the pyrazole ring of TRAM-34 uses the side chains of V275 on each subunit to be orientated for interaction with T250 of one subunit (Brown et al., 2018). This proposal suggests that high sensitivity to block of IKCa channel current by TRAM-34 requires all four IKCa channel subunits. Therefore, it is to be expected that a heteromeric SK1-IKCa channel current will be less sensitive to inhibition by TRAM-34. Finally, the observed reduced maximum inhibition of heteromeric SK1-IKCa channel current by TRAM-34 (Fig. 6C) would be expected with a predicted reduction in binding affinity resulting from the presence of SK1 subunits within the heteromeric tetramer.
The STORM and FRET data and pharmacological profile of coexpressed channel subunits thus suggest that SK1 and IKCa channel subunits prefer to form functional heteromeric channels of fixed stoichiometry and arrangement of subunits within the tetramer. This provides a heteromeric Ca2+-activated K+ channel that displays unique single-channel and pharmacological properties.
Acknowledgments
We gratefully acknowledge J. Forden for technical assistance in cell culture preparations.
Authorship Contributions
Participated in research design: Colarusso, Sheppard, Turner, Marrion.
Conducted experiments: Higham, Sahu, Wazen, Colarusso, Harvey, Goudswaard, Varley.
Contributed new reagents or analytic tools: Colarusso, Sheppard, Turner, Marrion.
Performed data analysis: Sahu, Wazen, Colarusso.
Wrote or contributed to the writing of the manuscript: Sahu, Turner, Marrion.
Footnotes
- Received December 21, 2018.
- Accepted April 27, 2019.
This work was supported by the British Heart Foundation (N.V.M.) and a Canadian Institutes for Health Research Operating Grant (R.W.T.). Postdoctoral support (G.S.) was provided by an Eyes High Fellowship (University of Calgary) and Alberta Innovates–Health Solutions (AI-HS) Fellowship. B.S.J.H. was part supported by the Cystic Fibrosis Trust. R.W.T. is an AI-HS Scientist.
↵
 This article has supplemental material available at molpharm.aspetjournals.org.

Abbreviations
- Ctx
- charybdotoxin
- eGFP
- enhanced green fluorescent protein
- FRET
- fluorescence resonance energy transfer
- GLOX
- glucose oxidase + catalase
- hIKCa
- human IKCa
- hSK1
- human SK1
- IKCa
- intermediate conductance calcium-activated potassium channel
- LAMA
- Localization Microscopy Analyzer
- probability density function
- RT
- room temperature
- SK
- small conductance calcium-activated potassium channel
- STORM
- stochastic optical reconstruction microscopy
- TIRF
- total internal reflection fluorescence
- TRAM-34
- 1-[(2-chlorophenyl)diphenylmethyl]-1H-pyrazole
- UCL1684
- 6,12,19,20,25,26-hexahydro-5,27:13,18:21,24-trietheno-11,7-metheno-7H-dibenzo [b,n] [1,5,12,16]tetraazacyclotricosine-5,13-diium dibromide
- Copyright © 2019 by The American Society for Pharmacology and Experimental Therapeutics


