


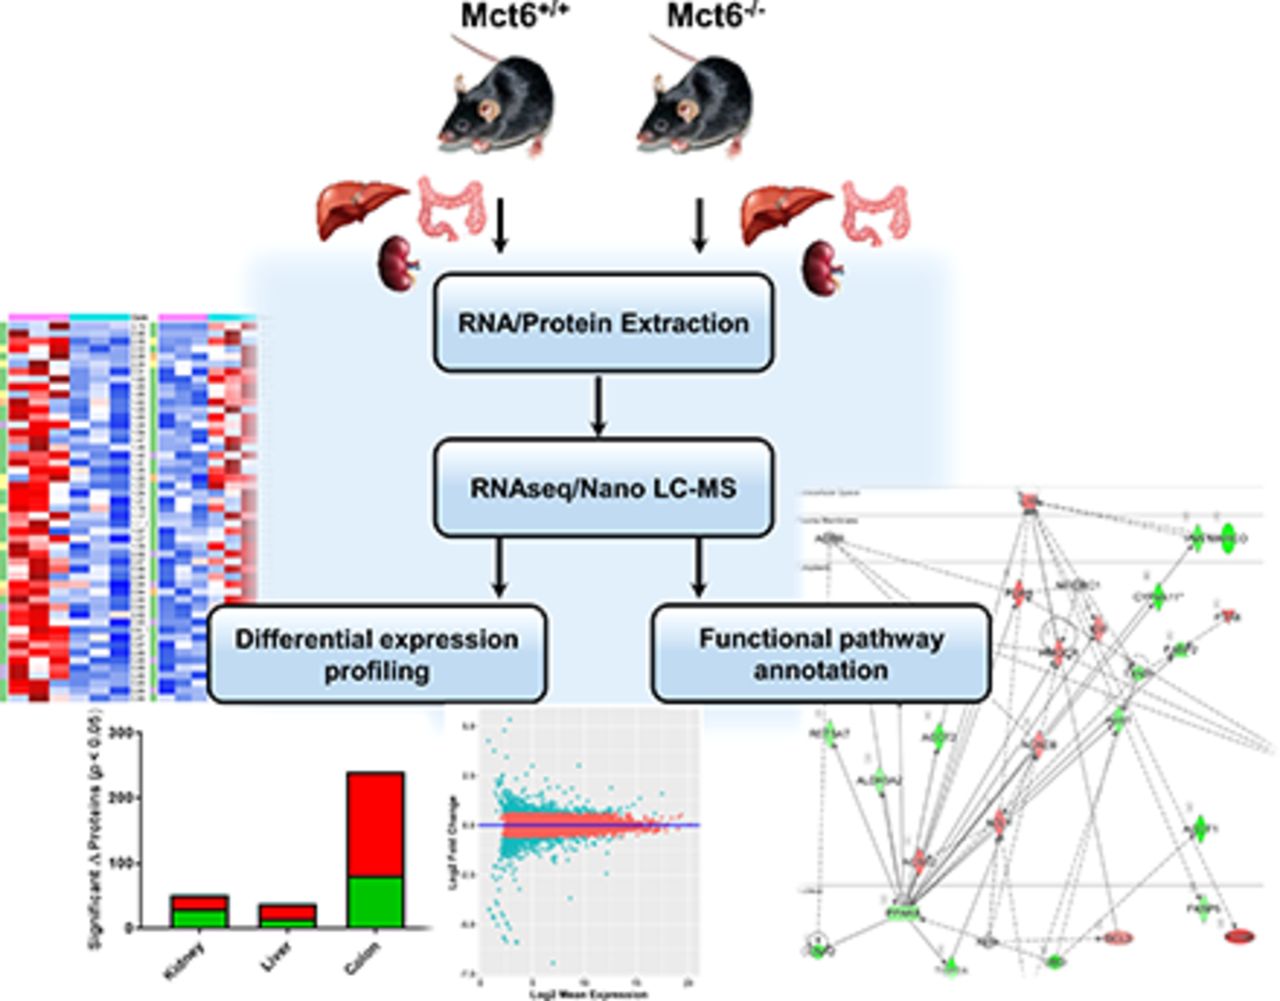
Visual Overview
Abstract
Monocarboxylate transporter 6 [(MCT6), SLC16A5] is an orphan transporter with no known endogenous substrates or physiological role. Previous in vitro and in vivo experiments investigated MCT6 substrate/inhibitor specificity in Xenopus laevis oocytes; however, these data remain limited. Transcriptomic changes in the livers of mice undergoing different dieting schemes have suggested that Mct6 plays a role in glucose and lipid metabolism. The objectives of this study were 1) to develop a novel knockout (KO) mouse model (Mct6−/−) using CRISPR/Cas9 technology, 2) to characterize the KO animal model by examining physiological and biochemical parameters, and 3) to understand the physiological role of MCT6 in vivo through global proteomic and liver transcriptomic profiling. mRNA tissue analysis demonstrated knockout of Mct6, which showed greater than 90% knockdown of Mct6 (Slc16a5) gene expression in all major tissues analyzed when normalized to Mct6+/+ mice. Proteomic analyses identified greater than 4000 unique proteins in kidney, liver, and colon tissues, among which 51, 38, and 241 proteins were significantly altered, respectively (for each tissue), between Mct6+/+ and Mct6−/− mice. Additionally, Mct6−/− mice demonstrated significant changes in 199 genes in the liver compared with Mct6+/+ mice. In silico biological pathway analyses revealed significant changes in proteins and genes involved in glucose and lipid metabolism–associated pathways. This study is the first to provide evidence for an association of Mct6 in the regulation of glucose and lipid metabolism.
SIGNIFICANCE STATEMENT This paper focuses on elucidating the innate biological role of an orphan transporter in vivo, which has not been investigated thus far. Using efficient and high-throughput technologies, such as CRISPR/Cas9 gene editing, liquid chromatography–tandem mass spectrometry-based proteomic and RNA-sequencing transcriptomic analyses, our laboratory provides the first existence and characterization of a Mct6 knockout mouse model. The evidence gathered in this paper, as well as other laboratories, support the importance of MCT6 in regulating a variety of glucose and lipid metabolic pathways, which may indicate its significance in metabolic diseases.
Introduction
The monocarboxylate transporter [(MCT), SLC16] family of transporters consists of 14 isoforms, with MCTs 1–4 being extensively characterized (Jones and Morris, 2016). MCTs 1–4 transport essential monocarboxylate anions such as lactate and pyruvate in a proton-dependent manner. Other MCT isoforms do not necessarily transport monocarboxylates, but are essential for the distribution of important endogenous compounds such as thyroid hormone to the brain (MCT8/10) (Friesema et al., 2003; Dumitrescu et al., 2006; Abe et al., 2012) and aromatic amino acids into cells (MCT10) (Halestrap and Meredith, 2004). Recent publications have identified potential clinical roles of MCT1/4 in cancer treatment, MCT8 in hypothyroidism-related Allan-Herndon-Dudley syndrome (Schwartz et al., 2005), MCT11 in diabetes (Rusu et al., 2017), and MCT12 in cataract development (Castorino et al., 2011; Dhayat et al., 2016). However, a substantial number of MCTs have yet to be de-orphanized, and for these MCT transporters their physiological function and potential role in drug targeting or disease remain unknown.
MCT6 (SLC16A5), classified as an orphan transporter protein, is expressed in tissues involved in drug absorption and elimination (Gill et al., 2005; Kohyama et al., 2013). It should be noted that Gill et al. (2005) refer to MCT6 as MCT5 prior to changes in isoform nomenclature. Substantial changes in murine hepatic Slc16a5 gene expression occur in different dieting states, including fasting (Zhang et al., 2011) and fenofibrate-supplemented (Lu et al., 2011) diets.
In the study evaluating the effects of fasting and fed diet on the murine liver transcriptome, Slc16a5 was detected as the sixth most upregulated gene that was induced by 24-hour fasting, with approximately a 5-fold increase in gene expression compared with expression after a normal diet (Zhang et al., 2011). This was also the most upregulated solute carrier protein within this analysis. Treatment of mice with fenofibrate resulted in 3- to 6-fold upregulation of Slc16a5 in murine liver (Lu et al., 2011). These data suggest that Mct6 may play a role in lipid metabolism due to its differential regulation under various diets.
In terms of substrate specificity, our laboratory and others have reported that MCT6 substrates include bumetanide, nateglinide, probenecid, and prostaglandin F2α based on studies with human MCT6-transfected Xenopus laevis oocytes (Murakami et al., 2005). A series of dietary aglycone flavonoids were also shown to be inhibitors of human MCT6-mediated bumetanide transport in X. laevis oocytes (Jones et al., 2017).
The goal of this study was to develop a novel CRISPR/Cas9 knockout (KO) mouse model of Mct6 deficiency and perform comparisons with wild-type (WT) Mct6+/+ mice, including: 1) physiological and biochemical parameters; 2) multitissue, global proteome profiling; and 3) liver transcriptomic analysis. Pathway annotations were generated to better understand the physiological role of MCT6 in vivo.
Materials and Methods
Ethics Statement.
Procedures involving mice were approved by and performed in accordance with the rules and recommendations of the Institutional Animal Care and Use Committee of the University at Buffalo.
Animals.
C56BL/6NCr and CD-1 mice were used for the in vivo studies (Charles River, Wilmington, MA). All mice were housed in cages with a 12-hour light/12-hour dark cycle. Animals were given free access to normal chow (Envigo 2018 Teklad global 18% protein extruded rodent diet) and water ad libitum. Blood was sampled via submandibular puncture. For tissue collection, mice were sacrificed via cardiac puncture and cervical dislocation.
Generation of CRISPR/Cas9 Mct6−/− Mice.
The Mct6−/− mice were generated by Roswell Park Cancer Institute Gene Targeting and Transgenic Shared Resource (Buffalo, NY) and Genome Engineering and iPSC Center, Washington University in St. Louis (St. Louis, MO). Briefly, two short guide RNAs (gRNAs) [(gRNA1 (5′-3′): AGCATCTTGGTCAAACATTT/CGG and gRNA2: CTGTGATCACTCCTGCGGTG/AGG; protospacer adjacent motif sequences are in bold] were generated to target exon 2 in murine Slc16a5 (Gene ID: 217316) (Fig. 1A). The gRNA sequences were verified in an off-target analysis screen prior to development and selected based on off-target profile and distance to the target site using the CRISPR design tool (http://crispr.mit.edu/). A mismatch detection assay for Cas9/gRNA activity was performed in a mouse neuroblastoma cell line (N2a) to verify targeted insertion/deletion mutations via nonhomologous end joining frequency, using CELI nuclease to detect mismatches (data not shown). Cas9 mRNA and gRNAs were injected into the cytoplasm of fertilized C57BL6/NCr embryos harvested the same day of microinjection. After injecting embryos, they were surgically implanted bilaterally into the oviducts of CD-1 pseudo-pregnant females. Approximately 20 to 21 days following implantation, the CD-1 females gave birth. Pups were weaned 21 days after birth, ear-tagged, and tail biopsies were collected. Pups were genotyped via next-generation sequencing to identify founder mice. The results confirmed two mutant strains carrying a high percentage of alleles with frameshift-causing deletions (−65 base pairs: 98.0%; −107 base pairs: 99.9%) (Fig. 1B). These mice were backcrossed three to four generations to WT C57BL/6NCrl mice and subsequent generations were genotyped via next-generation sequencing to confirm mutations, and subsequently real-time polymerase chain reaction (RT-PCR) (Fig. 1C). Mct6−/− and Mct6+/+ mice were littermates in all experiments performed in this study.

Generation of Mct6−/− mice. (A) Exon 2 was targeted in the Slc16a5 gene using CRISPR/Cas9 technology with two short guide RNAs (gRNA 1 and gRNA 2). (B) Next-generation sequencing of the founder pups confirmed two mutant strains carrying a high percentage of alleles with out-of-frame mutations [−65 base pairs (bp): 98.0%; −107 bp: 99.9%; gRNA sites shown underlined in green and mutations in red]. (C) Three percent agarose gel electrophoresis of RT-PCR products of founder progeny demonstrating the presence of two different mutations (−65 bp, −107 bp). Homozygous (HOM): Mct6−/−, Heterozygous (HET): Mct6+/−, WT: Mct6+/+.
Genotyping of Mct6−/− Mice.
Briefly, during weaning, tail biopsies were collected and DNA was isolated using the REDExtract-N-Amp Tissue PCR Kit (Sigma Aldrich, St. Louis, MO), according to the manufacturer’s protocol. For this protocol, primers were designed to flank exon 2 of murine Slc16a5 [Slc16a5.ex2.F (5′-3′): ATCTCTTAAGCCCCCGGCTA, Slc16a5.ex2.R: ATAAGCAGTTCCACCCACCC]. The RT-PCR reactions were carried out using a BioRad CFX Connect RT System and Taq DNA Polymerase (Thermo Fisher Scientific, San Jose, CA). Cycling conditions were chosen based on the suggested manufacturer’s protocol. Each reaction was heated at 94°C for 3 minutes, and 30 cycles were then performed as follows: denaturing at 94°C for 45 seconds, annealing at 60°C for 30 seconds, and extension at 72°C for 1 minute. A final extension was performed by heating at 72°C for 10 minutes. The polymerase chain reaction products were then separated on a 3% agarose gel and imaged using a ChemiDoc XRS+ System (Bio-Rad, Hercules, CA).
Quantitative RT-PCR and mRNA Expression in Mct6−/− and Mct6+/+ Mice.
To validate the knockout in Mct6−/− mice and investigate mRNA expression of WT Mct6+/+ mouse tissues, major organs (i.e., kidney, liver, lungs, brain, colon, ileum, jejunum, and duodenum) were harvested from both groups of male mice at 28–30 weeks of age (N = 3–5). Duodenum was collected as the 5 cm of the small intestine following the pylorus, and the jejunum and ileum were segmented from the residual small intestinal tissue (two- and three-fifths, respectively). Colon was collected as 5 cm of large intestine following the cecum. Tissues were homogenized using a VWR Pellet Mixer and total RNA was isolated and purified using an RNeasy Mini Kit (QIAGEN, Germantown, MD) according to the manufacturer’s protocol. RNA concentration, purity, and stability were confirmed via a NanoDrop 1000 and FlashGel System. First-strand cDNA synthesis was performed using SuperScript III RT (Thermo Fisher Scientific) according to the manufacturer’s protocol. Concentration and purity were further confirmed. For the quantitative RT-PCR analysis, Taqman gene expression assays were used for Slc16a5 (assay identification: Mm01252138; Thermo Fisher Scientific) and the housekeeping genes Gapdh (assay identification: Mm99999915) and Hprt (assay identification: Mm03024075). The Slc16a5 probes spanned exons 2 and 3 of murine Slc16a5. All probes were labeled with fluorescein amidite dye for fluorescent detection. Cycle threshold values were obtained from BioRad CFX Manager 3.0 software and imported into Excel for analysis.
Blood Panel Analysis and Tissue Weights.
Blood samples were collected via the submandibular vein from Mct6+/+ and Mct6−/− male mice (N = 4, 18 to 19 weeks old) in heparinized tubes following an overnight fast with free access to water. Whole blood was analyzed using Prep Profile II reagent rotors via a Vetscan VS2 (Abaxis, Union City, CA) according to the manufacturer’s instructions. Alanine aminotransferase, alkaline phosphatase, glucose, total protein, and blood urea nitrogen were determined in Mct6+/+ and Mct6−/− mice and compared to evaluate overall health and investigate physiological differences. In addition, major tissues (i.e., brain, liver, kidneys, small intestine, and colon) were harvested from Mct6+/+ and Mct6−/− male mice sacrificed at 30 weeks of age (N = 10) and weighed.
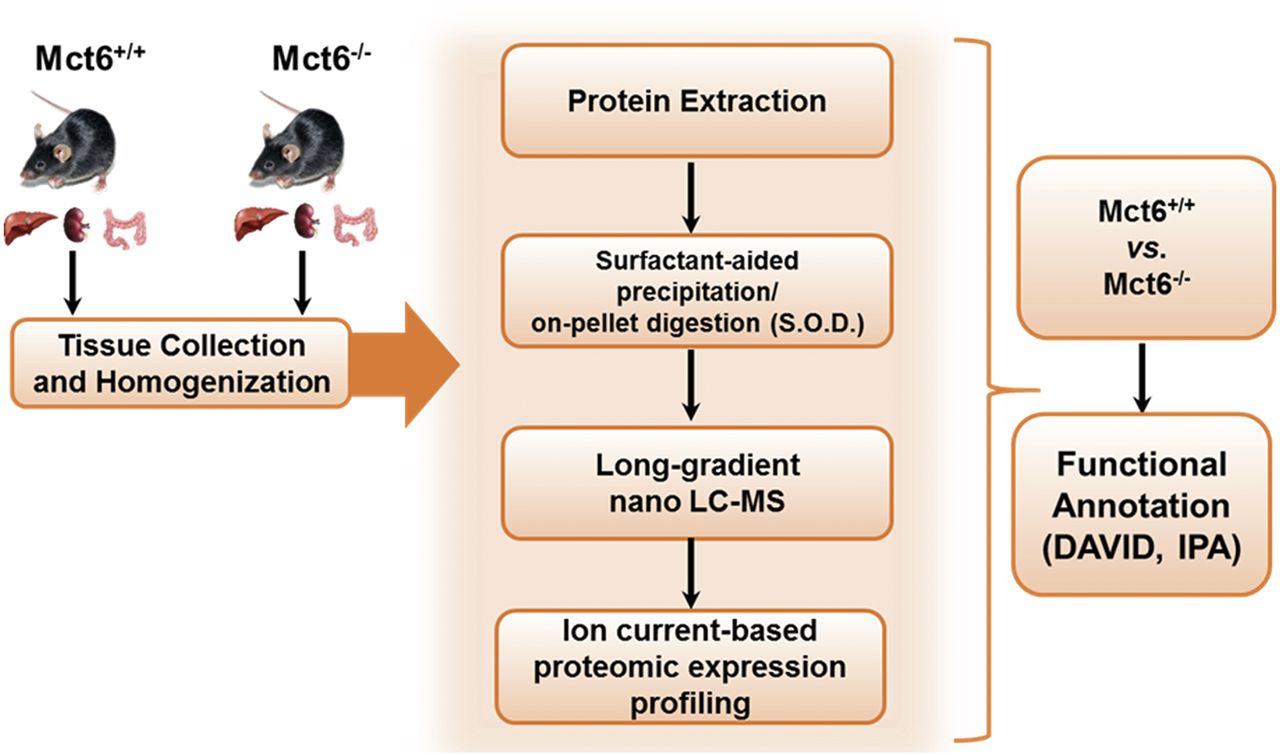
Protein Preparation and Digestion.
Kidney, liver, and colon were isolated from Mct6+/+ and Mct6−/− male mice (N = 5 to 6, 27–33 weeks of age-matched male mice fed normal chow and free access to water) and stored at −80°C until extraction after snap freezing in liquid nitrogen. The protein preparation and digestion were performed as done previously (Ma et al., 2017). Briefly, whole tissues were ground in liquid nitrogen into a fine powder, homogenized in ice-cold lysis buffer (50 mM Tris-formic acid, 150 mM NaCl, 0.5% sodium deoxycholate, 2% SDS, 2% NP40, pH 8.0) with protease inhibitor tablets (Roche Applied Science, Indianapolis, IN), and sonicated until clear. Each lysate was centrifuged at 20,000g for 30 minutes at 4°C, and the supernatant was collected. Total protein concentration was measured using a bicinchoninic acid assay kit (Pierce Biotechnology, Inc., Rockford, IL). One hundred micrograms of extracted proteins from each sample were used for liquid chromatography (LC)–tandem mass spectrometry (MS) analysis. Reduction and alkylation of proteins were achieved by 30-minute incubation with 3 mM tris (2-caboxyl) phosphine and 30-minute incubation with 20 mM iodoacetamide. After reduction and alkylation, the surfactant-aided/on-pellet digestion method (An et al., 2015) was employed to remove detergents and perform tryptic digestion of proteins.
Long Gradient Nano-Reverse-Phase Liquid Chromatography/Mass Spectrometry.
An UltiMate 3000 RSLCnano system and an Orbitrap Fusion Lumos mass spectrophotometer (Thermo Fisher Scientific) were used. The mobile phase A contained 2% acetonitrile in 0.1% formic acid and mobile phase B contained 88% acetonitrile in 0.1% formic acid. Four microliters of digested mixtures were loaded onto a large i.d. trap (300 µm i.d. × 0.5 cm, packed with Zorbax 3-µm C18 material) with 1% mobile B at a flow rate of 10 µl/min for 3 minutes. The trapped peptides were then backflushed onto the nano-LC column (75 µm i.d. × 60 cm, packed with Waters XSelect CSH 2.5 µm C18 material) at a flow rate of 250 nl/min. The nano-LC column was heated at 52°C. A 180-minute gradient was used and the optimized gradient profile was as follows: 4% B over 3 minutes; 4%–11% B over 5 minutes; 11%–28% B over 117 minutes; 28%–50% B over 10 minutes; 50%–97% B over 1 minute and isocratic for 17 minutes; and finally isocratic at 4% B for 27 minutes. MS was performed in positive ion mode and MS data were generated under data-dependent product ion scan mode with a cycle time of 3 seconds. A survey scan (mass-to-charge ratio of 400–1500) at a resolution of 120,000 with an automatic gain control target of 5 × 10⁵ and a maximum injection time of 50 milliseconds was applied. Tandem MS was acquired by isolation at 1.2 Th with the quadrupole for high-energy collision dissociation fragmentation and detected by Orbitrap at a resolution of 15,000 with an automatic gain control target of 5 × 10⁴. The maximum injection time of 50 milliseconds and the normalized activation energy of 30% with 5% of stepped collision energy were used. The activation q value was 0.25. Dynamic exclusion was enabled with a repeat count of one and exclusion duration of 45 seconds. Biological replicates from each group were analyzed in a random manner.
Protein Identification and Ion Current–Based Quantification.
The MS raw files were searched against the UniProt-Swissprot Mus musculus protein database (released on September 2017) with a total of 16,900 protein entries using Proteome Discoverer version 1.4 (Thermo Fisher Scientific). Tolerance of 10 parts per million for precursor ion mass, 0.02 Da for fragment ion mass with fully tryptic peptides restraint, and a maximum of two missed cleavages were allowed. Static carbamidomethylation of cysteine and dynamic oxidation of methionine were applied. The false discovery rate was detected by using a target-decoy search strategy. Scaffold 4.5 (Proteome Software, Portland, OR) was used to validate MS/MS-based peptide and protein identification. The false discovery rates of 0.1% at the peptide level and 1% at the protein level were used. An ion current–based quantification method (IonStar processing pipeline) was described previously (Shen et al., 2018; Wang et al., 2018). The maximum retention time shift for the alignment step was 0.2 minutes. The quantitative frames were determined based on the mass-to-charge ratio (width: 10 ppm) and retention time (width: 2.5 minutes). Peptides or frames shared among different protein groups were excluded from quantitative analysis. The ion current intensities of each protein were normalized by the locally estimated scatterplot smoothing method (Dunn et al., 2011). Intensities for peptides of the same protein were combined to be the protein intensity with the Grubbs’ test (a minimum data set presence of 2 and P value cutoff of 0.01). The relative expression ratio was calculated by the average ion-current intensities of six replicates in each group. Student’s t test was used to evaluate statistical significance between groups. A value of P < 0.05 and a minimum of 1.3-fold change were used to determine the significantly altered proteins.
Liver RNA Extraction, RNA-Seq Library Preparation, and Sequencing.
Total and small RNAs were isolated using the RNeasy Mini Kit (QIAGEN). Briefly, 50 mg of frozen tissue (N = 3 male mice/group) was first disrupted with a liquid nitrogen–cooled mortar and pestle. After disruption, the tissues were immediately homogenized with the addition of 700 μl of QIAzol Lysis Reagent (QIAGEN). Further homogenization was accomplished by centrifuging homogenates with a QIAshredder column (QIAGEN). After addition of chloroform, the homogenates were then separated into aqueous and organic phases by centrifugation. The upper, aqueous phases were extracted, and ethanol was added to provide appropriate binding conditions for all RNA molecules from 18 nucleotides upward. The samples were then applied to the RNeasy Mini spin column. On-column DNase digestion was also performed to remove any residual genomic DNA contamination followed by additional washes. High-quality RNA samples were eluted in 60 μl of RNase-free water. Quantitative assessment of the purified total RNA was accomplished by using a Qubit Broad Range RNA Kit (Thermo Fisher Scientific). The RNA samples were further evaluated qualitatively by a 2100 Bioanalyzer (Agilent Technologies).
The sequencing libraries were prepared with the mRNA HyperPrep Kit (KAPA BIOSYSTEMS), from 500 ng total RNA according to the manufacturer’s instructions. Fragmented RNA was reverse transcribed into first strand cDNA using random primers. Pure Beads (KAPA BIOSYSTEMS) were used to separate the double stranded cDNA from the second strand reaction mix, resulting in blunt-ended cDNA. A single A nucleotide was then added to the 3′ ends of the blunt fragments. Multiple indexing adapters, containing a single T nucleotide on the 3′ end of the adapter, were ligated to the ends of the double stranded cDNA, preparing them for hybridization onto a flow cell. Adapter ligated libraries were amplified by polymerase chain reaction, purified using Pure Beads, and validated for appropriate size on a 4200 TapeStation D1000 Screentape (Agilent Technologies, Inc.). The DNA libraries were quantified using the KAPA Biosystems qPCR Kit and pooled together in an equimolar fashion following experimental design criteria. Each DNA pool was denatured and diluted to the 2.4 pM 1% PhiX Control Library. The resulting pools were then loaded into the appropriate NextSeq Reagent cartridge for 75-cycle paired-end sequencing, and then sequenced on a NextSeq500 following the manufacturer’s recommended protocol (Illumina Inc.).
RNA-Seq Analysis.
Raw reads that passed the quality filter from Illumina Real-Time Analysis were preprocessed by using FASTQC (version 0.10.1) for sequencing base quality control. The reads were mapped to the latest murine reference genome and ENSEMBL annotation database using Tophat (version 2.0.13) (Trapnell et al., 2009). A second round of quality control using RSeQC (Wang et al., 2012) was applied to mapped binary alignment map files to identify potential RNASeq library preparation problems. From the mapping results, the read counts for genes were obtained by HTSeq (Anders et al., 2015) using the intersection-strict option. Sample relationships were explored by sample clustering, principal component analysis, and t-distributed stochastic neighbor embedding. Differentially expressed genes were identified using DESeq2 (Love et al., 2014), a variance-analysis package developed to infer the statically significant differences in RNA-seq data. A value of P < 0.05 and a minimum of 1.5-fold change were used to determine the significantly altered genes.
Bioinformatics and Pathway Analysis.
DAVID was used for characterization of biological pathway and functional annotations for the omics data (the Database for Annotation, Visualization and Integrated Discovery; https://david.ncifcrf.gov/) (Huang et al., 2009a,b). Investigation into canonical pathways and network interactions were performed in Ingenuity Pathway Analysis [(IPA); QIAGEN, Redwood City, CA, https://www.qiagenbioinformatics.com/ipa]. Additional pathway analyses for the transcriptomic data were performed by gene set enrichment analysis using rank-based gene lists from the differential expression analysis.
Triglyceride Assay.
Total plasma triglycerides (TGs) were measured in ad libitum fed age-matched Mct6+/+ and Mct6−/− male mice (N = 8/group, 30 weeks old) using a Triglyceride Colorimetric Assay Kit (Cayman Chemical, Ann Arbor, MI) according to the manufacturer’s instructions. Blood was collected from the submandibular vein into heparinized tubes on the same day and stored at −80°C until analysis.
Statistical Analysis.
For mRNA expression, data were analyzed in Microsoft Excel using the 2−ΔΔCt method (Livak and Schmittgen, 2001). For the Mct6+/+ and Mct6−/− mRNA comparison, data were normalized to mRNA expression in Mct6+/+ mice and expressed as fold change for each tissue. For mRNA tissue comparison among Mct6+/+ mice, data were normalized to kidney tissue and expressed as fold change. All other statistical analyses were performed using one-way unpaired ANOVA followed by Tukey’s post hoc test to test for multiple comparisons or an unpaired Student’s t test. Differences were considered statistically significant when P < 0.05. For pathway analysis, a modified Fisher’s exact test was used to verify significance of enrichment. The Z scores were used as a statistical measure of the match between an expected relationship direction (i.e., activation or inhibition) and the observed differential expression (−2 ≥ Z is considered to be significantly inhibited and Z ≥ 2 is considered to be significantly activated).
Results
Comparative Gene Expression of Mct6 in Mct6−/− and Mct6+/+ Mice.
To verify the relative absence of Mct6 gene expression in our KO mouse model as well as characterize the relative tissue-specific gene expression in WT Mct6+/+ mice, quantitative RT-PCR analyses were performed using a TaqMan gene expression assay. Figure 2A shows greater than 90% knockdown of Mct6 (Slc16a5) gene expression in all major tissues analyzed when normalized to WT (Mct6+/+) mice. No gene expression was detected in the lungs, brain, or duodenum. The greatest gene expression relative to other tissues was observed in the colon, compared with the kidney and liver, in WT mice (Fig. 2B) using two different housekeeping genes (Gapdh and Hprt). This result is consistent with previously reported gene expression in C57BL/6 mice (Expression Atlas; https://www.ebi.ac.uk/gxa).

mRNA expression of Slc16a5 (Mct6). All gene expression data were normalized to a housekeeping gene (Gapdh or Hprt). Data were plotted as mean fold change (F.C.) ± S.E.M. (N = 3–5 male mice, 30 weeks of age). N.D., not detected. (A) Mct6−/− Slc16a5 expression normalized to Mct6+/+ Slc16a5 expression in each tissue. (B) Slc16a5 expression in Mct6+/+ mice normalized to kidney tissue (**P < 0.01; ***P < 0.001, ANOVA with Tukey’s test for multiple comparisons compared with kidney and liver tissues).
Phenotypic Characterization of Mct6−/− Mice.
Following the generation of the Mct6−/− mouse model, a blood panel analysis of biomarkers for liver and kidney function, as well as overall health, was performed. Mct6+/+ and Mct6−/− mice do not demonstrate any significant differences in common blood panel biomarkers, including alanine aminotransferase, alkaline phosphatase, glucose, total protein, and blood urea nitrogen, when measured at 18 to 19 weeks of age (data not shown). Over a period of 3–30 weeks of age, the two groups of mice did not demonstrate any significant differences in body weight.
At 30 weeks of age, mice were sacrificed from the two groups and major organs were collected and weighed to investigate if there were any organ size differences between the two strains. There were no statistical differences between the two groups, and in addition no aberrant tissue morphologies were seen upon visual examination during necropsy (data not shown). Due to these findings, Mct6−/− mice appeared to be healthy, with growth, physiological development, and biochemistry similar to the Mct6+/+ mice.
Proteomic Profiling of Organs in Mct6−/− and Mct6+/+ Mice.
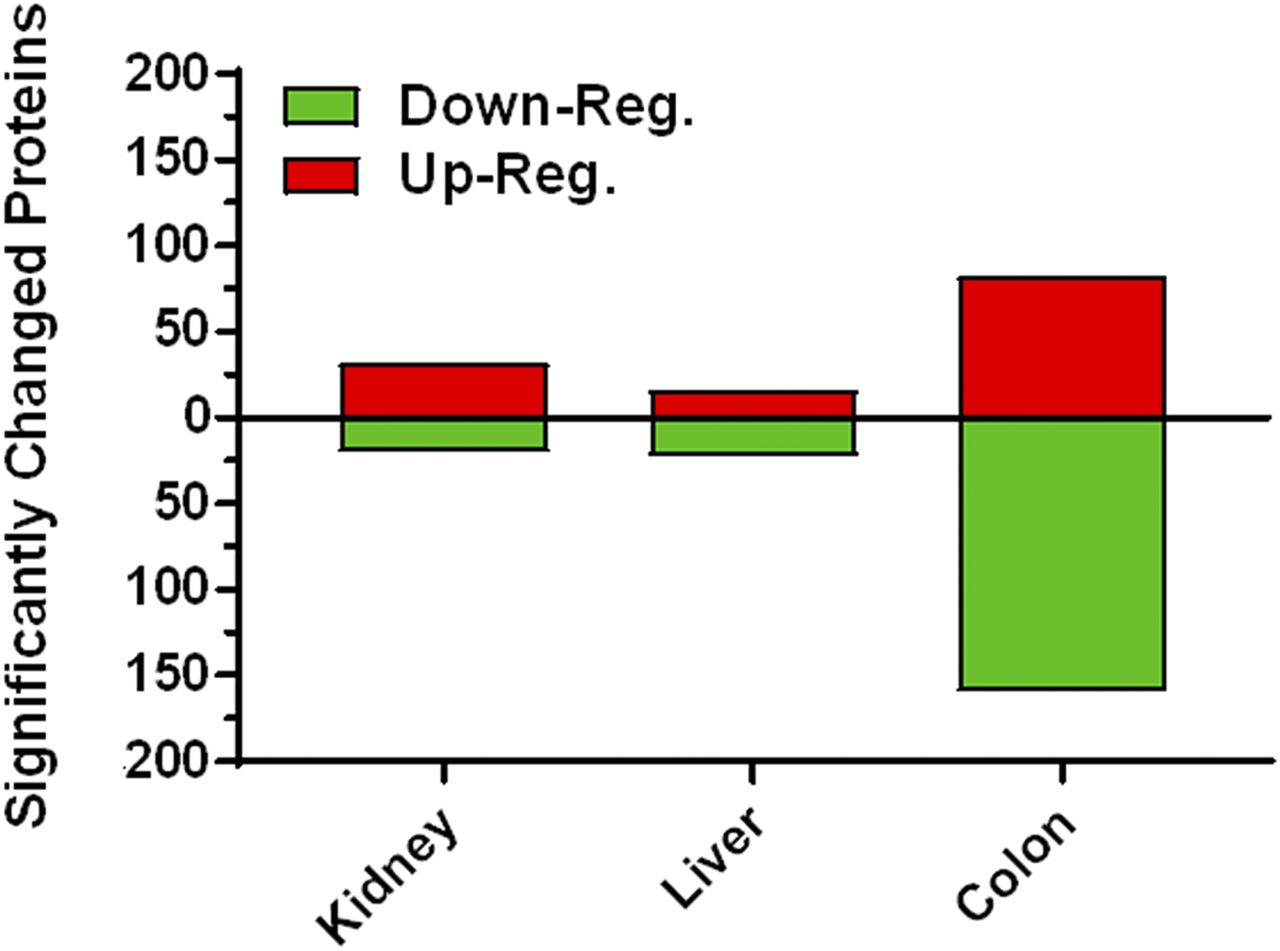
Multitissue proteome profiling in Mct6−/− and Mct6+/+ mice was performed with good precision utilizing a stringent set of criteria. As shown in Fig. 3, a summary of the scheme depicts the overall paradigm of this method from sample collection and preparation to functional annotation. Using this exhaustive sample preparation and treatment procedure, over 4000 unique proteins were identified for each tissue, which was comprised of a mixture of proteins derived from multiple subcellular compartments. A stringent set of significance criteria was used to test for differences between Mct6+/+ and Mct6−/− mice (≥1.3-fold change, P < 0.05). A summary is provided in Fig. 4. For kidney, 4417 unique proteins were identified with 31 significantly upregulated and 20 downregulated. For the liver, 4124 unique proteins were identified with 16 significantly upregulated and 22 downregulated. For the colon, 4483 unique proteins were detected with 82 significantly upregulated and 159 downregulated. Using highly stringent false discovery rates (0.1% at the peptide level and 1% at the protein level) and strict criteria for peptide discovery (minimum of two peptides and a P value cutoff of 0.01), the comparative proteomic profiles between the two groups of mice were characterized with good confidence. Tables 1, 2, and 3 depict the most significantly altered proteins in kidney, liver, and colon tissues, respectively.

Comparative proteomics scheme used for the kidney, liver, and colon tissue analyses in Mct6+/+ and Mct6−/− male mice. An exhaustive ion current–based LC-MS/MS quantification was used for each tissue for each group (N = 5 to 6 biological replicates). DAVID and IPA were used as in silico tools to functionally annotate the significant proteins [figure adapted from Ma et al. (2017)].
A summary of the significantly altered proteins in Mct6−/− male mice compared with Mct6+/+ male mice (≥1.3-fold change, P < 0.05).
Top 20 significantly up- or downregulated proteins in Mct6−/− and Mct6+/+ mice in kidney
Top 20 significantly up- or downregulated proteins in Mct6−/− and Mct6+/+ mice in liver
Top 20 significantly up- or downregulated proteins in Mct6−/− and Mct6+/+ mice in colon
Bioinformatics and Pathway Characterization of Proteins.
Gene ontology (GO) analysis of biological processes and molecular functions was performed for the significantly altered proteins in kidney, liver, and colon tissues using the DAVID (version 6.8) bioinformatics tool. For all three tissues, the majority of proteins were involved in a wide range of metabolic pathways significantly altered in the Mct6−/− mice compared with the Mct6+/+ mice (P < 0.05). Considering metabolism was the most abundant and relevant biological pathway associated with the significantly altered proteins in each tissue, all metabolic biological pathways were compared across all tissues. For tissues such as kidney and colon, GO biological pathway analysis revealed that a majority of the proteins significantly altered between the Mct6+/+ and Mct6−/− mice were associated with metabolic processes [66.7% (P = 0.047) and 60.8% (P = 0.038), respectively, for kidney and colon]. While this GO term was not significant in the liver (possibly due to minimal significant differences in protein expressions in this tissue), the most significantly altered GO biological pathway for this sample, as well as the most abundant, was cellular lipid metabolic processes (15.8%, P = 0.027). With regard to cellular localization, across all three organs, GO analysis revealed that the most significant and abundant localizations of the altered proteins were in membrane-bounded organelles (kidney: 88.2%, P = 3.5 × 10⁻⁶; liver: 76.3%, P = 4.4 × 10⁻³; colon: 80.0%, P = 1.8 × 10⁻¹⁴).
Proteomic Canonical Pathway Analysis and Network Association in Organs.
Using the Ingenuity Knowledge Base in IPA, the top five canonical pathways were identified using our significantly altered protein data sets for each tissue (Table 4). Pathway information was gathered through Ingenuity Target Explorer (https://targetexplorer.ingenuity.com). For the kidney, the top five pathways identified were majorly involved in immunomodulatory effects such as NF-κB activation, as well as regulation of immune response via a variety of signaling networks. For the liver, the most significant pathway was involved in cell-to-cell adhesion; however, a variety of metabolic pathways were also significantly associated with our data set. Interestingly, α-tocopherol degradation, a process involved in metabolizing plant-based vitamin E antioxidants via breakdown pathways such as dehydrogenation and β-oxidation pathways, was the second most significant pathway associated with our hepatic proteomic data set. Glucose, lipid, and sterol metabolic and biosynthetic pathways were also significantly associated with our differential expression data.
Top five canonical pathways significantly enriched with the differential protein expression data between the Mct6−/− and Mct6+/+ mice
Of the three tissues analyzed in this study, the colon appeared to exhibit the most significantly changed proteins in the Mct6−/− mice compared with the Mct6+/+ mice [colon (241) > kidney (51) > liver (38)]. This is an interesting finding considering that intestinal tissue has been one of the primary tissues studied for MCT isoform expression due to its importance in drug absorption and fatty acid transport (Gill et al., 2005; Iwanaga et al., 2006; Kirat and Kato, 2006; Kirat et al., 2006a,b, 2007; Welter and Claus, 2008; Kohyama et al., 2013; Kirat and Miyasho, 2015). In addition, it is important to note that in our study the colon had the greatest WT gene expression relative to the other tissues analyzed. The most significant canonical pathway associated with our differential colon proteomic data set was clathrin-mediated endocytosis signaling (P = 7.49 × 10⁻⁴), a prominent pathway in the intestine for the absorption of nutrients, hormones, and a wide variety of other signaling molecules from the extracellular space. Interestingly, triacylglycerol biosynthesis was also significantly associated with the colon proteomic data set (P = 1.61 × 10⁻²), a major pathway involved in the regulation of hormone and lipid homeostasis, as well as energy metabolism.
Hepatic Transcriptomic Profiling in Mct6−/− and Mct6+/+ Mice.
Genes were considered significantly differentially expressed between the two groups of mice if there was a ≥1.5-fold change and P < 0.05. In total, 14,117 genes were detected in this assay, with 109 genes significantly upregulated and 90 genes significantly downregulated (a total of 199 significantly differentially expressed genes) (Supplemental Figs. 1 and 2 show the top 50 up- and downregulated genes, respectively). For all six samples, there were 46–50 million mapped reads, which accounted for 94%–96% of the input reads. A summary of the percentage of tags assigned to the main genomic features is given in Fig. 5A. Figure 5B shows the top 15 up- and downregulated significant genes in the Mct6−/− mice compared with the Mct6+/+ mice, the most differentially expressed being Slc16a5 encoding for Mct6 (log2 fold change: −6.96, P = 2.37 × 10⁻¹⁰). Of the top 15 downregulated genes by abundance, the top three most significant genes were Tnfsf8 (log2 fold change: −4.60, P = 0.0113), Acod1 (log2 fold change: −2.21, P = 2.90 × 10⁻³), and Marco (log2 fold change: −1.76, P = 1.67 × 10⁻³). Tnfsf8 encodes for the CD30 ligand in immune cells, and may regulate and be regulated by lipid levels in atherosclerosis (Foks et al., 2012; Getz and Reardon, 2014). Also, Acod1 encodes for aconitate decarboxylase 1 and generates itaconate, a compound shown to play a role in antimicrobial activity of immune cells and indirect moderation of the tricarboxylate acid cycle (Luan and Medzhitov, 2016). Finally, Marco encodes for a macrophage scavenger receptor that has been shown to be induced in nonalcoholic steatohepatitis, suggesting its role in high-fat diet–induced hepatic pathogenesis (Yoshimatsu et al., 2004). The downregulation of these genes suggests that Mct6−/− may exhibit some immunosuppressive effects.

(A) Percentage of reads and tag distribution for each genomic feature for each sample [Mct6+/+ and Mct6−/− biological replicates (1)–(3)]. (B) The top 15 significantly upregulated (red) and downregulated (green) genes (P < 0.05) in Mct6−/− male mice compared with Mct6+/+ male mice. The dashed lined represents the cutoff [fold change (F.C.) ≥ 1.5].
The most upregulated gene was Acta1 (log2 fold change: 3.75, P = 0.0487), a gene that encodes α-actin, a key determinant of cellular contraction. However, there was large variability surrounding this gene among samples. The most significant upregulated gene, in our top 15 upregulated data set by abundance, was Nr4a3 (log2 fold change: 2.56, P = 1.51 × 10⁻⁶) (Fig. 5B), which encodes for nuclear receptor 4a3. Increased expression of Nr4a3 is correlated with glucose utilization, and Nr4a3 is important in metabolic pathways and different dieting states (Safe et al., 2016). The second most significantly upregulated gene was Atf3 (log2 fold change: 1.86, P = 1.11 × 10⁻⁵), encoding for a member of the activating transcription factor/cAMP-responsive element-binding protein family of transcription factors. When Atf3 is stress induced in the liver, it can cause defects in glucose homeostasis by downregulating gluconeogenesis (Allen-Jennings et al., 2002). The third most significantly (by P value) downregulated gene in the top 15 was Slc15a2 (log2 fold change: 1.65, P = 2.18 × 10⁻⁴), which encodes for Pept2, a proton-dependent peptide transporter most commonly known for its importance in kidney amino acid availability (Rubio-Aliaga et al., 2003). The relevance of downregulation of this transporter in Mct6−/− mouse phenotypes is unknown.
Bioinformatics and Pathway Characterization of Genes in Liver.
GO analyses of biological processes and molecular functions were characterized for the significantly altered differential gene data set in livers of Mct6+/+ and Mct6−/− mice. Similar to the proteomic data sets, DAVID was used to perform a GO analysis of all biological processes and functions involved in the liver differential transcriptomic data set. As with the other analyses, a large number of genes that were significantly differentially expressed between the two groups were associated with a variety of metabolic pathways. As in the liver proteomic data, the most significantly altered GO biologic pathway for this tissue was lipid metabolic processes (22.1%, P = 2.84 × 10⁻¹⁰). With regard to cellular localization, across all three tissues GO analysis revealed that the most significant localization of the proteins encoded by the differentially expressed genes were in peroxisomes (5.2%, P = 3.3 × 10⁻⁴). Considering peroxisomes are a major site of fatty acid β-oxidation and lipid metabolism, this result was not surprising based on our previous results exhibiting changes in lipid metabolism biological pathways.
Transcriptomic Canonical Pathway Analysis and Network Association in Liver.
Similar to the proteomic data analyses, IPA was used to identify the top five canonical pathways using the significantly differentially expressed genes in the liver (Table 5). The top five pathways identified were primarily involved in cholesterol biosynthesis, such as the superpathway of cholesterol biosynthesis, as well as upstream regulatory pathways involved in cholesterol, terpene/terpenoid, and sterol synthesis. In addition, the majority of the pathways identified were predicted to be activated in our analysis. Interestingly, mevalonate pathway I was both one of the top five canonical pathways in the proteomic data set as well as the transcriptomic data set. As in the proteomic data, the canonical pathways involved in sterol metabolic and biosynthetic pathways were also shown in our transcriptomic analysis. However, due to the richer transcriptomic data set compared with our liver proteomic data set, we were able to predict whether these pathways were significantly activated or inhibited.
Top five canonical pathways significantly enhanced, based on the differential transcriptomic data between the Mct6−/− and Mct6+/+ mice
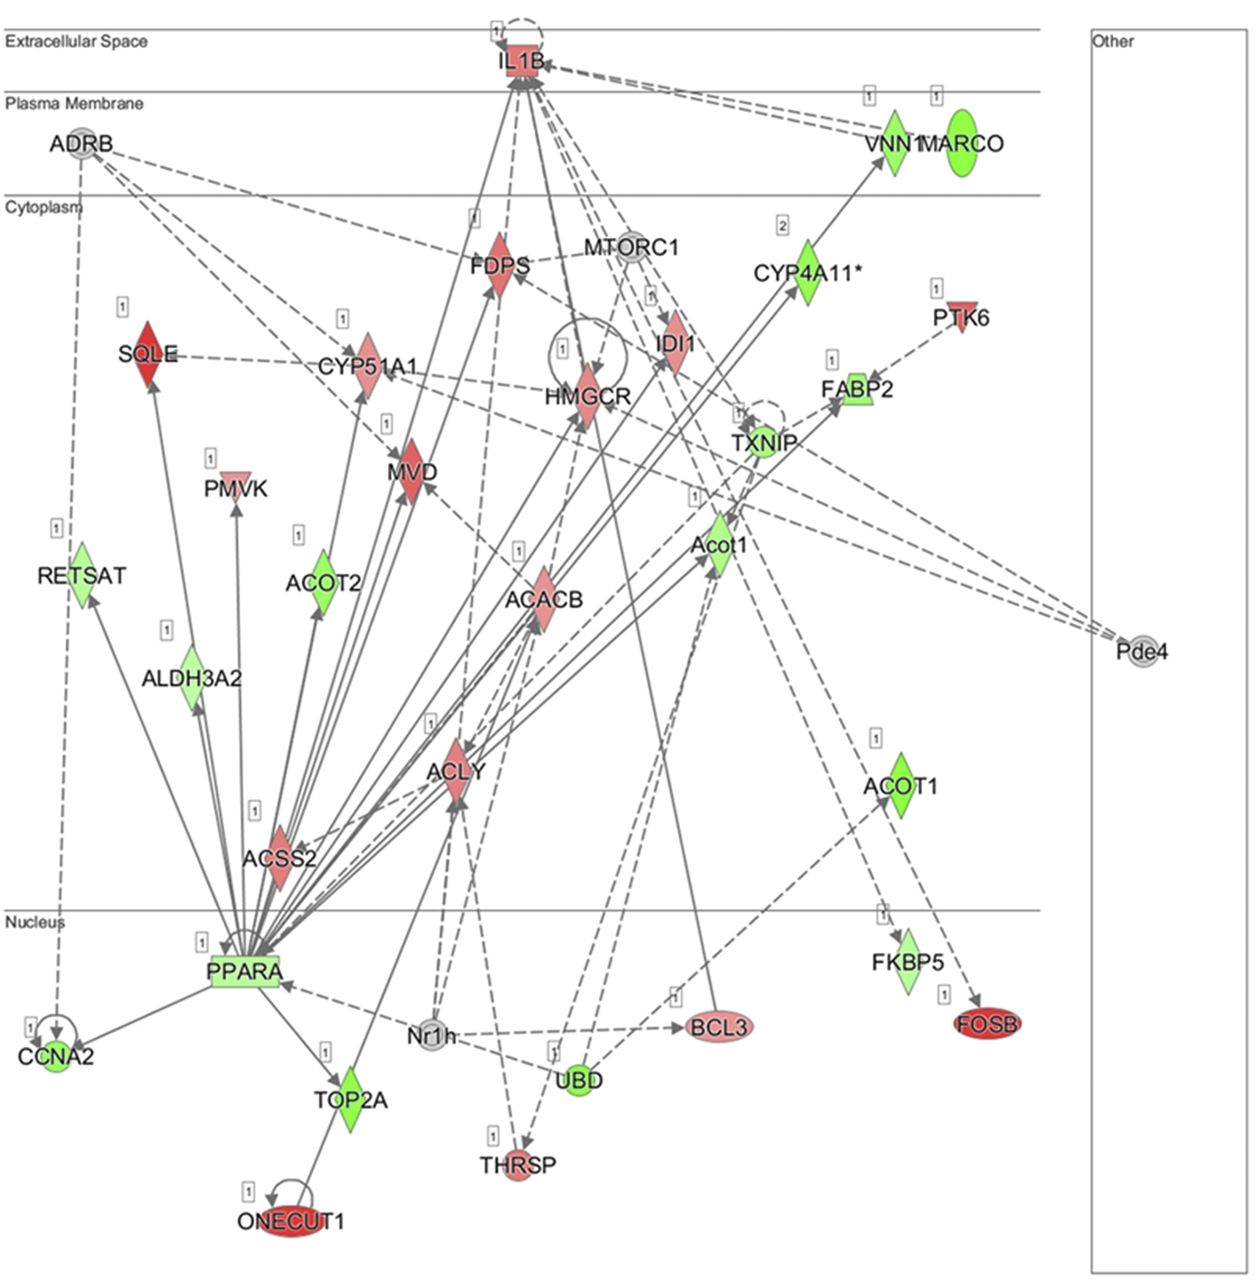
Additionally, using IPA, the principal network generated using the differential data set was lipid metabolism, small molecule biochemistry, and vitamin and mineral metabolism (Fig. 6). It is evident from the network that there is a wide range of interconnected genes involved in the regulation of lipid metabolism. In particular, Pparα is a key transcriptional regulator in this network and contributes to a majority of the mechanisms involved in hepatic lipid homeostasis.

Subcellular network depiction of the most significant putative biological process in the Mct6−/− male mice compared with the Mct6+/+ male mice: lipid metabolism, small molecule biochemistry, and vitamin and mineral metabolism. Genes upregulated or downregulated in Mct6−/− mice are represented in red or green, respectively (ACACB, acetyl-CoA carboxylase 2; ACLY, ATP-citrate synthase; ACOT1, acyl-coenzyme A thioesterase 1; ACOT2, acyl-coenzyme A thioesterase 2; ACSS2, acetyl-coenzyme A synthetase; ADRB, adrenergic receptor beta; ALDH3A2, fatty aldehyde dehydrogenase 3A2; BCL3, B-cell lymphoma 3 protein homolog; CCNA2, cyclin-A2; CYP4A11, cytochrome P450 4A11; CYP51A1, cytochrome P450 4A11; FABP2, fatty acid-binding protein 2; FDPS, farnesyl pyrophosphate synthase; FKBP5, peptidyl-prolyl cis-trans isomerase FKBP5; FOSB, protein fosB; HMGCR, 3-hydroxy-3-methylglutaryl-coenzyme A reductase; IDI1, isopentenyl-diphosphate delta-isomerase 1; IL1B, interleukin-1 beta; MARCO, macrophage receptor MARCO; MVD, diphosphomevalonate decarboxylase; Nr1h, nuclear receptor 1h; ONECUT1, hepatocyte nuclear factor; PMVK, phosphomevalonate kinase; PPARA, peroxisome proliferator-activated receptor alpha; PTK6, protein-tyrosine kinase 6; RETSAT, all-trans-retinol 13,14-reductase; SQLE, squalene epoxidase; THRSP, thyroid hormone-inducible hepatic protein; TOP2A, DNA topoisomerase 2-alpha; TXNIP, thioredoxin-interacting protein; UBD, ubiquitin D; VNN1, vanin 1). Solid lines represent direct interactions and dashed lines represent indirect interactions. The network was constructed using IPA (QIAGEN).
Triglyceride Assay in Mct6+/+ and Mct6−/− Mice.
Due to preliminary evidence of Mct6’s role in lipid metabolism, plasma TGs were compared between the two groups of mice fed ad libitum to investigate if there were significant differences in overall TG exposure. Mct6−/− mice revealed a significant increase (P = 0.017) in plasma TGs (80.2 mg/dl) in comparison with the Mct6+/+ mice (46.8 mg/dl), which represents a 1.7-fold overall increase in plasma TGs (Fig. 7).

Plasma TG concentrations in Mct6+/+ and Mct6−/− male mice (N = 8/group, *P = 0.017, Student’s t test). Data are presented as mean ± S.D.
Discussion
This study represents the first in vivo evidence of the endogenous function of Mct6, obtained through the utilization of multitissue LC/MS comparative proteomic analyses and liver transcriptomics in a novel CRISPR/Cas9 Mct6 KO mouse model.
Development and Characterization of the Mct6−/− Mouse Model.
To further investigate and characterize the functional role of MCT6 in vivo, our laboratory developed the first Mct6−/− mouse model with the utilization of CRISPR/Cas9 (Ran et al., 2013). We suspect that the residual <10% Slc16a5 gene expression seen in our mRNA data is due to truncated and functionally inactive mRNA variants only containing exons 3 and 4. The WT gene expression data from this study largely agree with what is reported via Expression Atlas (G5E8K6) for Slc16a5 expression in mice. The measures of liver/kidney function suggest that Mct6 deficiency does not impact the overall health using the biomarkers tested for in this study.
Interestingly, the increase in plasma TG exposure in Mct6−/− mice suggests that Mct6 may have some regulatory role in lipid metabolism. These include the possible roles of Mct6 in the elimination of TGs or inhibition of its synthesis via direct or indirect mechanisms, which could result in higher TG concentrations in Mct6 KO mice. Future studies are needed to elucidate a plausible mechanism surrounding its involvement in TG homeostasis.
Comparative Proteomics and Transcriptomics of Mct6+/+ and Mct6−/− Mice.
The majority of the significantly altered proteins were downregulated in the Mct6−/− mice in the colon and liver, but upregulated in the kidney. The lack of significant upregulation/downregulation of other MCT isoforms in these three tissues also suggests that Mct6 plays a unique role in a biological pathway that is not significantly compensated for by other MCTs. Interestingly, the number of significantly altered proteins in each tissue also correlates well with the relative gene expression of Mct6 in that tissue. From the RNA-seq analysis, it was expected that the most downregulated gene in our Mct6−/− mice was Slc16a5, which further validated the inactivation of Mct6 gene expression. Many of the most significantly altered genes in the Mct6−/− mice, by magnitude and P value, were shown to be involved in regulating lipid and glucose levels, as well as lipid signaling pathways. This finding supports the previous hypothesis by Zhang et al. (2011), who proposed that Slc16a5 may play a role in pathways such as glucose and lipid metabolism.
In addition, a drawback of the analyses performed in this study is the incomplete validation of the proteomic and transcriptomic data using additional assays. Our laboratory initially investigated Mct6 protein expression through commercially available antibodies; however, this was unsuccessful mostly due to reasons involving the presence of multiple bands and lack of reliability of antibody-based detection methods. Attempts are currently ongoing to assess the metabolic and regulatory consequences that Mct6−/− mice have on glucose/lipid metabolism and to determine whether the magnitude of these changes has a meaningful impact on downstream biomarkers. However, recently Xu et al. (2019) have provided evidence for MCT6’s role in glucose and lipid metabolism using a rat model for diabetes. The study demonstrated that intestinal MCT6 function and expression were impaired in diabetic rats induced by combination of high-fat diet and low doses of streptozocin. Although this study was performed in rats, it provides a supporting example that MCT6 plays a major role in these pathways and warrants further investigation.
Bioinformatics Analysis on Kidney Proteomic Data.
Investigation into the significantly differentially expressed proteins in the kidney of Mct6−/− mice revealed a wide range of metabolic processes, including lipid metabolism and network functions associated with cellular function and maintenance. IPA revealed that the top canonical pathways associated with the kidney data set were immunomodulatory pathways. Considering that changes in the lipid metabolism have been demonstrated to play a role in modulating the immune system (de Pablo and Alvarez de Cienfuegos, 2000; Wu et al., 2018), perturbation in the renal secretion or reabsorption of dietary fatty acids via deactivation of Mct6 may be responsible for affecting these immunomodulatory events. Included in one such group of immunomodulatory signaling molecules are the prostaglandins, large chain fatty acids of the eicosanoid family synthesized from dietary fat and responsible for a wide range of biochemical events including regulation of the immune system (Harris et al., 2002; Ricciotti and FitzGerald, 2011). Moreover, considering there is evidence that prostaglandin F2α is a substrate for MCT6 (Murakami et al., 2005), this transporter may play a role in regulating the immune system through this pathway; however, further mechanistic studies are needed to confirm this hypothesis.
Bioinformatics Analysis on Liver Proteomic Data.
The top three significant GO biological pathways from our liver proteomic data were cellular lipid metabolism, mitochondrion organization, and fatty acid metabolism; these findings are supported by transcriptomic data suggesting that Mct6 is involved in lipid metabolism (Zhang et al., 2011). In addition, IPA bioinformatics analysis revealed that the top associated network functions included energy production and lipid metabolism. As previously mentioned, one of the top canonical pathways included α-tocopherol degradation, which involves the breakdown of plant-based vitamin E antioxidants responsible for terminating free radical–induced lipid peroxidation (van Acker et al., 2000; Singal et al., 2011).
Additionally, glycogen biosynthesis from UDP-D-glucose also surfaced as a significant canonical pathway associated with our altered protein data set. Like lipids, glycogen is a major storage form of energy, strictly regulated by hormones and nutritional status (Lu et al., 2014). The crosstalk of lipogenesis and glycogenesis is largely responsible for moderating energy storage and regulating ATP production. Additional significantly altered metabolic pathways include the mevalonate pathway and pregnenolone biosynthesis, both representing precursors necessary for steroid hormone biosynthesis and regulatory pathways in lipid homeostasis. Overall, it is evident from our limited dataset for the liver that there are significant alterations in the hepatic proteome of Mct6−/− mice associated with diet-associated lipid and potentially glucose metabolism, which agree with previous transcriptomic reports (Lu et al., 2011; Zhang et al., 2011).
Bioinformatics Analysis on Colon Proteomic Data.
Bioinformatics analysis performed on the differential colon proteomic data from the Mct6+/+ and Mct6−/− mice (which were the most abundant in all three tissues analyzed: 241 significantly altered proteins), was consistent with the kidney and liver data, which revealed that the pathways containing the most abundant proteins were largely metabolic. The clathrin-mediated endocytosis-signaling pathway, which was characterized as the most significant pathway in our colon data set, is largely responsible for the absorption of a wide range of dietary molecules. In particular, it has also been implicated as a major process of lipid raft-mediated absorption of low-density lipoproteins, which include triglycerides, lipids, and cholesterol. This process if tightly regulated via lipid composition and microdomain organization of the plasma membrane, which is highly dependent on a variety of functional lipid metabolic pathways (Harayama and Riezman, 2018).
Additionally, a large number of proteins involved in the TG biosynthesis pathway were differentially expressed between the two groups of mice. Changes in this pathway in the Mct6−/− mice would most likely cause changes in tissue or systemic TG concentrations, depending on the magnitude of change. This hypothesis is supported by our finding of significantly altered plasma TG concentrations. In intestinal tissue, TGs are synthesized and packaged to supply nutrients to peripheral tissues that can impact a wide variety of metabolic pathways (Yen et al., 2015). Perturbation of this pathway can have a direct effect on regulation of hormones, as well as lipid metabolism and overall systemic energy balance.
Bioinformatics Analysis on Liver Transcriptomic Data.
The most significant pathway enriched and predicted to be activated was the superpathway of cholesterol biosynthesis, which included upregulation of Pmvk, Sqle, Idi1, Fdps, Hmgcr, Cyp51a1, and Mvd. Specifically, Hmgcr encodes for the protein HMG-CoA reductase, a rate-limiting step in cholesterol biosynthesis, which has been shown to be activated in the liver during a high-fat diet (Wu et al., 2013). The mevalonate pathway overlaps the activity of this enzyme, by which mevalonate is synthesized from HMG-CoA to generate isoprenoids, including cholesterol, steroid hormones, and other lipid molecules.
This pathway analysis is supported by the large number of significant genes associated with lipid metabolism that are altered in our analysis. The genome-wide association study in the Genetics of Lipid Lowering Drugs and Diet Network (n = 872) identified a variant (rs12949451) in a predicted enhancer/promoter region of SLC16A5 in humans that was associated with triglyceride response to a high-fat meal (Wojczynski et al., 2015). Further mechanistic studies are needed to verify the impact of this variant on SLC16A5 activity and its relation to lipid metabolism.
Conclusions and Future Directions.
For the first time, using a multiomics approach and a novel KO mouse model, our investigation revealed evidence that MCT6 may play a role in glucose/lipid metabolism. However, further investigations are needed to assess potential changes following different diets, such as high-fat diets, which may reveal significant differences in glucose and lipid metabolic markers. These data, along with additional validation experiments such as a comprehensive metabolomic analysis, will provide additional support for these potential changes seen in these pathways. Further exploration is needed to provide evidence for a specific role of Mct6 within these pathways, and for the investigation of MCT6 as a potential therapeutic target in disease.
Acknowledgments
We acknowledge Mark D. Parker for his assistance in the mouse colony breeding scheme and support throughout the course of the study.
Authorship Contributions
Participated in research design: Jones, Morris.
Conducted experiments: Jones, Tu, Zheng, Qu.
Contributed new reagents or analytic tools: Jones, Tu, Zheng, Qu.
Performed data analysis: Jones, Tu, Zheng, Morris.
Wrote or contributed to the writing of the manuscript: Jones, Tu, Morris.
Footnotes
- Received March 21, 2019.
- Accepted June 27, 2019.
Funding support was received from the National Institutes of Health National Institute on Drug Abuse [Grant R01DA023223] and an IMPACT grant from the University at Buffalo. R.S.J. was supported in part by a PhRMA Pre-Doctoral Graduate Fellowship.
↵
 This article has supplemental material available at molpharm.aspetjournals.org.

Abbreviations
- GO
- gene ontology
- gRNA
- guide RNA
- IPA
- Ingenuity Pathway Analysis
- KO
- knockout
- LC
- liquid chromatography
- MCT
- monocarboxylate transporter
- MS
- mass spectrometry
- RNA-seq
- RNA-sequencing
- RT-PCR
- real-time polymerase chain reaction
- TG
- triglycerides
- WT
- wildtype
- Copyright © 2019 by The American Society for Pharmacology and Experimental Therapeutics


