


Article Figures & Data
Figures
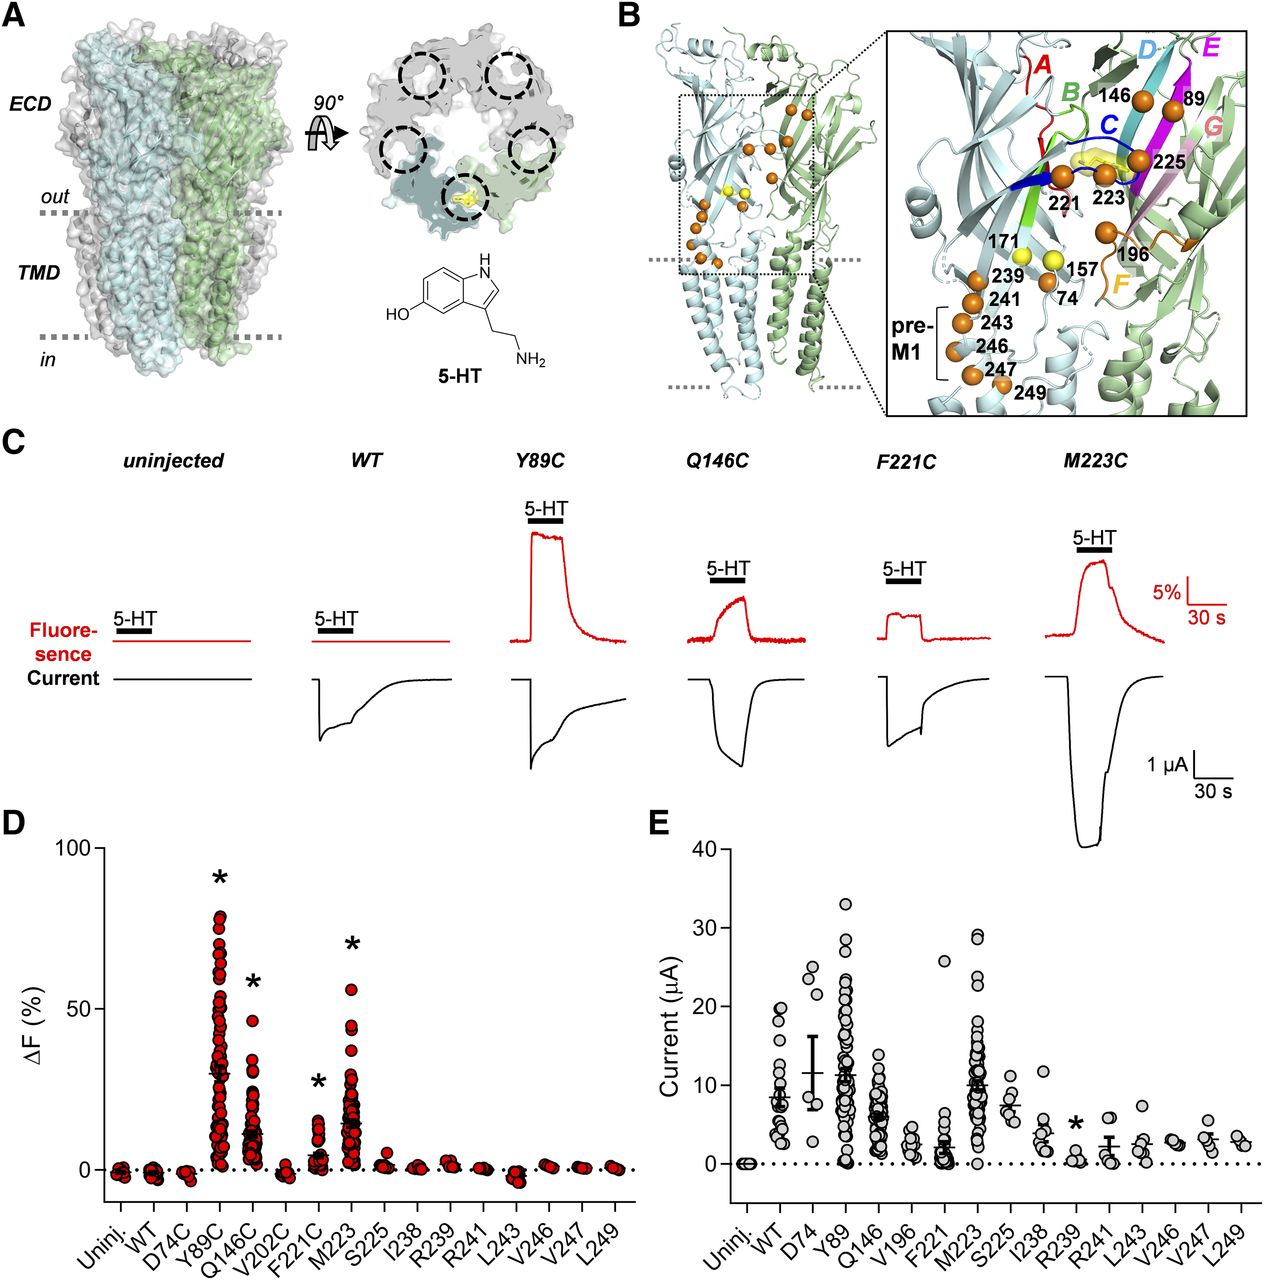
- Fig. 1.
Identification of h5-HT3A residues as voltage-clamp fluorometry reporter positions. (A) Surface contoured cartoon representation of a homology model structure of the pentameric h5-HT3A receptor (left) from Ladefoged et al. (2018). The principal and complementary subunits are highlighted in cyan and green, respectively, with indications of the ECD and TMD. The cross-sectional view (right) illustrates the location of the five equivalent 5-HT binding pockets (dashed circles) formed at subunit interfaces in the ECD, with 5-HT indicated in yellow surface contour. The chemical structure of the endogenous agonist 5-HT is shown below. (B) Magnified view of the ECD interface structure in cartoon representation with the orthosteric binding site and the loop A to G regions highlighted in different colors and bound 5-HT in yellow surface contour. Positions where Cys residues were introduced by mutagenesis, and the endogenous Cys residues 157 and 171 are indicated as orange and yellow spheres, respectively. (C) Representative recording traces of parallel fluorescence and current measurements from uninjected oocytes and oocytes expressing WT h5-HT3A, Y89C, Q146C, F221C, and M223C mutants during application of 100 µM 5-HT (black line). Upper traces (red) show the membrane fluorescence signal (F), and lower traces (black) show the corresponding membrane currents (I). (D-E) Summary of fluorescence changes (ΔF) (D) and currents (E) evoked by application of 100 µM 5-HT. Shown are scatter plots of ΔF from individual uninjected oocytes and oocytes injected with WT h5-HT3A or Cys-mutant h5-HT3A. The ΔF value is calculated as the percentage difference between baseline fluorescence and steady-state fluorescence during 5-HT application (see Materials and Methods). Bars represent mean ΔF (±S.E.M): uninjected; −0.71 ± 0.28 (13 oocytes), WT; −0.81% ± 0.23% (22 oocytes), D74C; 1.1% ± 0.3% (nine oocytes), Y89C; 30% ± 2% (77 oocytes), Q146C; 11% ± 1% (80 oocytes), V196C; −1.2% ± 0.4% (nine oocytes), F221C; 4.6% ± 0.7% (48 oocytes), M223C; 14% ± 1% (83 oocytes), S225C; 1.6% ± 0.6% (seven oocytes), I238C; 0.63% ± 0.15% (eight oocytes), R239C; 1.8% ± 0.4% (eight oocytes), R241C; 0.39% ± 0.11% (six oocytes), L243C; −1.8% ± 0.3% (13 oocytes), V246C; 1.1% ± 0.2% (four oocytes), V247C; 0.66 ± 0.10 (five oocytes), L249C; and 0.56 ± 0.21 (five oocytes). * Denotes mean response significantly different from WT; P < 0.05 (ANOVA with Dunnet’s correction for multiple comparisons).
- Fig. 2.
Characterization of effects of Cys-mutation and TAMRA labeling on h5-HT3A receptor function. (A) Concentration-response curves for 5-HT currents at WT and mutant h5-HT3A receptors expressed in oocytes with (red) and without (black) TAMRA labeling (see Materials and Methods). Data points represent the mean from three to five independent concentration-response experiments. Error bars are the S.E.M. and are shown when larger than symbol size. (B) Superimposed responses to 100-second applications of 1 mM 5-HT (black bar) recorded from oocytes injected with the indicated WT or Cys-mutant 5-HT3A subunit mRNA; before (black traces) and after TAMRA labeling (red traces). The onset of desensitization (left panels), activation (middle panels), and deactivation (right panels) are fitted with mono-exponential functions (shown as dotted lines) to determine time constants (τ). Note that for the middle and right panels that show the initial phase of the current response the superimposed responses are shown on a faster time scale compared with the left panel and that amplitudes for all responses are scaled to equal sizes. (C) Summary of time constants for desensitization (τdesensitization), activation (τactivation), and deactivation (τdeactivation). Data represent the mean and S.E.M. for 5–10 oocytes. * Denotes significantly different from unlabeled WT; P < 0.05 (ANOVA with Dunnet’s correction for multiple comparisons).
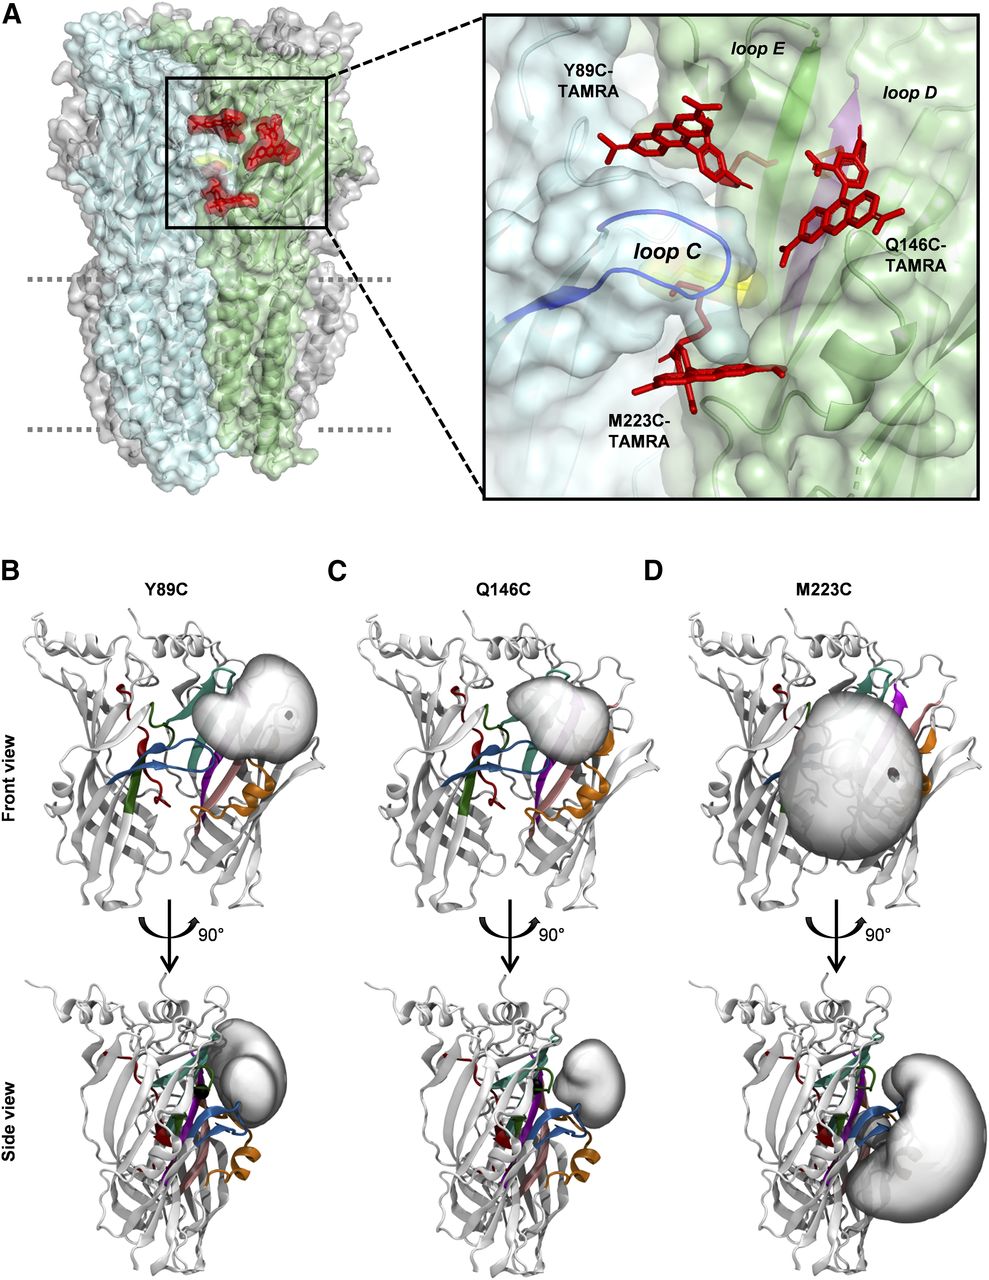
- Fig. 3.
Modeling of the orientation of conjugated fluorophores in the h5-HT3A receptor structure. (A) Side view of the structural models of TAMRA conjugation in the mutant Y89C, Q146C, and M223C h5-HT3A receptors. TAMRA is shown in stick representation (red) at position 89 in loop D, position 146 in loop E, and position 223 in loop C (see Materials and Methods). The agonist 5-HT is shown in yellow surface contour. (B–D) The predicted accessible volume for TAMRA conjugated at Cys residues inserted at positions 89 (B), 146 (C), and 223 (D) are shown in gray as observed frontally from within the membrane (top) as well as from the side (bottom) as calculated by the accessible volume method (see Materials and Methods). The receptor backbone of the principal and complement face of the ECD is shown as light gray ribbons and loops A–F are colored according to the color scheme introduced in Fig. 1.
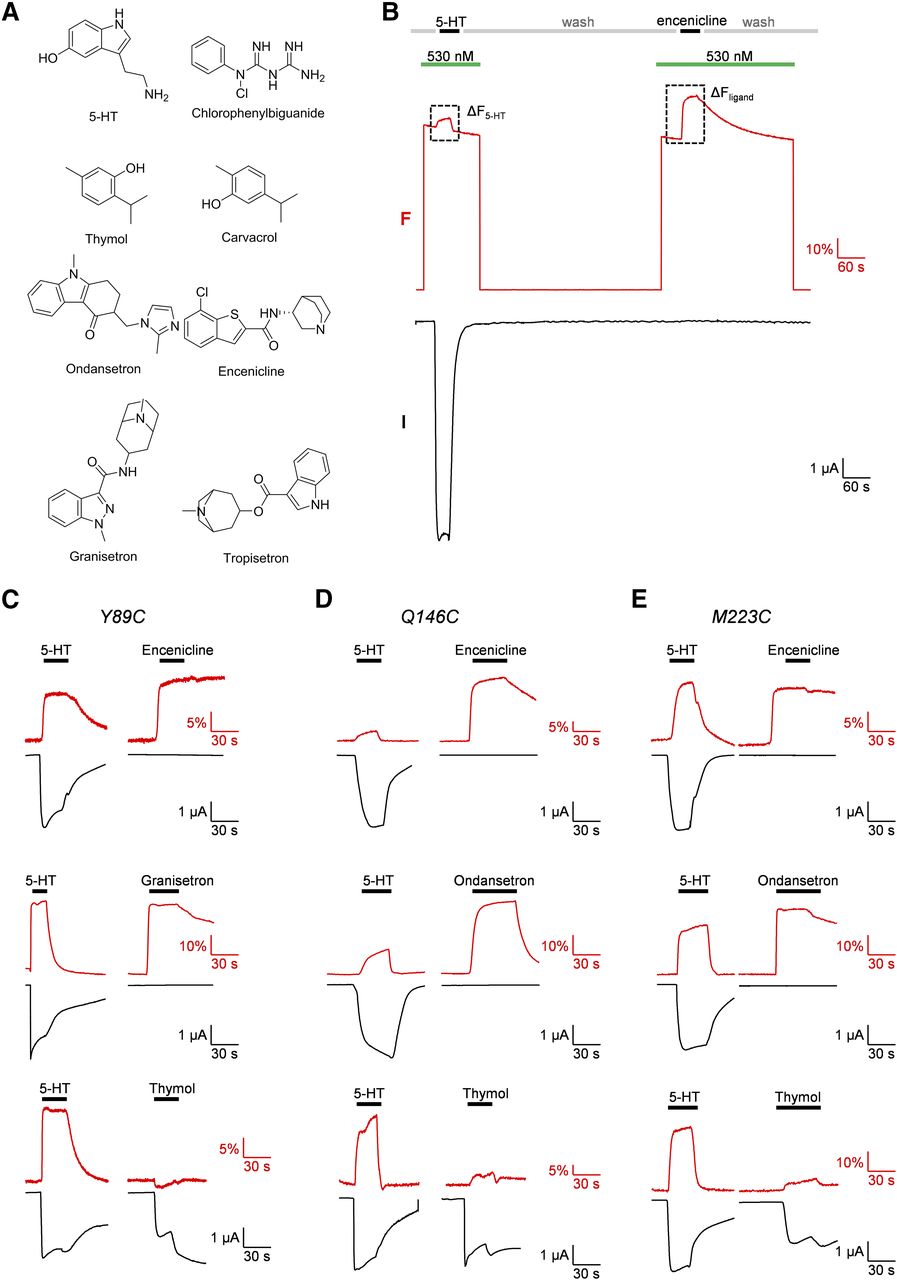
- Fig. 4.
Ligand-induced fluorescence changes in fluorophore-labeled h5-HT3A receptors. (A) Chemical structures of 5-HT3 receptor ligands characterized at the Y89C, Q146C, and M223C reporter mutants. (B) Representative traces illustrating the standard VCF recording protocol for measurement of fluorescence [(F), upper trace in red] and current [(I), lower trace in black] responses to ligand application from oocytes expressing h5-HT3A reporter mutants (see Materials and Methods). An oocyte expressing the Q146C mutant was exposed 5-HT (black bar; 100 µM) followed by a 6-minute wash period (gray bars) before application of a saturating concentration of encenicline (blue bar; 10 µM). Excitation light (green bars; 530 nM) was turned off during the wash period to minimize fluorophore photodestruction. Dotted boxes indicate regions of the fluorescence trace that are used for calculation of ΔF for 5-HT and ligand. (C and D) Representative parallel fluorescence and current responses to sequential application of 5-HT and ligand (encenicline, 10 µM; ondansetron, 3 µM; granisetron, 3 µM; and thymol, 1 mM) at the Y89C (C), Q146C (D), and M223C (E) reporter mutants.
- Fig. 5.
Summary of fluorescence and current response patterns for the Y89C, Q146C, and M223C mutants. (A–C) Graphical summaries of ligand fluorescence response (ΔFligand) amplitudes normalized to the response amplitude to a previous application of 5-HT (ΔF5-HT) for the Y89C (A), Q146C (B), and M223C (C) reporter mutants. The 5-HT data represent recordings of a subsequent application of 5-HT following the same standard recording protocol illustrated in Fig. 4A. Data represent mean ± S.E.M. for 5–16 recordings of individual oocytes. *Denotes significantly different from 5-HT; P < 0.05 (ANOVA with Dunnet’ N.D., not determined.
- Fig. 6.
Concentration-response curves for agonist- and antagonist-induced fluorescence changes at the Y89C, Q146C, and M223C mutants. (A) Concentration-response curves for fluorescence and current responses evoked by the agonists 5-HT (upper curves) and mCPBG (lower curves). Data points represent the mean ± S.E.M. from five to eight individual experiments. Concentration-dependent increases in fluorescence. (B) Representative traces illustrating the standard recording protocol employed for fluorescence concentration-response experiments. Shown are 5-second segments from recording traces of membrane current (black traces) and fluorescence (red traces) from an oocyte expressing TAMRA-conjugated Y89C mutant receptor during application of increasing concentrations of ondansetron (indicated by black bars) (see Materials and Methods). The excitation light-emitting diode was pulsed for 200 milliseconds (indicated by green bars) every second to limit the fluorophore photodestruction during the extended recording time. Each ligand concentration was applied for 2 minutes to allow stable fluorescence levels. (C) Concentration-response curves for fluorescence responses evoked by setron-class antagonists at the Y89C, Q146C, and M223C mutants. Data points represent the mean ± S.D. from four to eight individual experiments.


Tables
- TABLE 1
Residues in h5-HT3A selected for cysteine substitution and their equivalents in other Cys-loop receptor subunits previously studied by fluorescence
Human h5-HT3A Previously Studied Positions in Cys-Loop Receptors as Potential VCF Reporters Region Human ρ1 GABAA Rat α1 GABAA Human α1 GlyR Asp74a Ser66b N.T. Ala52c Loop 2 Tyr89 N.T. N.T. Gln67c Loop D Gln146 Leu166b Leu127d Leu127c Loop E Val196a Asp214e N.T. N.T. Loop F Phe221 N.T. N.T. N.T. Loop C Met223 Tyr241b N.T. His201c Loop C Ser225a N.T. N.T. Asn203c Loop C Ile238a N.T. N.T. N.T. Pre-M1 Arg239a N.T. N.T. Glu217c Pre-M1 Arg241a N.T. N.T. Gln219c Pre-M1 Leu243a N.T. N.T. Gly221c Pre-M1 Val246a N.T. N.T. Leu224c Pre-M1 Val247a N.T. N.T. Ile225c Pre-M1 Leu249a N.T. N.T. Met227c Pre-M1 N.T.; not tested in the listed subunit.
↵a Indicates that the position did not report fluorescence changes when mutated to Cys and labeled with a fluorophore in the indicated study. Residue numbering according to original publications and may differ from canonical sequence numbering. Other studies concerning studies of Cys-loop receptors by fluorescence labeling at other positions thank those in the present study include Mourot et al. (2008), Menny et al. (2017), and Polovinkin et al. (2018).
↵b Chang and Weiss (2002).
↵c Pless and Lynch (2009a).
↵d Muroi et al. (2006).
↵e Zhang et al. (2009).
- TABLE 2
EC50 values for current and fluorescence responses to 5-HT and mCPBG at unlabeled and labeled WT and mutant h5-HT3A receptors
Mutant EC50 Value 5-HTa mCPGBa TEVC ∆F TEVC ∆F µM µM µM µM WT 2.6 [2.2; 3.0] N.D. 0.45 [0.35; 0.60] N.D. WT + TAMRA 3.5 [3.1; 4.7]* N.D. 0.95 [0.70; 1.3] N.D. Y89C 0.24 [0.20; 0.28]* N.D. 0.48 [0.34; 0.68] N.D. Y89C + TAMRA 0.70 [0.56; 0.86]* 4.0 [3.2; 4.9]# 0.26 [0.20; 0.34] 1.0 [0.67; 1.5] Q146C 1.2 [0.9; 1.7]* N.D. 1.5 [1.4; 2.0] N.D. Q146C + TAMRA 4.8 [3.0; 7.9] 61 [48; 79]# 1.1 [0.90; 1.45] 49 [36; 65]# F221C 85 [76; 94]* N.D. N.D. N.D. F221C + TAMRA >300* >300 N.D. N.D. M223C 7.2 [5.2; 10]* N.D. 3.7 [ 3.0; 4.5]* N.D. M223C + TAMRA 22 [19; 26]* 18 [14; 23] 8.9 [6.1; 13]* 24 [15; 38] TEVC, two-electrode voltage clamp. N.D., not determined.
↵a The EC50 values were determined as described in Materials and Methods by nonlinear fitting of concentration-inhibition data collected at 5–10 oocytes. Numbers in brackets denote the 95% confidence interval for EC50.
↵* P < 0.01 vs. WT. #P < 0.01 vs. two-electrode voltage-clamp EC50 (ANOVA with Dunnet’s correction for multiple comparisons).
Reporter Mutant EC50 Valuea Ondansetron Granisetron Encenicline Tropisetron nM nM nM nM Y89C 58 [36, 96] 100 [59; 180] 170 [110; 270] 45 [24; 87] Q146C 850 [73; 1000] 800 [670; 970] 370 [340; 410] 850 [540; 1300] M223C 51 [38; 70] 54 [38; 77] 74 [59; 95] 38 [19; 74] ↵a The EC50 values were determined as described in Materials and Methods by nonlinear fitting of concentration-inhibition data collected at 5–10 oocytes. Numbers in brackets denote the 95% confidence interval for EC50.
Data Supplement
- Supplemental Figures -
Supplementary Figure 1 - Alignment of amino acid sequences for the 5-HT3A receptor subunit and pLGIC receptor subunits for which previous work has identified VCF reporter positions.
Supplementary Figure 2 - Effect of 5-HT on MTS-TAMRA fluorescence in solution.
Supplementary Figure 3 - Effect of application of various ligands on conjugated TAMRA fluorescence at uninjected and WT 5-HT3A expressing oocytes.
- Supplemental Figures -


