


Article Figures & Data
Figures
- Fig. 1.
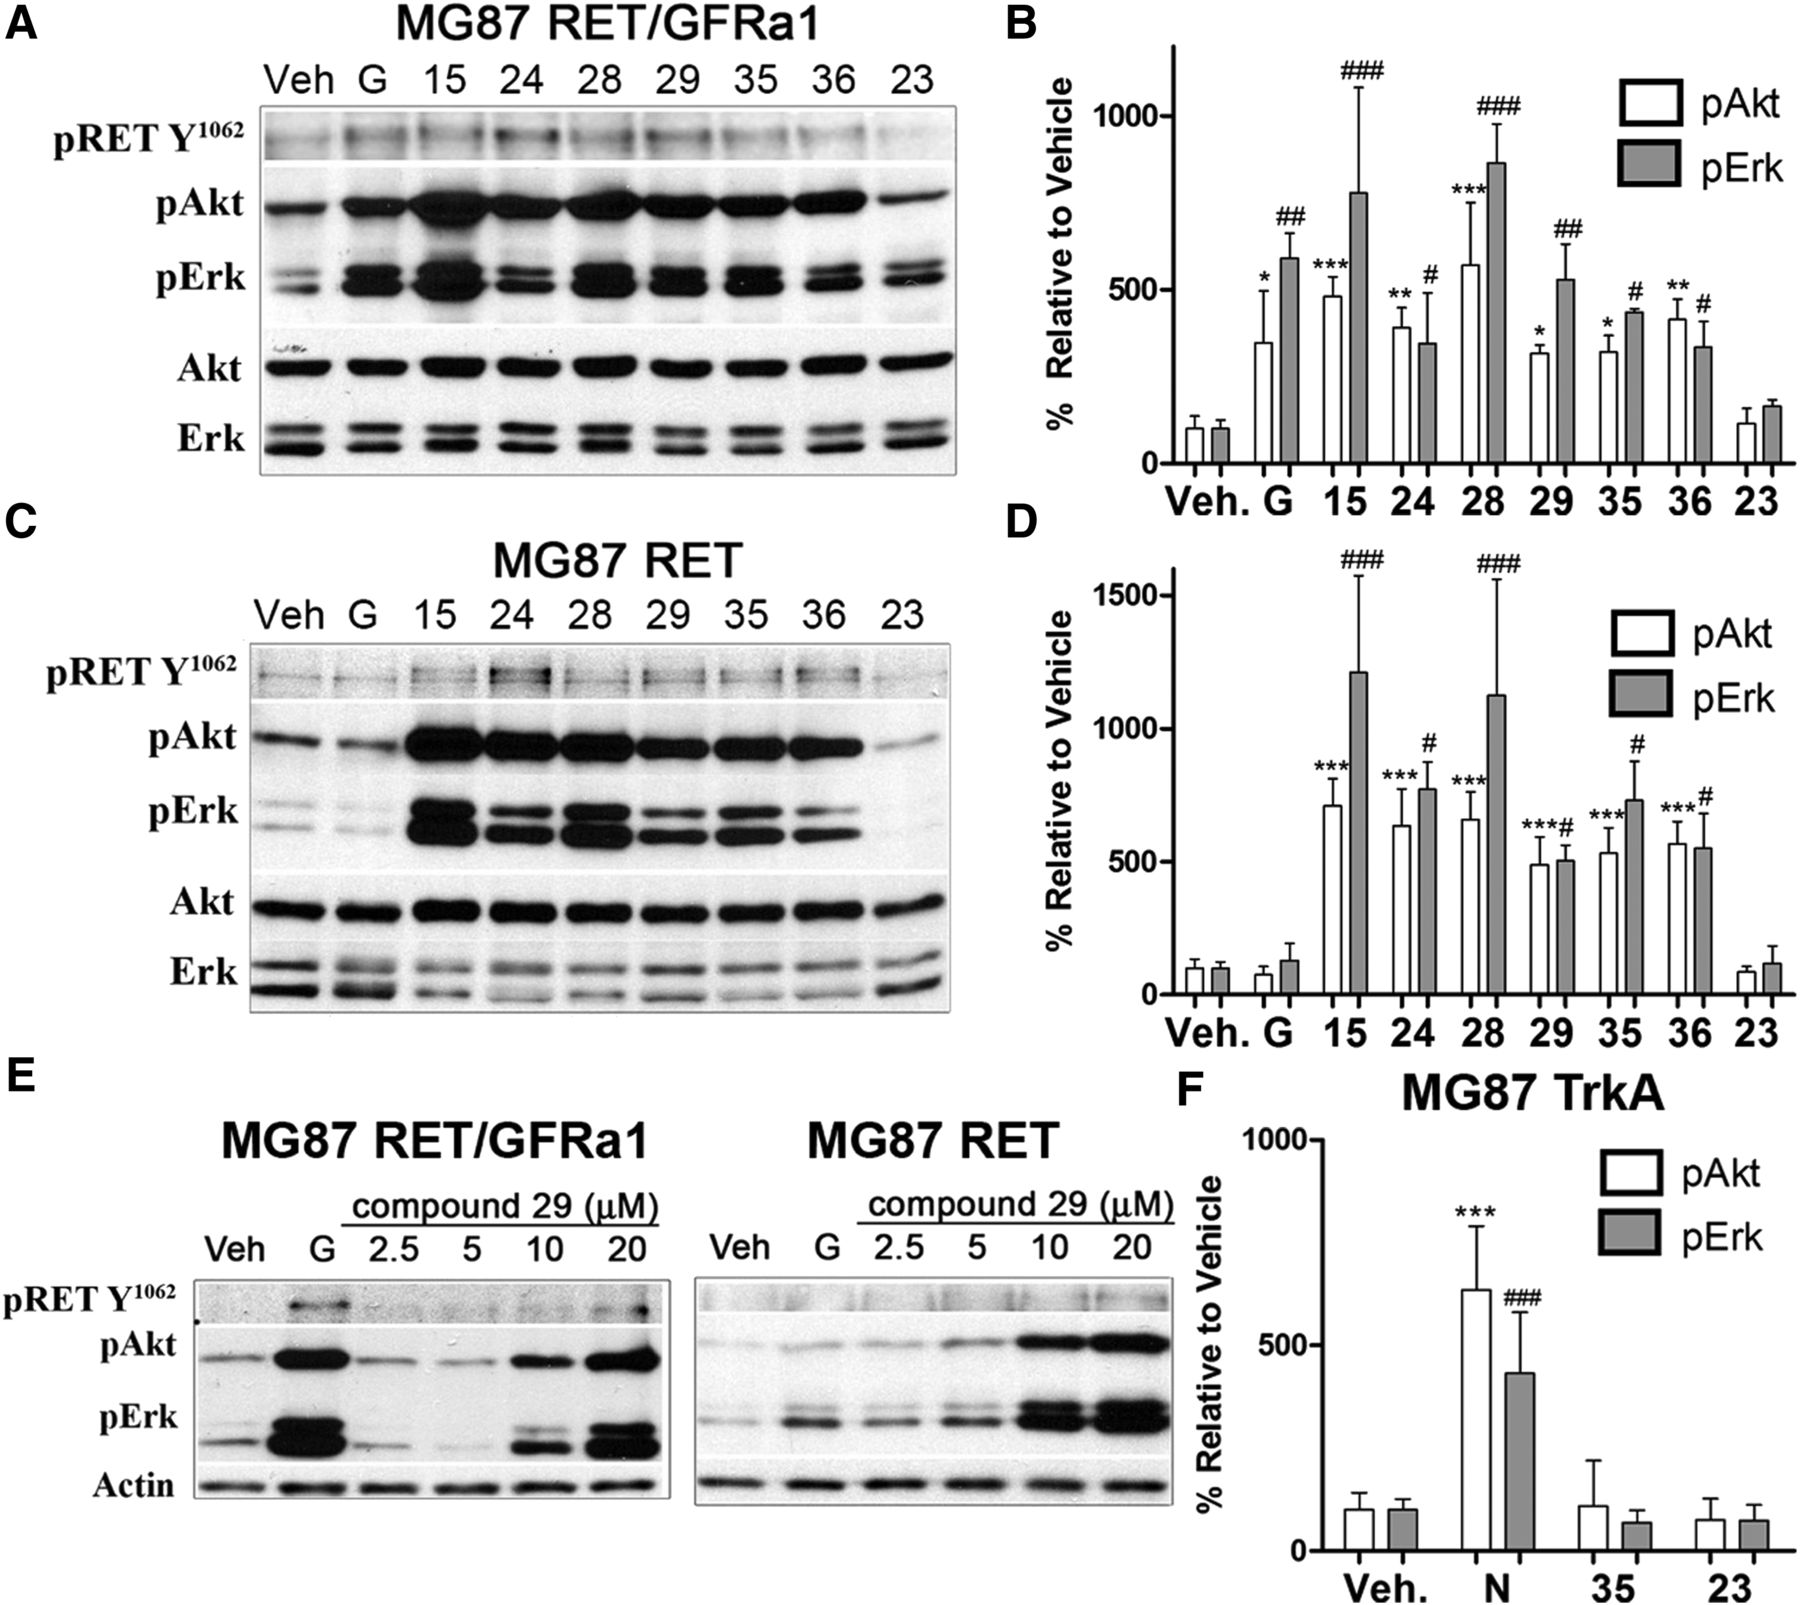
Characterization of RET agonists. (A and B) Biochemical studies of RET activators in MG87 RET/GFRa1 cells. Following serum deprivation, cells were treated with DMSO vehicle (Veh), 10 ng/ml GDNF (G), or 20 μM compounds for 20 minutes. Representative blot is shown, and cell lysates were probed for pRET-Y1062, pAkt, and pErk. Total Akt and Erk were used as loading controls. Increases in pRET-Y1062 were seen; however, compounds generated large increases particularly in pAkt and pErk, with the exception of compound 23. (C and D) Biochemical studies of RET activators in MG87 RET cells, lacking GFRa1. Representative blot is shown, demonstrating relevant signaling by this panel of compounds. Note that GDNF is inactive in this cell type, and compound 23 remains inactive. (E) Western blots showing dose-dependent RET activation by compound 29 (2.5–20 μM) in both MG87 RET/GFRa1 and MG87 RET cells, further suggesting GFRa1 independence. (F) Counter screens for selectivity in MG87 TrkA cells. Western blot quantification of NGF (N) at 30 ng/ml (positive control) or the selected compound 35 at 20 μM. Compound 23 was used as a negative control. Compound 35 demonstrated the most favorable selectivity as it did not activate Akt or Erk in MG87 TrkA cells lacking RET. Western blot data were quantified from three independent experiments, expressed as mean ± S.D. and standardized to vehicle control. For pAkt, *P < 0.05; **P < 0.005; ***P < 0.0005. For pErk, #P < 0.05; ##P < 0.005; ###P < 0.0005, Dunnett’s test.
- Fig. 2.
Lead optimization. (A and B) Biochemical studies with compound 35 derivatives in MG87 RET/GFRa1 cells assayed 20 μM concentrations of compounds 7, 8, and 9 with a 20-minute exposure time. Representative Western blot shown for RET-pY1062 and its effectors pAkt and pErk. GDNF (G) is GDNF positive control, and vehicle (V/Veh.) is the DMSO negative control. Compound 8 displayed a signaling profile that mirrored that of the parent compounds, whereas compound 7 generated a pErk-biased signaling trend. Compound 9 was completely inactive. (C and D) Biochemical studies with compound 35 derivatives tested in MG87 RET cells. Representative Western blot shown for RET-pY1062 and its effectors pAkt and pErk. GDNF (G) is GDNF positive control, and vehicle (V/Veh.) is the DMSO negative control. Signaling profiles of compounds 7, 8, and 9 were similar to those observed in MG87 GFRa1/RET cells, indicating that these derivatives maintained GFRa1 independence. (E and F) Selectivity screens in MG87 TrkA cells, using 20-μM concentrations of compound 35 derivatives stimulated for 20 minutes. Representative blot for pTrkA and its effectors pAkt and pErk. NGF (N) is positive control, and vehicle (V/Veh.) is the negative control. Compounds 7, 8, and 9 were all inactive in these assays. (G) Compound 8 signaling in E18 mouse cortical neurons. Neurons were treated with compound 9 at 20 μM, GDNF at 100 and 200 ng/ml, and compound 8 at 10 and 20 μM for 20 minutes. Representative blot showing pAkt increases observed with both treatments of compound 8. Actin was used as loading control. (H) RET inhibition blocks compound 8 signaling. MG87 RET/GFRa1 cells were first treated with the RET antagonist SU5416 at 10 μM for 20 minutes and then an additional for 20 minutes with GDNF (G) or compound 8. Vehicle (V) and SU5416 (S) alone are controls. SU5416 pretreatment resulted in clear reductions in the signaling capacity of both GDNF and compound 8. Representative blot showing pAkt and pErk, with Actin as loading control. Vehicle (V) is the negative control. In (B, D, and F), quantification of Western blot data were standardized to total Erk or total Akt and expressed as mean ± S.D. from three independent experiments. For pAkt, *P < 0.05; **P < 0.005; ***P < 0.0005. For pErk, #P < 0.05; ##P < 0.005; ###P < 0.0005 vs. vehicle, Dunnett’s test.
- Fig. 3.
Compound 8 is a RET ligand that induces RET tyrosine phosphorylation. (A) Surface plasmon resonance, real-time binding to recombinant human RET ectodomain. Representative, reference-subtracted SPR for sequential injections of buffer [PBS/Tween 20 containing 2% (v/v) DMSO], compound 9 (100 μM, negative control), and compound 8 (100 μM) over amine-coupled high-density RET (4600 RU, solid black line) at 25 μl/min (60-second association). (B) Representative single-cycle SPR data for compound 8 (0–25 μM; twofold dilution series) injected over amine-coupled low-density RET (1650 RU, solid black line) at 25 μl/min (60-second association ± 60–600-second dissociation). Arrows indicate injection times. (C) Representative multicycle SPR data for compound 8 (0–20 μM; twofold dilution series) injected over 1650 RU RET surface at 25 μl/min (600-second association + 900-second dissociation); experimental titration series (gray lines) were fit globally to “1:1 kinetic” model in BIAevaluation software (black lines). (D) Representative single-cycle SPR data for anti-RET monoclonal antibody (0–210 nM; twofold dilution series) injected over 4600 RU RET (solid black line), and 1650 RU RET (dashed black line) surfaces at 25 μl/min (60-second association ± 60–600-second dissociation). (E–G) Compound 8 induces RET phosphorylation in a dose-dependent manner. MG87 RET/GFRa1 or MG87 RET cells were treated for 15 minutes with compound 8 or control compound 9 at a concentration range of 5–100 μM, control GDNF (G) at 200 ng/ml, or vehicle (V). RET protein was immunoprecipitated and probed with 4G10 mAb (detecting phosphotyrosine). Compound 9 was inactive at all concentrations, whereas compound 8 induced a marked increase in phosphorylated RET whether cells express GFRa1. In MG87 RET/GFRa1 cells, compound 8 at 50 μM was as effective as GDNF at 200 ng/ml. Ctrls, controls. Quantification in (G) was standardized to total RET protein and expressed as mean ± S.D. from three independent experiments. **P < 0.005; ***P < 0.0005 vs. vehicle, Dunnett’s test.
- Fig. 4.
RET-mediated trophic signals activated by compound 8 are regulated by GFRa1. (A) Compound 35 derivatives mediate survival in MG87 RET cells. Cells under serum starvation for 72 hours were treated with DMSO vehicle (V), FGF (as these cells are insensitive to GDNF), or compounds 7, 8, and 9 at 5- and 10-μM concentrations. Cell survival/metabolism was assessed via the MTT assay. The 10-μM concentrations of compound 7 or compound 8 yielded appreciable survival levels, whereas compound 9 was inactive, as expected. (B) Compound 35 derivatives do not afford survival in MG87 RET/GFRa1 cells under the same conditions. In these cells, GDNF yielded significant survival, whereas the trophic effects of compounds 7 and 8 diminished, suggesting a negative influence of the GFRa1 receptor. MG87 RET/GFRa1 survival increased with higher concentrations of compound 8 and reached significance at 40 μM, suggesting a negative regulatory role of GFRa1 expression on the functional outcome. (C) Compound 35 derivatives demonstrate selectivity as measured by cell survival. MTT assays conducted in the MG87 TrkA cell line, covering the full concentration range of 5–40 μM for each compound, were standardized to positive control NGF (N) and compared against vehicle (V). All compounds were completely inactive in this cell type, including GDNF (G). (D) Biochemical studies on the influence of GFRa1 and compound 8. MG87 RET/GFRa1 or MG87 TrkA cells were pretreated with 4 μM XIB4035 (a GFRa1 modulator) for 10 minutes before the addition of compound 8 at 10 μM, GDNF (G), NGF (N), or FGF2 (F). XIB4035 blocked the signaling of compound 8 but did not affect GDNF. Control experiments in the TrkA-expressing cells showed that XIB4035 did not impact either NGF or FGF2 signals, overall supporting the negative regulatory role of GFRa1 specifically on compound 8 signaling. MTT data are expressed as percent survival relative to optimal growth factor ± S.D. from six independent experiments (each experiment n = 4–8 replicate wells, which were averaged). For each cell type, the respective trophic factor was standardized to 100%, and vehicle to 0%. *P < 0.05; ***P < 0.0005, Dunnett’s test vs. inactive compound 9.
- Fig. 5.
Compound 8 is neuroprotective in the RHOP347S model of RP and activates Akt and Erk in retinal Müller Glial cells. (A) Compound 8 reduces neuronal death. Whole retinas of postnatal day 18 RHOP347S mice were dissected for organotypic culture. Each paired set of retinas (left and right of the same mouse) were treated with either compound 8 at 20 μM or GDNF at 500 ng/ml in one retina and DMSO vehicle (V) as control in the other retina. In a separate series of experiments, an inactive compound was also tested as control at 20 μM. Cultures were kept for 24 hours and then TUNEL staining was performed. Representative TUNEL images taken at 20× in the central retina are shown. Scale bar, 25 μm. Quantification of TUNEL-positive photoreceptors in the ONL shows that treatment with compound 8 reduces apoptosis, whereas GDNF had no effect. Data expressed as TUNEL-positive cells per millimeter squared ± S.D., **P < 0.005, Bonferroni-corrected t test. (B–D) Compound 8 activates signals in vivo. Young adult mice (8 weeks old) were injected intravitreally (2 μg) with compound 8 in one eye or DMSO vehicle in the contralateral eye. Eyecups were collected after 1 hour and sectioned. Compound 8 increased pAkt in the inner nuclear layer as well as in fibers projecting from cell bodies in the inner nuclear layer (Müller cell bodies). These signals co-localized with the Müller cell marker CRALBP. Compound 8 also increased pErk in the inner nuclear layer as well as in fibers projecting from cell bodies in the inner nuclear layer (Müller cell bodies) toward the ONL where the cell body of photoreceptors reside. These signals colocalized with the Müller cell marker CRALBP. Scale bar, 25 μm. INL, inner nuclear layer; RGC, retinal ganglion cell layer. Quantification of pAkt and pErk (n = 3 per group) expressed as the fold-change in pixel area over vehicle ± S.D.; ***P < 0.0005, Student’s t test; **P < 0.005, Student’s t test.


Additional Files
Data Supplement
- Supplemental Data -
Supplementary Table 1 - Initial Compound Screening.
Supplementary Figure 1 - Compound Structures. Overview of the structures as they are described by the NCI.
Supplementary Figure 2 - HPLC chromatogram of the 5-30%B gradient showing 2 mg injections of 4-amino-5-hydroxynaphthalene-1,3-disulfonic Acid (Blue) and Compound 8 (Black).
Supplementary Figure 3 - H-NMR resonances and the detected mass of 4-amino-5 hydroxynaphthalene-1,3-disulfonic Acid and of Compound 8 show that they are likely the same molecule.
- Supplemental Data -


