


The gut contains sensors for a wide range of nutrients, a number of them being G-protein-coupled receptors (GPCR/GPR). Among these GPCR are a group that respond to fatty acids, including GPR40 (FFA1), GPR43 (FFA2), GPR84 and GPR120(Reference Hirasawa, Hara and Katsuma1–Reference Wellendorph, Johansen and Brauner-Osborne3). GPR41 (FFA3) is a GPCR that is activated by SCFA(Reference Brown, Goldsworthy and Barnes4, Reference Le Poul, Loison and Struyf5). GPR43 is the only other member of this group that is activated by SCFA; GPR42, which is expressed in some human subjects(Reference Liaw and Connolly6) but not in rodents, is closely related to GPR41 and GPR43, but it is not activated by SCFA(Reference Brown, Goldsworthy and Barnes4).
SCFA are produced in the gut by bacterial fermentation of undigested carbohydrates. Concentrations of propionate and butyrate in peripheral and portal blood may, especially after feeding, be sufficient to activate GPR41(Reference Brown, Goldsworthy and Barnes4, Reference Le Poul, Loison and Struyf5, Reference Cummings, Pomare and Branch7–Reference Wolever, Josse and Leiter11). GPR41 couples to Gαi, lowering the intracellular concentration of cyclic AMP. This may affect both energy balance and glucose homoeostasis, owing to the expression of GPR41 in various tissues(Reference Brown, Goldsworthy and Barnes4, Reference Le Poul, Loison and Struyf5). First, GPR41 is expressed in enteroendocrine cells(Reference Tazoe, Otomo and Kaji12) where it promotes the secretion of peptide YY (PYY)(Reference Samuel, Shaito and Motoike13), which inhibits gastric emptying and food intake. As PYY is co-expressed with glucagon-like peptide 1 in enteroendocrine (L) cells(Reference Ekblad and Sundler14), activation of GPR41 might also increase the secretion of glucagon-like peptide 1, which like PYY inhibits gastric emptying and food intake, as well as stimulating insulin secretion from islet of Langerhans β-cells(Reference Girard15). Consistent with this mechanism, it was reported recently that GPR41 knockout mice exhibit reduced glucagon-like peptide-1 secretion, both in vivo and from primary colonic cultures. Secretion of glucagon-like peptide-1 was not via a Gαi-mediated pathway, however, which is not consistent with known signalling pathways for GPR41. Moreover, glucagon-like peptide-1 secretion is stimulated by elevation, not reduction, of the cyclic AMP concentration(Reference Tolhurst, Heffron and Lam16). Second, GPR41 is expressed in the pancreas(Reference Brown, Goldsworthy and Barnes4), including human and mouse islets of Langerhans(Reference Regard, Kataoka and Cano17–Reference Bahar Halpern, Veprik and Rubins19), and in the insulin-secreting cell line MIN6(Reference Kebede, Alquier and Latour18, Reference Zaibi, Stocker and O'Dowd20). Direct activation of GPR41 in β-cells of the islets of Langerhans would be expected to inhibit insulin secretion(Reference Regard, Kataoka and Cano17), contrasting with any possible stimulatory effect mediated by glucagon-like peptide-1.
Third, some workers have reported that GPR41 mRNA is expressed in murine adipose tissue, where it mediates leptin secretion in response to SCFA(Reference Xiong, Miyamoto and Shibata21). However, we(Reference Zaibi, Stocker and O'Dowd20) and others(Reference Hong, Nishimura and Hishikawa22) could not detect expression in murine adipose tissue. Fourth, GPR41 is expressed in sympathetic ganglia where its activation by SCFA promotes sympathetic outflow(Reference Kimura, Inoue and Maeda23), which would be expected to promote resistance to obesity and improve insulin sensitivity.
Although it is difficult to predict from these reports how the absence of GPR41 would affect glucose homoeostasis, they are largely consistent in predicting that absence of GPR41 should promote obesity. Others have reported, however, that the absence of GPR41 promotes leanness, provided mice are raised conventionally and therefore have a gut microbiota that is able to produce SCFA. Absence of GPR41 was associated with increased intestinal transit rate and reduced absorption of energy(Reference Samuel, Shaito and Motoike13). The aim of this work was, therefore, to reinvestigate energy balance in GPR41 knockout mice and to determine how the various possible influences on glucose homoeostasis of an absence of GPR41 balance out in the whole animal. We have compared male and female GPR41 knockout and wild-type mice fed on low- and high-fat diets, up to 40 weeks of age. By contrast with a previous report(Reference Samuel, Shaito and Motoike13), we find that male knockout mice have increased body fat mass, coupled with decreased energy expenditure, consistent with a role for GPR41 in the regulation of sympathetic outflow.
Methods
Housing and procedures were conducted in accordance with the UK Government Animal (Scientific procedures) Act 1986 and approved by the University of Buckingham Ethical Review Board.
Mice and diet
GPR41 knockout mice were generated by Deltagen, transferred via AstraZeneca to the University of Buckingham and bred, genotyped and further backcrossed to the C57Bl/6 strain, as described previously(Reference Zaibi, Stocker and O'Dowd20). The mice used in the present experiments had been backcrossed to the C57Bl/6 strain at least seven times.
Mice were housed in groups of three at 21 ± 1°C with lights on from 07.00 to 19.00 hours. There were nine mice in each of eight groups, divided by genotype, sex and diet (wild-type or GPR41 knockout; male or female; low-fat or high-fat diet). They were given ad libitum access to tap water and all initially fed on a standard low-fat diet that provided, by energy content, 5 % fat, 75 % carbohydrate and 20 % protein (14·0 kJ/g metabolisable energy; Rat and Mouse Diet 1, BK001E, Beekay Feed; B&K Universal Limited). The high-fat diet-fed mice were fed on this diet until 15 weeks of age and then given a high-fat diet that provided, by energy content, 45 % fat, 35 % carbohydrate (of which half was sucrose) and 20 % protein (D12451; Research Diets, Inc.). Further information on the composition of the diets is given in Table 1. Food and water intake for each cage and individual body weights were measured weekly from 6 or 15 weeks of age in the low- or high-fat diet experiments, respectively. Mice were killed by cervical dislocation following CO2 anaesthesia when they were 40 weeks old, after being fasted for 5 h from 08.00 hours.
Table 1 Composition of diets*
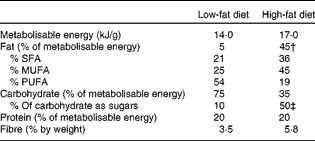
* % Fatty acids in fat and sugars in carbohydrate are by weight.
† 88 % as lard; 12 % as soya bean oil.
‡ As added sucrose.
Glucose tolerance test
Glucose tolerance was measured in all eight groups of mice when they were 27 weeks old. It was also measured in low-fat-fed mice when they were 10 weeks old. The mice were fasted for 5 h from 08.00 hours before administration of glucose (2 g/kg body weight, intraperitoneally). Blood samples were taken from the tip of the tail at 30-min intervals after topical application of a local anaesthetic (lignocaine gel). Glucose and insulin were measured as previously described(Reference Wargent, Sennitt and Stocker24). Total areas under the glucose tolerance curve were calculated for 120 min after administration of glucose using GraphPad Prism software (version 5; GraphPad Software, Inc.).
Plasma and blood analytes
Plasma and blood samples were taken from male and female mice after they had been fasted for 5 h from 08.00 hours, except as described earlier for glucose and insulin in the glucose tolerance test. Plasma adiponectin (Bridge International, Inc.), insulin and leptin (Crystal Chem, Inc.) were measured by mouse-specific ELISA. Blood glucose, cholesterol, TAG (Thermo Fisher Scientific), NEFA (Wako Chemicals) and HDL-cholesterol (Trinity Biotech) were measured by colorimetry.
Energy expenditure
Energy expenditure was measured by open-circuit indirect calorimetry, as previously described(Reference Stocker, Wargent and O'Dowd25), when the high-fat diet-fed mice were 15, 27 and 40 weeks old. Energy expenditure of all the different genotypes in a group was measured in a single run over 24 h at room temperature (21 ± 1°C). The mice had free access to food. Energy expenditure was calculated by customised software using the equation of Weir(Reference Weir26).
Body composition
Body composition was determined using a dual-energy X-ray absorptiometry (Lunar Piximus densitometer; Lunar Corporation) scanner at 10, 22 and 40 weeks of age in the low-fat-fed mice and at 22, 27 and 40 weeks of age in the high-fat diet-fed mice. Mice were anaesthetised with isoflurane (1·5 %) during data acquisition. Body composition was calculated using the manufacturer's software (version 1.45).
Liver TAG and glycogen content
Left lobe liver samples were dissected and snap-frozen into liquid N2. Approximately, 150–300 mg of tissue were homogenised in 500 μl methanol. Chloroform (1 ml) was added and the samples vortexed and then incubated at − 20°C overnight. Saline (200 μl) was added and the samples were centrifuged at 300 g for 5 min. Chloroform was removed from an aliquot (500 μl) of the chloroform phase using a RapidVap evaporation system (Cole-Parmer Instrument Company Limited). TAG was dissolved in ethanol (200 μl) and assayed colorimetrically (TAG reagent; Thermo Fisher Scientific). Liver glycogen was determined by homogenising tissue in KOH, precipitating glycogen using ethanol and treating it with amyloglucosidase before assaying glucose, as described previously(Reference Wang, Subramaniam and Cawthorne27).
Soleus muscle glucose uptake and palmitate oxidation
2-Deoxy[1-14C]glucose uptake and [1-14C]palmitate oxidation by soleus muscle from low-fat-fed 20-week-old mice were measured as previously described(Reference Ngala, O'Dowd and Wang28).
Locomotor activity
Mice were placed individually in a rectangular cage (42 × 25 cm) in which the bottom of the cage was divided by black lines into six equal rectangles. Following a habituation day, video camera shots were taken every 3 s for 16 min, beginning at 45 min before and 15 min after the dark period. Horizontal locomotor activity was assessed by two independent observers, in a similar manner to that described by others(Reference Morgan, Carroll and Loth29), from the number of times the mouse moved to a different square between shots. The observers did not know the genotype or the diet of the mice.
RNA isolation and real-time quantitative PCR analysis of gene expression
Total RNA was isolated and complementary DNA synthesised as described previously(Reference Zaibi, Stocker and O'Dowd20). Quantitative PCR was performed using Assay on Demand pre-designed primer and probe sets from Applied Biosystems. Transcript levels were quantified in triplicate by real-time RT-PCR and normalisation to house-keeping genes (tubulin, cyclophilin, hypoxanthine phosphoribosyltransferase and β-glucouronidase using geNorm software; Primer Design Limited), as described previously(Reference Zaibi, Stocker and O'Dowd20).
Statistical analysis
Data were analysed using one- or two-way with repeated measures ANOVA, as appropriate, using GraphPad Prism software (version 5). If the ANOVA showed significant effects of genotype, comparisons were made between the wild-type and knockout mice of the same sex at specific time points using Fisher's least significant difference test. Two-sided significance levels are given. Differences were considered significant at P< 0·05. Results are shown as mean values with their standard errors.
Results
Low-fat-fed mice
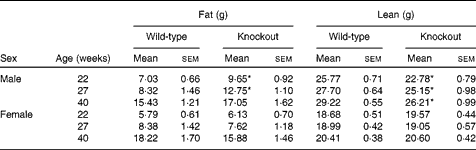
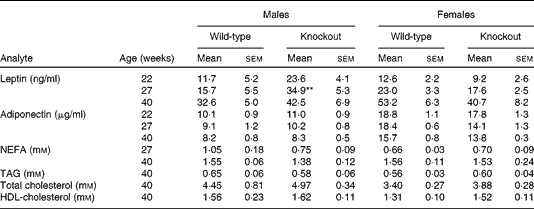
Genotype had no statistically significant effect on the growth curves of either the male or the female mice (Fig. 1). Genotype also had no effect on food intake (males: wild-type 844 (sem 64), knockout 857 (sem 59); females: wild-type 821 (sem 13), knockout 770 (sem 25) g/mouse per 40 weeks). Body fat mass was affected by genotype in the male knockout mice, being higher in the knockout than the wild-type mice at 40 weeks of age. Body lean mass was not affected by genotype in the male mice (Table 2). Genotype did not significantly affect the plasma leptin concentration in the male mice (P= 0·057 by two-way repeated measures ANOVA), but plasma adiponectin was elevated at both 22 and 40 weeks of age (Table 3). There was no effect of genotype on body composition or plasma leptin or adiponectin concentration in the female mice (Tables 2 and 3).
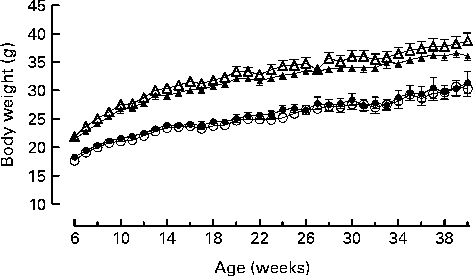
Fig. 1 Growth curves for wild-type (● and ▲) and G-protein-coupled receptor 41 knockout (○ and △) male (△ and ▲) and female (○ and ●) mice (n 9). Two-way repeated-measures ANOVA did not show a significant effect of genotype on body weight in either male or female mice.
Table 2 Body composition of low-fat-fed mice† (Mean values with their standard errors)
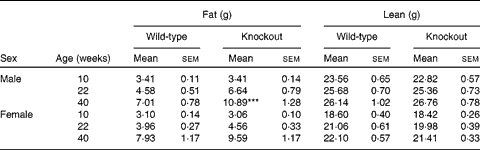
***Mean values was significantly different from that of the wild-type mice (P< 0·001).
† Two-way repeated-measures ANOVA showed a significant (P< 0·01) effect of genotype on body fat content in the male mice.
Table 3 Plasma hormone and metabolite concentrations in low-fat-fed mice† (Mean values with their standard errors, n 9)
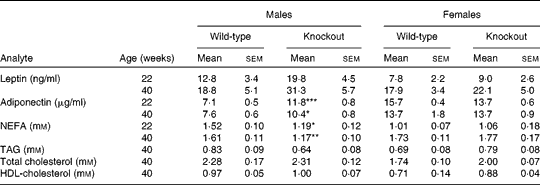
Mean values was significantly different from that of the wild-type mice: * P< 0·05, ** P< 0·01, *** P< 0·001.
† Two-way repeated-measures ANOVA did not show a significant effect of genotype on plasma leptin (P= 0·057 in males), but in male mice there were significant effects of genotype on plasma adiponectin (P< 0·001) and NEFA (P< 0·01).
At termination (40 weeks of age), there was no difference between genotypes in absolute liver weights, but liver weight relative to body weight was reduced in the male knockout mice, because the mean body weight was higher (but not significantly so) than in the wild-type mice (Table 4). The TAG content of the livers of the male knockout mice was markedly reduced (Table 4), possibly because the plasma NEFA concentration, a source of liver TAG, was reduced (Table 3). Genotype affected neither the liver TAG nor the plasma NEFA concentration of the female mice (Tables 3 and 4). Genotype did not affect plasma TAG, total cholesterol or HDL concentration in either sex at any age (Table 3). Soleus muscle and heart weights were lower in the knockout than in the wild-type mice when measured in a separate group of male mice (Table 4), but genotype did not affect palmitate oxidation or glucose uptake relative to tissue weight by soleus muscle (Fig. S1, available online).
Table 4 Liver composition and tissue weights† (Mean values with their standard errors, n 8 or 9)
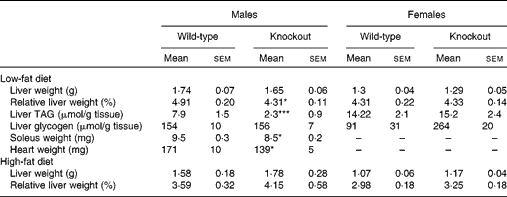
Mean value was significantly different from that of the wild-type mice (one-way ANOVA and Fisher's least significant difference test): * P< 0·05, *** P< 0·001.
† Plasma lipids and liver weight were measured after a 5 h fast during the light period in 40-week-old mice. Soleus muscle and heart weights were measured in 20-week-old mice.
The fasting blood glucose concentration (at both − 30 and 0 min) was not affected by genotype in either sex, but intraperitoneal glucose tolerance was impaired in 27-week-old male but not female knockout mice (Fig. 2). It was not impaired in 10-week-old male knockout mice – an age when they did not have a raised body fat content (AUC: wild-type 1382 (sem 158); knockout 1338 (sem 123) mm× 120 min). Genotype did not affect the plasma insulin concentration in either male or female mice 30 min before or after administration of glucose (Fig. 2(c) and (f)).

Fig. 2 (a, d) Glucose tolerance, (b, e) area under the glucose tolerance curve and (c, f) plasma insulin before and after administration of glucose in 27-week-old male (a–c) and female (d–f) mice fed on a low-fat diet. Wild-type mice are shown with ■ or ▲, and knockout mice with ![]() or □ (n 6). Values are means, with standard errors represented by vertical bars. Two-way, repeated-measures ANOVA showed a significant (P< 0·01) effect of genotype on blood glucose in the male mice. **Mean value was significantly different from that of the wild-type mice (P< 0·001).
or □ (n 6). Values are means, with standard errors represented by vertical bars. Two-way, repeated-measures ANOVA showed a significant (P< 0·01) effect of genotype on blood glucose in the male mice. **Mean value was significantly different from that of the wild-type mice (P< 0·001).
High-fat diet-fed mice
Mice were fed on a high-fat diet from 15 weeks of age. The growth curves of the knockout and wild-type mice were similar (Fig 3). Genotype did not affect the food intake of either sex (males: wild-type 336 (sem 16), knockout 300 (sem 36); females: wild-type 243 (sem 12), knockout 248 (sem 248) g/mouse per 15 weeks). Although the body weight of the male mice was unaffected by genotype, body fat mass and plasma leptin concentration were affected by genotype in male mice, being higher in 27-week-old male knockout than in the wild-type mice (Tables 5 and 6). Body lean mass, by contrast, was decreased at 22, 27 and 40 weeks of age (Table 5). Genotype did not affect the body composition of the female mice (Table 5). Genotype did not affect liver weight in either sex in mice fed on the high-fat diet, nor did it affect plasma NEFA or lipids (Tables 4 and 6).
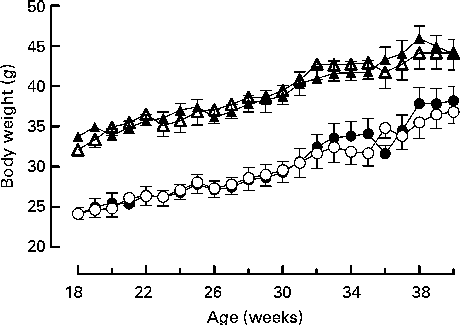
Fig. 3 Growth curves for wild-type (● and ▲) and G-protein-coupled receptor 41 knockout (○ and △) male (△ and ▲) and female (○ and ●) mice (n 9). Two-way repeated-measures ANOVA did not show a significant effect of genotype on body weight in either male or female mice.
Table 5 Body composition in high-fat-fed mice† (Mean values with their standard errors)
* Mean value was significantly different from that of the wild-type mice (P< 0·05).
† Two-way repeated-measures ANOVA showed significant effects of genotype on body fat (P< 0·05) and body lean content (P< 0·01) in the male mice.
Table 6 Plasma hormone and metabolite concentrations in high-fat-fed mice† (Mean values with their standard errors)
** Mean value was significantly different from that of the wild-type mice (P< 0·01).
† Two-way repeated-measures ANOVA showed a significant effect of genotype on plasma leptin (P< 0·05) in the male mice.
The fasting blood glucose concentration (at both − 30 and 0 min) and glucose tolerance were not affected by genotype in either the male or female mice (Fig. 4), but the plasma insulin concentration 30 min after the glucose load was higher in the knockout than the wild-type mice of both sexes (Fig. 4).

Fig. 4 (a, d) Glucose tolerance, (b, e) area under the glucose tolerance curve and (c, f) plasma insulin before and after administration of glucose in 27-week-old male (a–c) and female (d–f) mice fed on a high-fat diet. Wild-type mice are shown with ■ or ▲ and knockout mice with ![]() or △. (n 6). Values are means, with standard errors represented by vertical bars. Two-way, repeated measures ANOVA showed significant (P< 0·05) effects of genotype on plasma insulin in both male and female mice. *Mean value was significantly different from that of the wild-type mice (P< 0·05).
or △. (n 6). Values are means, with standard errors represented by vertical bars. Two-way, repeated measures ANOVA showed significant (P< 0·05) effects of genotype on plasma insulin in both male and female mice. *Mean value was significantly different from that of the wild-type mice (P< 0·05).
Energy expenditure and muscle metabolism
Energy expenditure was measured over 24 h in the high-fat-fed mice in their home cages in an attempt to understand why the males became obese without their having a detectable increase in energy intake. Energy expenditure was lower in the male knockout than in the male wild-type mice throughout the 24 h measurement period (Fig. 5). It was not low in the female knockout mice, consistent with only the male knockout mice becoming obese.

Fig. 5 Energy expenditure in mice fed on a high-fat diet. (a) Daily energy expenditure in wild-type (■) and G-protein-coupled receptor 41 (GPR41) (![]() ) knockout mice. (b) Hourly energy expenditure in 40-week-old male wild-type (▲) and GPR41 (△) knockout mice. Values are means, with standard errors represented by vertical bars. Two-way, repeated-measures ANOVA showed significant effects of genotype (P< 0·05) on both 24-h and hourly energy expenditure. Mean value of the knockout mice was significantly different from that of the wild-type mice: * P< 0·05, ** P< 0·01, *** P< 0·001.
) knockout mice. (b) Hourly energy expenditure in 40-week-old male wild-type (▲) and GPR41 (△) knockout mice. Values are means, with standard errors represented by vertical bars. Two-way, repeated-measures ANOVA showed significant effects of genotype (P< 0·05) on both 24-h and hourly energy expenditure. Mean value of the knockout mice was significantly different from that of the wild-type mice: * P< 0·05, ** P< 0·01, *** P< 0·001.
Observation of individually housed male mice, aged 35–39 weeks, for 15 min during the light and dark periods showed that low energy expenditure in knockout mice was not due to reduced horizontal locomotor activity (Table S1, available online).
Gene expression
There were no effects of genotype in male, 10- to 12-week old, low-fat-fed mice on levels of mRNA in liver, muscle, epididymal white adipose tissue or interscapular brown adipose tissue for GPR40, GPR120, PPARγ coactivator-1α sarco(endo)plasmic reticulum Ca2+ ATPase 1, type 2 deiodinase or carnitine palmitoyl transferase-1a; in liver only for sterol regulatory element-binding protein-1c, fatty acid synthetase or acetyl CoA carboxylase-1; or in brown adipose tissue for the β3-adrenoceptor (data not shown). We have reported elsewhere(Reference Zaibi, Stocker and O'Dowd20) a reduction in the expression of GPR43 in white adipose tissue of GPR41 knockout mice.
Discussion
Most reports on the expression and function of GPR41 in murine tissues lead to the prediction that its absence should promote obesity. Evidence has been presented, however, that its absence is associated with leanness, owing to increased intestinal transit rate and reduced absorption of energy(Reference Samuel, Shaito and Motoike13). We found, by contrast, that absence of GPR41 was associated with increased body fat content in male mice fed on either a low-fat or a high-fat diet, including when the mice were of the same age (10 weeks) as those used in the previous report. Nevertheless, we do not rule out the possibility that increased intestinal transit rate and reduced absorption of energy might have mitigated obesity in the GPR41 knockout mice used in the present study.
The male GPR41 knockout mice used in the present study also displayed impaired glucose tolerance, elevated plasma adiponectin and lowered plasma NEFA and liver TAG concentrations when fed on a low-fat diet. They displayed reduced lean body mass, elevated plasma leptin and elevated plasma insulin following administration of glucose when fed on a high-fat diet. The only effect of an absence of GPR41 in the female mice was an increase in the concentration of insulin after administration of glucose in the high-fat-fed mice.
A surprising finding was that the phenotype of the male GPR41 knockout mice was not exacerbated by feeding on a high-fat diet. Indeed, body fat content was elevated in 27-week-old but not in 40-week-old high-fat-fed knockout mice. Usually, a high-fat diet exacerbates the metabolic phenotype of GM mice. It is feasible that replacement of carbohydrate with fat in the high-fat diet reduced the production of SCFA in the gut and thereby the exposure of GPR41 to SCFA.
It has been claimed that the GPR41 gene is expressed in murine adipose tissue, where it mediates the stimulation of leptin secretion by SCFA(Reference Xiong, Miyamoto and Shibata21). However, it is unlikely that the increased body fat content of male GPR41 knockout mice was primarily due to the regulation of leptin secretion by GPR41. We(Reference Zaibi, Stocker and O'Dowd20) and others(Reference Hong, Nishimura and Hishikawa22) have been unable to detect GPR41 mRNA in murine adipose tissue. Moreover, the plasma leptin concentration was increased rather than decreased in the male GPR41 knockout, high-fat-fed mice compared to wild-type mice. A similar trend (P= 0·057) was observed in male GPR41 knockout mice fed on the low-fat diet. Obesity in rodents is normally associated with elevated plasma leptin, because, with the exception of the Lep ob/Lep ob mouse, increased adipocyte number and, especially, adipocyte size are associated with increased leptin secretion.
Activation of GPR41 stimulates the secretion of PYY from L cells(Reference Tazoe, Otomo and Kaji12, Reference Samuel, Shaito and Motoike13), which would tend to decrease food intake. Others have suggested that propionate might enhance satiety by activating either GPR41 or GPR43(Reference Sleeth, Thompson and Ford30). However, we could not detect increased food intake in GPR41 knockout mice. It is therefore unlikely that decreased secretion of PYY from enteroendocrine L cells played an important role in the obese phenotype of GPR41 knockout mice.
The feature of the GPR41 knockout mice that seems most likely to link to an increased body fat mass is reduced energy expenditure. The male, but not the female, high-fat-fed knockout mice became obese and only the males exhibited low energy expenditure. A possible explanation for the reduced energy expenditure is suggested by a recent report that SCFA promote sympathetic outflow by activating GPR41(Reference Kimura, Inoue and Maeda23). The mice used for that work were males (Professor Gozoh Tsujimoto, personal communication). It does not follow, however, that SCFA must fail to promote sympathetic outflow in female mice, because, as discussed later, female mice are often less susceptible than males to other genetic modifications that cause obesity in males. Female mice and rats are also less susceptible than males to high-fat diet-induced obesity and diabetes.
Another possible explanation for the reduced energy expenditure of the male knockout mice, particularly those fed on the high-fat diet, is that they have a reduced mass of energy consuming tissues. Total lean body mass was reduced in the male but not the female mice fed on a high-fat diet compared to wild-type mice. Lean body mass is associated with greater whole-body energy expenditure than is fat mass(Reference Butler and Kozak31, Reference Arch, Hislop and Wang32). Total lean body mass did not differ between knockout and wild-type male mice fed on the low-fat diet, but soleus muscle and heart weights were low in knockout mice. Therefore, the absence of GPR41 may inhibit the development of some energy consuming tissues, particularly red muscle.
A number of other possible explanations for this reduced energy expenditure can be discounted. It was not associated with reduced horizontal locomotor activity, consistent with it occurring throughout 24 h even though locomotor activity is greatest during the dark period. We could not detect any alteration in gene expression that might indicate decreased fuel metabolism in muscle, liver or brown adipose tissue, and fatty acid oxidation and glucose uptake per g soleus muscle weight did not differ between genotypes. Plasma adiponectin concentration, which might be expected to be associated with increased fatty acid oxidation and weight loss(Reference Fruebis, Tsao and Javorschi33, Reference Qi, Takahashi and Hileman34), was actually elevated in low-fat-fed male knockout mice, despite their increased body fat mass. The plasma adiponectin concentration is often inversely correlated with body fat mass(Reference Garaulet, Hernandez-Morante and de Heredia35), but we and others have previously reported positive associations between body fat mass and plasma adiponectin concentration(Reference Wargent, Sennitt and Stocker24, Reference Warren, Simon and Bartolini36–Reference Martin, Castillero and Granado38).
There are numerous reports of sex differences in the effects of diet or genetic manipulation on body composition and metabolism in rodents, and it is often the males that show the greater changes(Reference Hwang, Wang and Li39–Reference Uceyler, Schutt and Palm43). The differing effects of male and female sex hormones on adipose tissue distribution and the central regulation of metabolism may be of general importance(Reference Mayes and Watson44, Reference Brown and Clegg45), but mechanisms specific to particular genetic or behavioural manipulations have also been proposed(Reference Garcia-Barrado, Iglesias-Osma and Moreno-Viedma40, Reference Uceyler, Schutt and Palm43, Reference Loizzo, Vella and Loizzo46). In the context of the present work, where obesity is linked to low energy expenditure, it may be relevant that female rats have greater oxidative capacity than male rats. This has been linked to differences in oxidative capacity between the sexes in liver, skeletal muscle and brown adipose tissue(Reference Justo, Boada and Frontera47–Reference Choi, Oh and Choi49). This may be because male and female sex hormones have opposite effects on the balance of α2A- and β-adrenoceptor expression in murine brown adipocytes(Reference Monjo, Rodriguez and Palou50). However, as we were unable to identify any differences in gene expression in male mice that might underlie the differences in energy expenditure, we could not investigate whether any differences were absent in female mice.
Obesity is usually associated with insulin resistance. This may partly explain why the male knockout mice fed on the low-fat diet displayed an impaired glucose tolerance. The male knockout mice fed on the high-fat diet, by contrast, did not display impaired glucose tolerance. This may be because their plasma insulin concentration was higher following administration of glucose than in the wild-type mice. Moreover, the plasma insulin concentration following administration of glucose was higher in the female knockout mice fed on the high-fat diet than in the wild-type mice, even though their body fat content was no different from that of the wild-type mice. Stimulation of GPR41 in β-cells of the islets of Langerhans would be expected to decrease insulin secretion because GPR41 is coupled to Gαi. These results, therefore, raise the possibility that the absence of GPR41 in β-cells of high-fat diet-fed mice tends to promote insulin secretion in response to glucose.
Liver composition was studied in the low-fat-fed mice to investigate why liver weight relative to body weight was lower in male knockout compared to wild-type mice. The male low-fat-fed knockout mice had a lower liver TAG content, associated with lower plasma NEFA concentration, than the wild-type mice. The low liver TAG content in the livers of the male knockout mice can account, however, for only about 5 mg of the 90 mg (non-significant) difference in mean liver weight and so cannot explain the difference in relative liver weights. We do not have an explanation for the low liver TAG content and plasma NEFA concentration of the male knockout mice, but we suggest that they are linked. Interestingly, knockout of the GPR43 gene, another SCFA receptor, was also associated with reduced liver weight and TAG content, but only when mice were fed on a high-fat diet(Reference Bjursell, Admyre and Goransson51). Another difference from the present study is that GPR43 knockout mice were leaner than wild-type mice. As in the present study, the reduced liver weight could not be explained by the reduced liver TAG content.
In conclusion, in contrast to a previous report(Reference Samuel, Shaito and Motoike13), we find that male but not female GPR41 knockout mice have a higher body fat mass than their wild-type littermates, when they are fed on either a low- or a high-fat diet. This appears as a consequence of their energy expenditure being low. These results raise the possibility that gut-derived SCFA may raise energy expenditure by activating GPR41.
Supplementary material
To view supplementary material for this article, please visit http://dx.doi.org/10.1017/S0007114512003923
Acknowledgements
The authors are highly appreciative of the staff in AstraZeneca, Animal Science and Welfare, for their invaluable work in animal husbandry, embryo rederivation, breeding and data generation. They thank Alison Davies at AstraZeneca Alderley Park for assistance with the analysis of gene expression, Anita Roberts and Miriam Fernander at Buckingham University for technical assistance and Paul Trayhurn for commenting on the manuscript. J. R. S. A., D. M. S., M. A. C., C. J. S. and M. B. designed the research. M. B. conducted most experiments with support from, and additional experiments conducted by, C. J. S., J. F. O., E. T. W., M. S. Z., D. C. H. and R. A. N. The data were analysed by M. B., J. R. S. A. and R. A. N. The first draft of the manuscript was written by M. B., and then rewritten and revised by J. R. S. A., with input from D. M. S., M. A. C. and C. J. S. This work was supported by funding from AstraZeneca. D. M. S. is an employee of AstraZeneca.


