


Abstract
The expression of biotransformation enzymes in mouse small intestine is poorly characterized, which limits the utility of transgenic or knockout mouse models for first-pass drug metabolism studies. In response, we have systematically examined the composition and inducibility of cytochrome P450 (P450) protein and mRNA in mouse small intestinal epithelial cells (enterocytes). RNA-PCR was conducted to confirm the expression and identity of CYP1A1, 1B1, 2B10, 2B19, 2B20, 2C29, 2C38, 2C40, 2E1, 3A11, 3A13, 3A16, 3A25, and 3A44 in the enterocytes of untreated mice, but CYP1A2, 2A4/5, 2A12, 2C37, 2C39, and 2F2 were not detected. The inducibility of CYP2B, 2C, and 3A subfamily forms was determined by real-time quantitative RNA-PCR. All five CYP3A forms were induced, in a range from 1.7- to 4.5-fold, by dexamethasone (DEX). Phenobarbital (PB) induced CYP2B9, CYP2B10, and CYP2B20 mRNAs and suppressed CYP2B19 mRNA levels. PB also induced CYP2C29 and CYP2C40, but not CYP2C38 mRNA. At the protein level, CYP1A1, CYP1B1, CYP2B, CYP2C, CYP2E1, and CYP3A were detected in enterocytes from untreated mice by immunoblot analysis. CYP1A1 was inducible by β-naphthoflavone (BNF), CYP2B and CYP2C by PB, and CYP3A by DEX. CYP2B, 2C, and 3A proteins were all expressed at high levels proximally, and decreased distally. The inducibility of CYP1A1 followed a similar pattern. Intestinal P450 expression was compared between C57BL/6 (B6) and 129/sv (129) mice, strains commonly used in the preparation of transgenic and knockout mouse models. There was no significant strain difference in constitutive levels or induction patterns for CYP2B, 2C, and 3A protein. However, CYP1A1 was induced to a high level by BNF in B6 mice, but was not induced in the 129 mice.
Studies during the past 10 years have been increasingly supportive of a role for the mammalian small intestine as a metabolic organ. Small intestinal epithelial cells (enterocytes) provide the first site for metabolism of orally ingested xenobiotics, including therapeutic drugs (Kaminsky and Fasco, 1992). A variety of phase I and phase II enzymes are expressed in the small intestine, most prominent of which are the P450s.1 The expression of the CYP1, 2, and 3 families of this superfamily of heme proteins in the small intestine provides the potential for alteration of the efficacy of orally ingested therapeutic drugs and the toxicity of environmental pollutants.
Considerable recent progress has been made in the identification and characterization of small intestinal P450s, particularly in rats (Zhang et al., 1996) and humans (Ding and Kaminsky, 2003). In contrast, only a few studies on P450 expression profiles in mouse small intestine have been reported. In the early studies, the presence of mouse small intestinal P450s was inferred from enzyme activity measurements. Thus, 7,12-dimethyl[a]anthracene hydroxylation (Gentil and Sims, 1971), benzo[a]pyrene hydroxylation (Hietanen and Vainio, 1973;Wiebel et al., 1973), PB-inducible coumarin dealkylation (Lehrmann et al., 1973), aniline and biphenyl hydroxylations, and ethylmorphine N-demethylation (Chhabra et al., 1974) were all attributed to P450 activity in mouse enterocytes. Later studies identified P450 expression more specifically in mouse enterocytes: CYP1A1 was identified following its induction by BNF (Torronen et al., 1994) and by a polychlorinated biphenyl mixture, but only in aryl hydrocarbon receptor-positive mice (Cummings and Schut, 1995); CYP3A was detected in mouse small intestine by erythromycin and cyclosporine activities and by Western immunoblots (Berg-Candolfi et al., 1996). Immunoblot analysis was also used to demonstrate that CYP1A, CYP2B, CYP2C, and CYP3A subfamilies were induced in mouse small intestine by a food contaminant, imazalil (Muto et al., 1997); CYP24 mRNA was induced in mouse small intestine by 1,25-dihydroxyvitamin D3 (Yoshimura et al., 1998); and anti-rat CYP1A, 2C, 2D, 2E1, and 3A antibodies were used in immunoblot analysis of untreated mouse small intestinal P450 protein expression. Two immunoreactive bands were detected with the CYP3A antibody, suggesting the expression of two CYP3A forms, but no positive bands were detected with the other antibodies, possibly because of inadequate sensitivity (Emoto et al., 2000a). The two bands apparently corresponded to CYP3A11 and 3A13, based on subsequent RT-PCR amplification (Sakuma et al., 2000). A mouse everted sac experimental model of first-pass small intestinal metabolism further confirmed the presence of expressed CYP3A in the upper and middle sections of mouse small intestine by immunoblot analysis and testosterone 6β-hydroxylase activities (Emoto et al., 2000b). In addition, anti-rat CYP2J4 was used to identify expressed CYP2J in mouse small intestine, and this enzyme was inducible by pyrazole (Xie et al., 2000). CYP2C40 has been identified as the major member of its subfamily expressed in mouse intestine (Tsao et al., 2000).
The inconsistencies in the published reports on mouse small intestinal P450 expression profiles are possibly a consequence of the use of differing mouse strains and procedures for isolation of the enterocytes. The limited knowledge of mouse small intestinal P450 expression is an impediment to development of directed knockout and transgenic models for probing small intestinal metabolic capability. In an effort to systematically characterize the mouse small intestinal P450s, and to provide background data for studies with small intestinal transgenic and knockout mice, we have determined the forms of P450 expressed constitutively in mouse small intestine and the inducibility of these P450s. Qualitative RNA-PCR, real-time quantitative RNA-PCR, and immunoblot analysis were used to identify and quantify the levels of the expressed P450s. Results from C57BL/6 (B6) and 129/sv (129) mice were compared. These two strains are commonly used in the preparation of transgenic and knockout mouse models, and background information on strain-selective P450 expression is essential for assessments of studies using transgenic and knockout mice.
Materials and Methods
Materials. BNF, DEX, peroxidase-conjugated rabbit anti-goat IgG, peroxidase-conjugated goat anti-rabbit IgG, and protease inhibitors were obtained from Sigma-Aldrich (St. Louis, MO). PB was purchased from J. T. Baker (Phillipsburg, NJ), the enhanced chemiluminescence kit (ECL) from Amersham Biosciences Inc. (Piscatway, NJ), the bicinchoninic acid protein assay kit from Pierce Chemical (Rockford, IL), and the TRI Reagent from Molecular Research Center, Inc. (Cincinnati, OH). The RNA-PCR kit and other PCR reagents were from Applied Biosystems (Foster City, CA). LightCycler-FastStart DNA Master SYBR Green I was from Roche Applied Science (Indianapolis, IN).
Treatment of Animals. B6 (male and female) and 129 (male) mice (8-10 weeks old, ∼30 g body weight) were obtained from Charles River Laboratories, Inc. (Wilmington, MA). Animals were acclimated for at least 1 week at 22°C with a 12-h on/12-h off light cycle, and allowed free access to water and food. For induction studies, mice were treated by i.p. administration (once a day) of an inducing agent for the indicated times and were killed by CO2 overdose. The inducing agents and the doses used were: BNF, 40 mg/kg body weight for 3 days (in corn oil); PB, 100 mg/kg for 2 days (in saline); and DEX, 80 mg/kg for 3 days (in saline). All studies with mice were approved by the Institutional Animal Care and Use Committee of the Wadsworth Center.
Isolation of Intestinal Epithelial Cells and Preparation of Microsomes. Tissues from three mice were combined for each microsomal preparation unless otherwise specified in the text. Intestinal epithelial cells were isolated by a scraping technique as described previously (Emoto et al., 2000a), with modifications. Immediately after excision of the small intestine, the whole organ was placed in ice-cold phosphate-buffered saline and cut longitudinally, and then washed with ice-cold buffered saline to remove contents. The intestine was placed in phosphate-buffered saline, pH 7.2, containing 1.5 mM EDTA, 3 U/ml heparin, and 0.5 mM dithiothreitol for 20 min to loosen the mucosa before the cells were scraped free. The scraped cells were placed into the buffer and pelleted by spinning at 2,000g for 10 min at 4°C. The pelleted cells were washed twice with a solution containing 5 mM histidine, 0.25 M sucrose, 0.5 mM EDTA, and 230 μM phenylmethylsulfonyl fluoride. Microsomes were prepared from small intestinal epithelial cells as previously reported (Fasco et al., 1993), with the modification of including additional protease inhibitors [aprotinin (2 μg/ml), leupeptin (10 μM), pepstatin (1 μM), and l-trans-epoxysuccinyl-leucylamide-(4-guanido)-butane (5 μM)] in the microsome storage buffer. Liver microsomes were prepared as previously described (Fasco et al., 1993) with use of additional protease inhibitors as indicated above. Microsomes were stored at -80°C before use. Microsomal protein concentrations were determined with bovine serum albumin as the standard. The yield of enterocyte microsomes per mouse was 3 to 5 mg.
Immunoblot Analysis. Hepatic and small intestinal microsomal proteins were separated on NuPAGE Bis-Tris gels (10%) (Invitrogen, Carlsbad, CA). Proteins were electrophoretically transferred to nitrocellulose membranes (Towbin et al., 1979), which were then treated with 5% nonfat dry milk in 20 mM Tris-HCl buffer, pH 7.4, containing 0.15 M NaCl and 0.05% Tween 20 for 1 h at room temperature, incubated with a primary antibody in this buffer containing 5% milk for an additional 1 h or overnight at 4°C, washed with the buffer, and then incubated with a secondary antibody at 1:10,000 dilution in the buffer containing 2.5% milk. Primary polyclonal antibodies to rat CYP1A1/2, CYP2B1, CYP2C6, and CYP3A2, and to human CYP1B1 were purchased from BD Biosciences-Discovery Labware (Bedford, MA). Polyclonal antibody to human CYP2E1was purchased from Oxford Biomedical Research (Oxford, MI). These antibodies cross-react with mouse P450s but have not been characterized for their specificity. Differentiation among these P450 forms was based on RNA-PCR results. The secondary antibody used was peroxidase-labeled rabbit anti-goat IgG or goat anti-rabbit IgG, and was detected with an enhanced chemiluminescence kit. In some experiments, the optical density of detected bands was determined using a Personal Densitometer SI (Amersham Biosciences Inc.).
RNA Isolation and Qualitative RNA-PCR. Total RNA from mouse small intestinal epithelial cells was isolated with TRI Reagent according to the manufacture's instructions. RNA concentration and purity were determined spectrally, and the integrity of the RNA samples was assessed by ethidium bromide staining following agarose gel electrophoresis. RNA-PCR was performed using standard protocols as described in the instructions for the GeneAmp RNA PCR Core (Applied Biosystems) kit, and with a 9600 thermal cycler (PerkinElmer Instruments, Norwalk, CT). First-strand cDNA was synthesized with 1 μg of total RNA from small intestinal enterocytes and 2.5 μM oligo(dT)16 primer in a total volume of 20 μl. The PCR reactions were performed for 35 cycles with a 15-s denaturation at 94°C, 30 s at an optimal annealing temperature, which differed for the various P450 forms, and 30-s extension at 72°C. PCR primers, with either previously published or newly designed sequences using the Seqweb program, were synthesized by the Molecular Genetics Core Facility of the Wadsworth Center. Primer sequence and optimal annealing temperatures are as shown in Table 1. PCR products were analyzed on an agarose gel, with use of a 100-base pair marker (Invitrogen) for size determination.
Nucleotide sequences of PCR primers
Real-Time Quantitative RNA-PCR Analysis. Quantitation of each form in the CYP3A, 2B, and 2C subfamilies was carried out using the LightCycler and FastStart DNA Master SYBR Green I kit (Roche Applied Science). RT was performed as described above. The primers used were the same as described earlier. PCR was performed according to the kit instructions. PCR mixtures contained 2 μl of FastStart DNA Master SYBR Green I, 4 mM MgCl2 (except for CYP2B19, where 2 mM MgCl2 was used), an 0.5 μM concentration of each primer, and 4 μl of an undiluted or diluted (10- to 1000-fold) RT product in a total volume of 20 μl. Reactions were initiated with a denaturation/Taq activation step at 95°C for 10 min, followed by 45 cycles of 95°C for 5 s, 60°C for 15 s, and 72°C for 30 s. The specificity of the PCR products was confirmed by melting-curve analysis and ethidium bromide staining following agarose gel electrophoresis. Quantification and melting temperature determination were carried out using the LightCycler data analysis software (Roche Applied Science). A standard curve was generated by plotting the threshold cycle (Ct) value versus the log of the amount of input RNA equivalent (0.1-100 ng calculated from the dilution factor of the RT products). The fold change in the level of a P450 form (target gene) between induced and untreated small intestine samples, corrected by the level of β-actin, was determined using the following equation: Fold change = 2-Δ(ΔCt), where ΔCt = Ct(target) - Ct(β-actin) and Δ(ΔCt) = ΔCt(induced) - ΔCt(untreated).
Results
The constitutive expression of several P450 forms and their induction by several known P450 inducers in B6 mouse small intestine were examined by immunoblot analysis, with antibodies to rat CYP1A1/1A2, 2B1, 2C6, or 3A2, or to human CYP1B1 or CYP2E1. Since the antibodies to CYP2B1, CYP2C6, and CYP3A2 crossreact with different forms in the same subfamily, the signals detected represent the sum of several forms of the indicated subfamily. The antibodies to rat CYP1A1/1A2 react with both mouse CYP1A1 and CYP1A2, which were resolved on gels. CYP1A1 was expressed at very low levels in mouse small intestine (long exposures were required; data not shown), but as shown in Fig. 1, its expression was markedly induced by BNF. In the liver, constitutive expression of CYP1A1 and CYP1A2 was also not detectable (Fig. 1), although CYP1A2 was detected in untreated animals after extended exposure of the film (data not shown). However, both CYP1A1 and 1A2 were induced by BNF treatment. CYP2B and 2C were abundantly expressed in mouse small intestine and liver, and their expression was further enhanced by PB in both organs. CYP2B appeared as two bands in the liver samples, which may represent multiple forms in the CYP2B subfamily. Only one of these bands was detected in the small intestine sample. CYP3A was also expressed at relatively high levels that were further enhanced by DEX, in both small intestine and liver. These immunoblot analysis results from B6 male mice are summarized in Table 2. As previously indicated, CYP2B, CYP2C, and CYP3A were all readily detected in the small intestines of untreated and induced animals. CYP1A and CYP2E1 were detected as weak signals in the small intestine of untreated mice. All of these P450 forms were also detected in mouse liver, which was used as a positive control (data not shown). Although the signals were very weak, CYP1B1was detectable in mouse small intestine, and could be induced by BNF (data not shown).

Immunoblot analysis of P450 proteins expressed in the liver and small intestinal epithelial cells of untreated or induced B6 mice.
Induction was by i.p. administration of BNF (40 mg/kg for 3 days), PB (100 mg/kg for 2 days), or DEX (80 mg/kg for 3 days). Microsomal samples from mouse liver and small intestinal epithelial cells were resolved by electophoresis on Nu-PAGE Bio-Tris gels, transferred to nitrocellulose membrane, and examined immunochemically with goat antisera to CYP1A1/2 (1:500 dilution), CYP2B, CYP2C, and CYP3A (1:2,000 dilution), as described under Materials and Methods. Microsomal proteins were applied at 2.5 μg per lane (panels A and C) or 5 μg per lane (panels B and D) for liver microsomes, and 10 μg per lane (panels B and D) or 25 μg per lane (panels A and C) for intestinal microsomes. UT indicates samples from untreated mice. F, female mice; M, male mice.
Detection of P450 mRNAs and proteins in mouse small intestine
P450 mRNA expression was detected by RNA-PCR. P450 protein expression was detected by immunoblotting analysis.
To confirm the expression and identity of P450 forms in mouse small intestine, RNA-PCR experiments were conducted to detect P450 mRNA in total RNA from intestinal epithelial cells of untreated B6 male mice. PCR products were analyzed by agarose gel electrophoresis, and the results are summarized in Table 2. Primers specific for CYP1A1, CYP1B1, CYP2B10, CYP2B19, CYP2B20, CYP2C29, CYP2C38, CYP2C40, CYP2E1, CYP3A11, CYP3A13, CYP3A16, CYP3A25, and CYP3A44 all produced bands of the predicted size, although CYP1A1 and CYP2E1 signals were very weak. In contrast, mRNAs for CYP1A2, CYP2A4/5, CYP2A12, CYP2C37, CYP2C39, and CYP2F2 were undetectable by ethidium bromide staining of the gel. These P450 forms were all detected in RNA samples from mouse liver under identical conditions, indicating that the primer pairs are capable of amplifying the specific forms. CYP2B9 mRNA was detected only in PB-induced mouse small intestine samples.
Real-time PCR was performed to quantify the relative mRNA levels of each form in total RNA samples prepared from untreated and induced B6 male mouse small intestine, in an effort to determine the extent of induction for each form. A linear standard curve was generated for each primer pair from a serial dilution of the RT products (as templates) of the RNA samples prepared from the small intestine of untreated mice. The accuracy of quantitation was assured by ensuring that the amounts of PCR products detected in the experimental groups fell within the linear range of PCR amplification. The β-actin mRNA level, which was also determined in the same fashion in each RNA sample, was used as an internal control to normalize the RNA levels from different samples. The extent of induction for each form was determined as described under Materials and Methods. Melting-curve analysis showed that each primer pair amplified a single predominant product, which was not detected in the H2O (no-template) control. The size of the PCR product was confirmed by agarose gel electrophoresis (data not shown). As shown in Fig. 2, the mRNA levels of all five forms in the CYP3A subfamily were induced by DEX treatment, and the extent of induction ranged from 1.7- to 4.5-fold. CYP2B10 and CYP2B20 mRNAs were both induced about 10-fold, whereas the CYP2B19 mRNA level was repressed by about 50-fold after PB treatment (data not shown). CYP2B9 mRNA was also induced markedly by PB, but the extent of induction could not be quantified due to the very low constitutive level. CYP2C40 mRNA was induced about 5-fold by PB treatment, whereas CYP2C38 mRNA showed no induction. CYP2C29 mRNA was induced over 200-fold from its very low constitutive level.

Real-time quantitative RNA-PCR analysis of P450 mRNA levels for CYP2B, CYP2C, and CYP3A subfamilies in B6 male mouse small intestine.
First-strand cDNA was synthesized from total RNA extracted from mouse small intestinal epithelial cells. cDNA fragments were amplified and quantitated using a LightCycler as described under Materials and Methods. Duplicate reactions were performed for each experiment, and the values presented are the means of two or three independent experiments.
To examine the distribution of P450s along the length of the small intestine, the entire length of the small intestine was divided equally into six segments, with segment 1 being proximate to the pylorus and segment 6 proximate to the ileum. Figure 3 shows the immunoblot analysis of microsomal preparations from the different intestinal segments of untreated B6 male mice or BNF-induced B6 male mice. The expressed protein levels along the length of the small intestine for CYP3A, 2B, and 2C were examined using enterocyte microsomes from untreated mice, whereas CYP1A1 expression was examined after BNF induction, due to the very low constitutive level of CYP1A1 in mouse small intestine. The results show that all P450 forms examined occur at high concentrations at the proximal end of the small intestine and decrease toward the distal end. The induced CYP1A1 expression also occurs at the highest level at the proximal end and decreases distally.

Distribution of P450 proteins along the length of B6 male mouse small intestine.
Each segment represents approximately one-sixth of the length of the small intestine, with segment 1 proximate to the pyloric valve and segment 6 proximate to the ileum. Microsomes prepared from each intestinal segment from untreated mice or BNF-treated mice (for CYP1A1 detection) were subjected to immunoblot analysis with an antiserum to CYP2B, CYP2C, CYP3A, or CYP1A1/2, as described in the legend to Fig. 1.
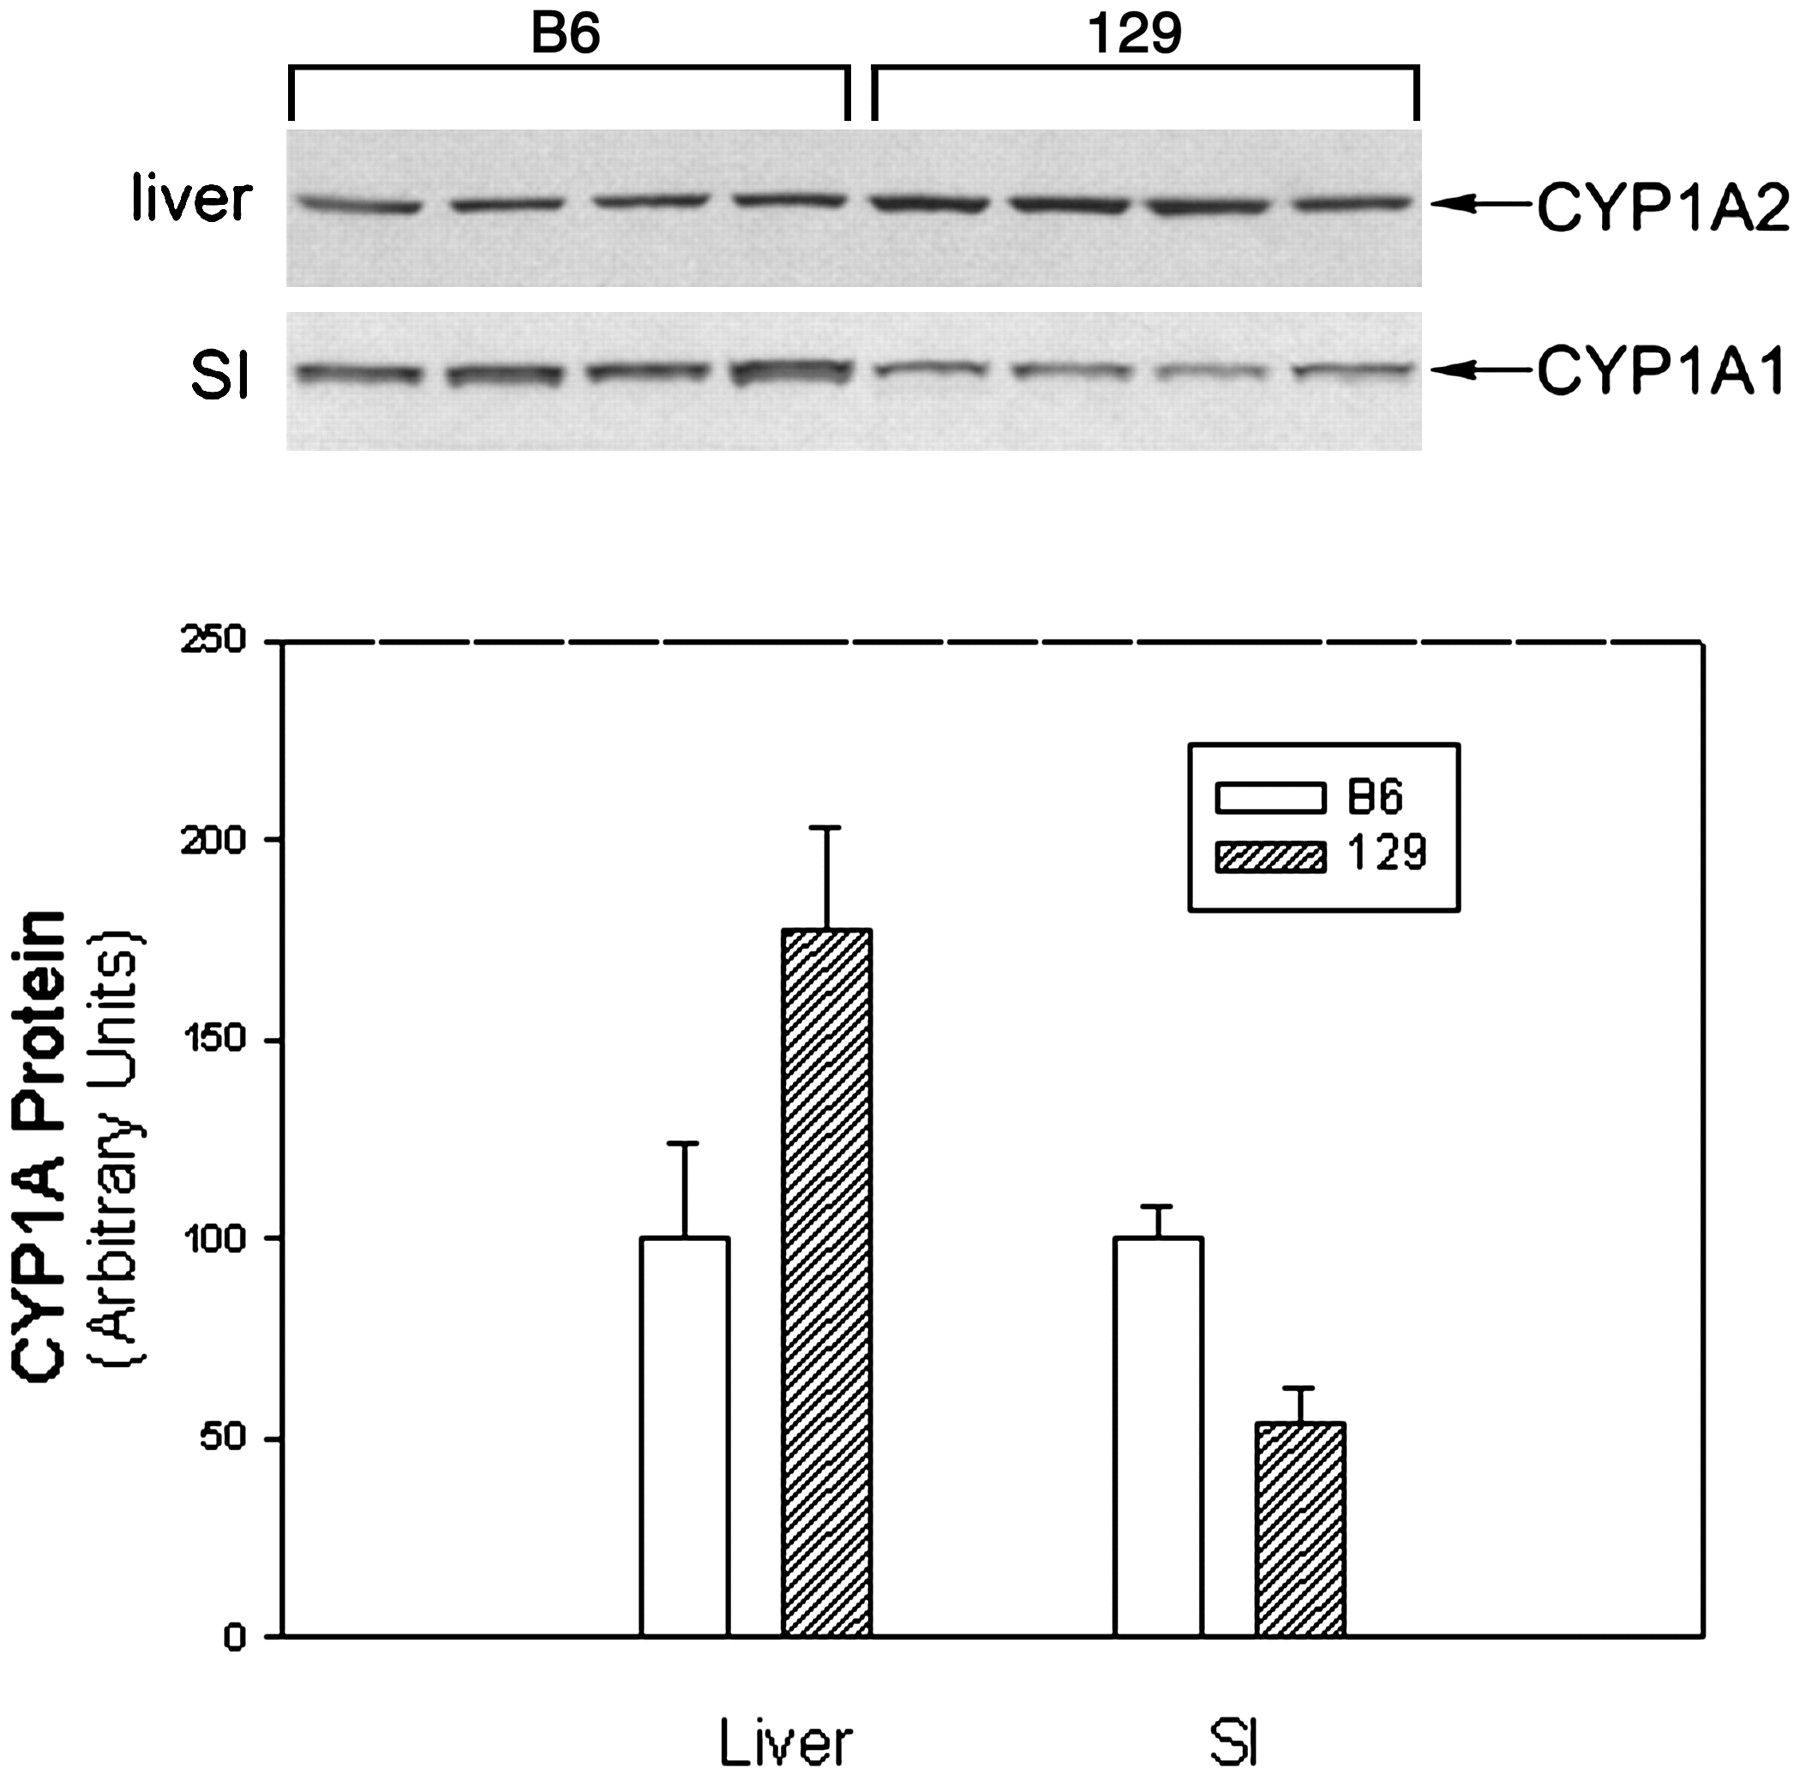
Since the 129 mouse strain is used extensively as a source of embryonic stem cells for creating knockout mice, we further examined the strain differences between B6 and 129 mice with respect to small intestinal P450 expression. There were no marked and consistent differences in the constitutive levels of CYP2B, CYP2C, and CYP3A in the small intestine between, B6 and 129 male mice (Fig. 4). B6 mice expressed slightly higher CYP1A1 levels in intestinal microsomes than did 129 mice, whereas 129 mice had slightly higher CYP1A2 in the liver than did B6 mice (Fig. 5). However, CYP1A1 can be induced to a very high level in B6 small intestine, but was not induced in the small intestine of 129 mice (Fig. 4). The induction patterns were very similar in both strains for CYP2B, CYP2C, and CYP3A (Fig. 4).
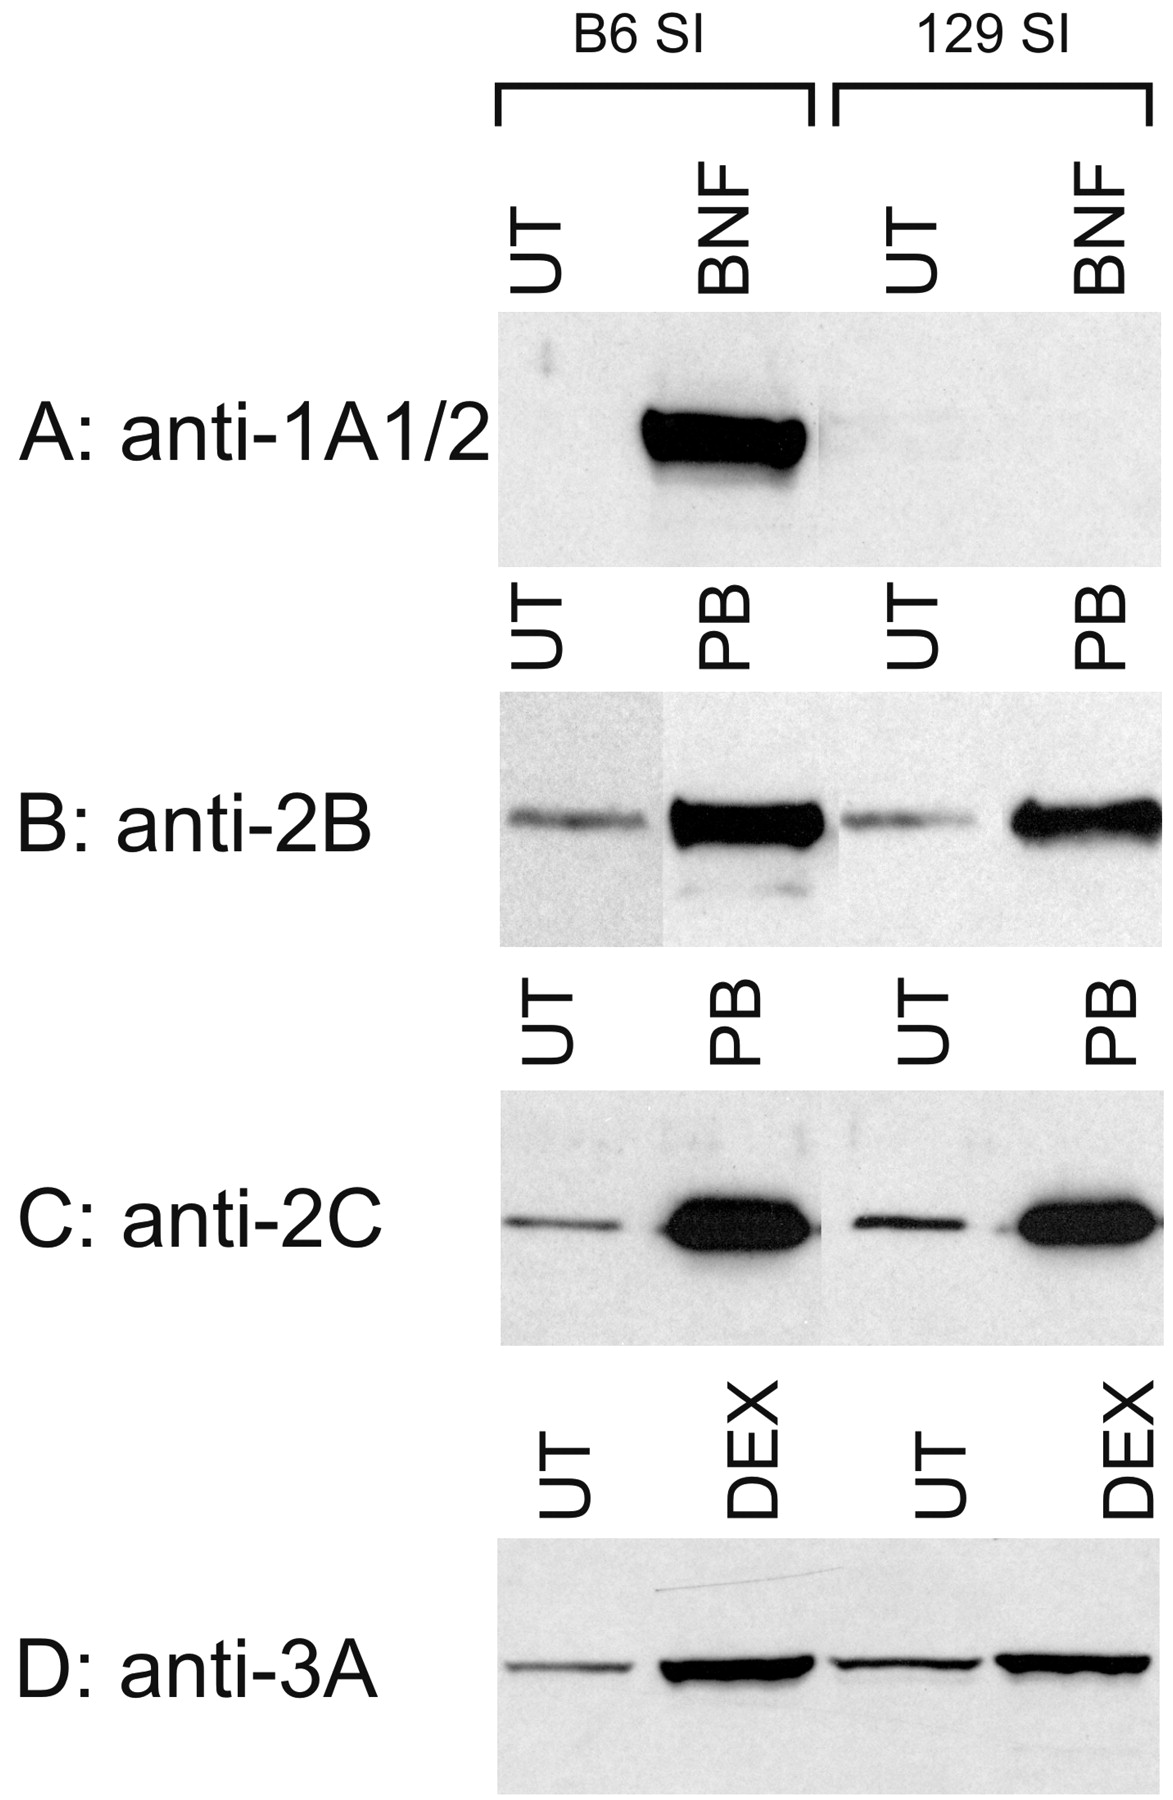
Induction of P450 proteins expressed in small intestinal epithelial cells of B6 and 129 male mice.
The mice were treated with BNF (40 mg/kg for 3 days), PB (100 mg/kg for 2 days), or DEX (80 mg/kg for 3 days). Microsomes were prepared from mouse small intestine of either untreated or treated animals and subjected to immunoblot analysis with an antiserum to CYP2B, CYP2C, CYP3A, or CYP1A1/2, as described in the legend to Fig. 1. UT, sample from untreated mice; SI, small intestine.

Expression of CYP1A proteins in the liver and small intestinal epithelial cells of B6 and 129 male mice.
Microsomes were prepared from liver and small intestine of untreated mice (n = 4). Samples were subjected to immunoblot analysis with antiserum to CYP1A1/2 as described in the legend to Fig. 1. Microsomal proteins were applied at 5 μg per lane for liver samples and 15 μg per lane for small intestine samples. The intensity of immunoreactive CYP1A1 (SI) or CYP1A2 (liver) bands (overexposed compared with Figs. 1 and 4) was quantitated by densitometry to yield the data depicted graphically in panel B.
Discussion
These studies provide an in-depth assessment of which P450 forms in families 1, 2, and 3 are expressed in the mouse small intestine, and of their potential for induction. The data provide a foundation for evaluation of the role of the small intestinal xenobiotic metabolism machinery in altering the systemic uptake of drugs and in modifying the toxicity of orally ingested pollutants. Additionally, the data will facilitate the development of knockout and transgenic mouse models for probing these roles and will permit comparisons of the small intestinal xenobiotic metabolic capacity of the mouse relative to that of humans and the rat, for application to risk assessments.
The approach of using qualitative RNA-PCR to identify specific P450 mRNA expression, and real-time RNA-PCR and immunoblot analysis to quantify P450 mRNA and protein-constitutive and -induced expression, has documented the small intestinal expression of a total of 15 P450s out of the 21 investigated.
To date, 60 forms of family 1, 2, and 3 P450 genes have been identified in the mouse genome (http://drnelson.utmem.edu/MOU.html). They comprise three family 1 members in subfamilies a and b; 49 family 2 members in subfamilies a through g, j, r through u, and w; and eight family 3 members in subfamily a. From this group of P450s, we selected those 21 forms for our study that have been previously investigated. We excluded those forms for which sequence data constitute the only available information. Additionally, we excluded the CYP2J subfamily, which has been previously reported on by our group (Xie et al., 2000), and CYP2G1, which is not expressed in the mouse small intestine (Hua et al., 1997).
A large percentage (71%) of the P450 forms investigated in this study were expressed at the mRNA level in the small intestine. Because of the lack of specific antibodies for the mouse P450s, we were unable to identify, by immunoblot analysis, the majority of the specific forms that were also detectably expressed at the protein level in the intestine. However, our data do indicate that CYP1A1, 1B1, and 2E1, and members of the CYP2B, 2C, and 3A subfamilies, are all expressed constitutively at the protein level in the mouse small intestine. In similar studies of human small intestinal P450 mRNA, CYP1A1, 1B1, 2C, 2D6, 2E1, 3A4, 3A5 (Zhang et al., 1999), 2S1 (Rylander et al., 2001), 4F12 (Hashizume et al., 2001), and 2J2 (Zeldin et al., 1997) were all expressed. However, based on immunoblot and activity assay results, a more limited array of P450 protein expression in the human small intestine has been reported, including CYP3A4, 1A1 (Zhang et al., 1999), 2C9, 2C19 (Obach et al., 2001), 2D6 (Madani et al., 1999), 3A5 (Lin et al., 2002), 2S1 (Rylander et al., 2001), 4F12 (Hashizume et al., 2001), and 2J2 (Zeldin et al., 1997).
The diminishing levels of constitutive CYP2B, 2C, and 3A subfamily proteins and BNF-induced CYP1A1 protein expression, as a function of distance along the small intestine, distally from the duodenum to the ileum, is similar to the P450 expression patterns in humans (Zhang et al., 1999) and rats (Zhang et al., 1996; 1997). Glutathione S-transferases also exhibit a similar decreasing gradation of expression profiles along the length of the human small intestine (Coles et al., 2002). These observations, together with the fact that total microsomal protein exhibits a similar decreasing concentration gradient, distally along the length of the human small intestine (Zhang et al., 1999), suggest that the decreasing expression of the P450s along the small intestine may be a general phenomenon, at least for proteins associated with the endoplasmic reticulum.
The increasing use of organ-directed gene knockout and transgenic mice to address issues of the roles of organ-specific xenobiotic metabolism and toxicity has created a need for the determination of the expression profiles of relevant genes in the organ of interest. Additionally, comparisons of wild-type and knockout or transgenic mice must incorporate potential expression differences in the mouse strains involved in the production of the knockout mice. We have thus compared small intestinal P450 expression profiles for B6 and 129 mice. Whereas CYP2B, 2C, and 3A subfamily member expression, both constitutively and following induction, was similar in the two mouse strains, constitutive CYP1A1 expression was significantly lower in 129 mice. The latter observation may be an artifact of the induction of small intestinal CYP1A1 in B6 mice by dietary factors (Zhang et al., 1997). More notably, BNF markedly induced small intestinal CYP1A1 in B6 mice, but it did not induce this form in 129 mice. The mechanism for this difference is associated with a low affinity aryl hydrocarbon receptor allele in the 129 mice (Poland et al., 1994). These studies indicate that there are differences in the P450 expression profiles of 129 and B6 mice and that extensive studies must be undertaken to reveal such differences.
Acknowledgments
We are grateful to Jill Panetta for preparation of the manuscript. The Molecular Genetics Core of the Wadsworth Center is acknowledged for the preparation of oligonucleotide primers.
Footnotes
-
↵1 Abbreviations used are: P450, cytochrome P450; B6, C57BL/6; 129, 129/sv; BNF, β-naphthoflavone; RT, reverse transcription; PCR, polymerase chain reaction; DEX, dexamethasone; PB, phenobarbital; Ct, threshold cycle.
- Received May 30, 2003.
- Accepted July 28, 2003.
- The American Society for Pharmacology and Experimental Therapeutics


