


Abstract
P-Glycoprotein (Pgp) and cytochrome P450 3A (CYP3A) are important enzymes affecting the disposition of HIV protease inhibitors (HIV PIs). After multiple dosing experiments in rats, decreases in the plasma concentrations and area under plasma concentration-time curve (AUC) for HIV PIs have been observed. The purpose of these studies was to determine the changes in Pgp and CYP3A expression and HIV PI plasma exposure after multiple doses of HIV PIs. Male rats were orally dosed with an amprenavir prodrug (450 mg/kg/day amprenavir-equivalent) or nelfinavir (175 mg/kg/day) for 1 or 14 days. Relative to day 1, theCmax and the AUC for amprenavir at day 14 were decreased by 33 and 51%, respectively. Similarly, the plasma concentration of nelfinavir at 1 h after the last dose (Cmax) was reduced by 52% after multiple doses. Compared with controls, dosing of amprenavir for 14 days increased intestinal Pgp and hepatic CYP3A protein levels by 59 and 151%, respectively, but did not alter intestinal CYP3A protein levels. In contrast, amprenavir treatment did not result in an increase in hepatic CYP3A activity. Nelfinavir treatment increased expression of intestinal Pgp and hepatic CYP3A levels by 83 and 85%, respectively, but not hepatic Pgp or intestinal CYP3A. HIV PIs also induced Pgp expression in the LS174T human intestinal cell line. These results indicate that HIV protease inhibitors induce both intestinal Pgp and hepatic CYP3A and suggest that induction of Pgp and CYP3A is a possible mechanism reducing drug exposure after multiple doses.
It has been postulated that the drug transporting P-glycoprotein (Pgp1) and cytochrome P450 3A (CYP3A) are functionally linked components of a xenobiotic detoxification cascade that limits the bioavailability of several drugs (Wacher et al., 1995). Pgp, encoded by the human MDR1 and rodentmdr1a/1b genes, is constitutively expressed in the brush border membrane of intestinal enterocytes and the canalicular membrane of hepatocytes and transports structurally and functionally diverse compounds (Ambudkar et al., 1999). Several lines of evidence indicate that Pgp plays a significant role in the oral absorption and excretion of some hydrophobic xenobiotics. Pgp limits the oral bioavailability of drugs such as Taxol, talinolol, and digoxin, and it has been shown to excrete Taxol directly across the intestinal wall (Mayer et al., 1996;Sparreboom et al., 1997; Spahn-Langguth et al., 1998). In humans, the difference in Pgp expression in duodenal enterocytes is correlated with area under plasma concentration-time curve (AUC) for digoxin (Hoffmeyer et al., 2000). CYP3A is another important component contributing to the xenobiotic detoxification pathway. CYP3A represents about 30 and 70% of total cytochrome P450 activity in liver and intestine, respectively, and is the major phase I drug-metabolizing enzyme involved in the elimination of 50% of drugs subject to P450 biotransformation in humans (Watkins et al., 1987; Kolars et al., 1994; Shimada et al., 1994). There is substantial overlap in substrate specificity between CYP3A and Pgp, and several modulators/substrates of Pgp and CYP3A have been shown to coordinately up-regulate the expression of these proteins in vitro (Schuetz et al., 1996). Altered levels of these proteins could affect the oral absorption and pharmacokinetics of some drugs.
The development of human immunodeficiency virus protease inhibitors (HIV PIs) has been a major advancement in the treatment of HIV disease. Currently available HIV PIs have a number of limitations, including low and/or variable bioavailability and limited central nervous system penetration. One of the most important factors influencing the oral bioavailability of HIV PIs is first pass metabolism (Williams and Sinko, 1999). All marketed HIV PIs are extensively metabolized by and inhibit CYP3A (Kumar et al., 1996; Decker et al., 1998; Lillibridge et al., 1998). Recent studies suggest that Pgp plays a role in limiting the oral absorption of HIV protease inhibitors. HIV PIs have higher transport rates from the basolateral to the apical direction using in vitro models such as Caco-2 or MDR1-transfected LLC-PK1 cells (Kim et al., 1998; Lee et al., 1998; Polli et al., 1999). Addition of Pgp inhibitors such as GF120918 or verapamil negated the difference in transport rates, indicating that HIV PIs are substrates for Pgp. Using Pgp-deficient mice, Kim et al. (1998) demonstrated that plasma concentrations of indinavir, nelfinavir, and saquinavir were elevated 2- to 5-fold in mdr knockout mice relative to wild-type mice after oral administration. These data indicate that Pgp can affect the disposition of HIV PIs in rodents.
Preclinical studies have shown a decreased exposure for amprenavir in rats after multiple doses (Glaxo SmithKline Inc., data on file). During a 6-month repeat dose toxicity study (doses 0, 50, 190, and 750 mg/kg/day), the day 31 AUC values were 30 to 70% lower than that on day 1 for doses greater than 50 mg/kg/day. This decrease in exposure is indicative of induction of metabolism or reduced absorption. However, in vitro studies with liver microsomes prepared from male rats dosed with amprenavir in the toxicity studies failed to demonstrate significant differences in P450 content or CYP3A activity between control and dosed animals that adequately addressed the apparent induction (Glaxo SmithKline Inc., data on file). Similar findings of decreased plasma exposure over time were seen for nelfinavir during repeat dose toxicity studies (European Public Assessment Reports,http://www.eudra.org/humandocs/humans/EPAR/Viracept). In addition to showing that the metabolic disposition of HIV PIs is a complex balance between inhibition and induction of drug metabolism enzymes, these findings suggested that other pathways could contribute to the decreased exposure.
The present studies were designed to determine the change in expression of Pgp and CYP3A in rat intestine and liver, and to determine HIV PI plasma concentrations after multiple oral doses. The results demonstrate that HIV PI treatment increased protein levels of both intestinal Pgp and hepatic CYP3A, suggesting that induction of Pgp and CYP3A contributes to decreased plasma exposure in rats after multiple doses.
Experimental Procedures
Animals.
Male Han Wistar rats (200–250 g) were obtained from Charles Rivers Labs (Raleigh, NC). Animals had free access to food and water and were maintained on 12-h light and 12-h night cycles. Rats were housed at the Glaxo SmithKline Inc.'s animal facility for at least a week before use. Study protocols were approved by the Institutional Animal Care and Use Committee. Rats were randomly separated into groups, and each group comprised four to five rats. Rats were orally dosed with vehicle or drug, and the total daily dose was divided into two equal doses, with the second daily dose given 6 h after the first.
For amprenavir treatments, rats were given the amprenavir prodrug (GW433908) at amprenavir-equivalents of 139 or 450 mg/kg/day for 7 or 14 days. The amprenavir prodrug was dissolved in a vehicle of 0.5% hydroxypropylmethylcellulose (HPMC) and 1% Tween 80. Doses were selected according to the data from previous toxicology and pharmacokinetic studies. At day 7 and day 14, animals were euthanized with CO2, and tissues were collected for Western Blot analysis. Intestinal tissue was processed immediately, and liver tissue was frozen in liquid nitrogen and stored at −80°C until use.
To determine the plasma exposure of amprenavir after multiple doses, rats were treated with vehicle or amprenavir prodrug (450 mg/kg/day amprenavir-equivalents) for 13 days. On day 11, a jugular vein cannula was implanted under isoflurane anesthesia for future blood collection. After the surgery, rats were housed individually in plastic metabolism cages and were unrestrained throughout the experiment. On day 14, all rats were dosed with amprenavir with the first half of the daily dose given at time 0 and the second half at 6 h. Blood samples (∼300 μl) were collected from the implanted cannula at predetermined times, and the plasma samples were stored at −20°C until analysis. Animals treated with vehicle for 13 days and then dosed with amprenavir on day 14 were considered the day 1 animals; this was done to control for any effect of the 0.5% HPMC/1% Tween vehicle.
For nelfinavir treatment, rats were given 175 mg/kg/day nelfinavir mesylate (Pediatric Formulation, 50 mg/g, Agouron, La Jolla, CA) suspended in water and administered orally twice a day for 14 days. The viscosity of the formulation limited the maximum dose of nelfinavir to 175 mg/kg/day. Blood samples were taken 1 h after the last dose on day 14 from the tail vein while the animal was under isoflurane anesthesia.
Isolation of Intestinal Brush Border and Hepatic Crude Membranes.
Intestinal brush border membrane (BBM) was prepared by a modified calcium precipitation method (Kessler et al., 1978). A length of 60 cm of intestine below the stomach was isolated and flushed with phosphate-buffered saline. The intestine was opened and laid on a chilled glass plate. Intestinal tissue was collected by scraping and homogenized with a glass Dounce homogenizer (60 strokes with a loose fitting pestle) in BBM buffer (20 ml/g of tissue; 50 mM mannitol, 2 mM Tris-HCl, pH 7.5, 25 μg/ml leupeptin, 5 μg/ml aprotinin, 1 mM PMSF, 50 μg/ml benzamide, and 0.5 μg/ml pepstatin A). CaCl2 was added to a final concentration of 10 mM to the homogenate; the homogenate was stirred for 2 min and was then allowed to settle for 30 to 45 min at 4°C. The homogenate was centrifuged for 15 min at 3,000g, and the resulting supernatant was centrifuged at 27,000g for 30 min. The pellet was resuspended in buffer (300 mM mannitol, 10 mM HEPES/Tris, pH 7.5, containing 40 μg/ml PMSF).
Hepatic crude membranes were prepared as described (Trauner et al., 1997). One gram of frozen liver was homogenized in 10 ml of ice-cold homogenization buffer (0.25 M sucrose, 10 mM Tris-HCl, pH 7.5, 25 μg/ml leupeptin, 5 μg/ml aprotinin, 1 mM PMSF, 50 μg/ml benzamidine, and 0.5 μg/ml pepstatin) with a glass Dounce homogenizer (50 strokes with a loose fitting pestle). Liver homogenates were centrifuged at 2,000g to remove nuclei and nondisrupted cells, and the resulting supernatants were centrifuged at 100,000g for 1 h. The pellets were resuspended in homogenization buffer, and protein concentration was determined with bicinchoninic acid protein assay kit (Pierce, Rockford, IL).
Cytochrome P450 3A Activity.
Briefly, 1 g of frozen liver was homogenized in 4 ml of 10 mM potassium phosphate buffer, pH 7.4, containing 10 mM EDTA and 1.15% KCl. The S9 fraction was centrifuged at 100,000g for 70 min, and the pellets were resuspended in buffer containing 50 mM potassium phosphate, 0.25 sucrose, and 0.1 mM EDTA. The metabolism of midazolam was used to determine CYP3A activity. Incubation mixtures contained 50 mM potassium phosphate buffer, pH 7.4, 100 μM midazolam, and 125 μg of microsomes and were preincubated at 37°C for 5 min. The reaction was initiated by the addition of NADPH and terminated by the addition of acetonitrile after 20 min. The mixture was centrifuged for 5 min (12,000g) and the supernatant transferred for quantitative analysis of midazolam and its metabolites by HPLC with liquid chromatography/tandem mass spectrometry (LC/MS/MS).
LS174T Cell Culture.
The human colon adenocarcinoma cell line (LS174T) was obtained from Glaxo SmithKline BioResources and cultured in Minimal Essential Media (Life Technologies, Gaithersburg, MD) supplemented with 10% fetal bovine serum, 0.1 mM nonessential amino acid solution, and 1 mM pyruvic acid. The medium was changed every 3 days, and cells were subcultured at ratio of 1:5 to 1:10. At 50% confluence, cells were treated with drugs dissolved in DMSO. Solvent controls contained 0.05% DMSO. Exposures were continued for 72 h or the indicated time, after which cells were washed with phosphate-buffered saline, harvested, and then stored at −80°C before use.
Western Blot Analysis.
Samples of hepatic crude membranes (50 μg), intestinal BBM (20 μg for Pgp), or intestinal mucosa homogenate (75 μg for CYP3A) were resolved on 8 or 12% SDS-polyacrylamide gel electrophoretic precast mini-gels and transferred to nitrocellulose membrane following the protocol provided by the manufacture (Novex, San Diego, CA). The blots were stained with Ponceau S solution (0.1% Ponceau S in 5% acetic acid, Sigma, St. Louis, MO) to confirm equal loading of protein. Blots were incubated with the C219 anti-Pgp antibody (diluted 200–400-fold, Signet Laboratories, Inc., Dedham, MA), the MDR1-specific mAb p170/Mdr1-Ab2 (Lab Vision, Fremont, CA), or an anti-rat CYP3A1/2 antibody (diluted 1000–2000-fold, Xenotech, Kansas City, KS) in Blotto blocking buffer (Pierce, Rockford, IL) overnight at 4°C. The blots were washed three times with Tris-buffered saline containing 0.01% Tween 20 and incubated with a horseradish peroxidase-conjugated secondary antibody (Amersham Pharmacia Biotech UK, Ltd., Buckinghamshire, UK) for 2 h at room temperature. After the blots were washed three times with Tris-buffered saline, immunoreactive bands were visualized by using the enhanced chemiluminescence plus detection system (Amersham Pharmacia Biotech UK, Ltd.). The enhanced chemiluminescence plus stained blots were exposed to film for autoradiograph or scanned directly for quantification by using a Molecular Dynamics Storm 860 and ImageQuant 5.0 software (Molecular Dynamics, Sunnyvale, CA).
Analytical Methods.
Plasma concentrations of the amprenavir prodrug, amprenavir, and nelfinavir were determined by HPLC with LC/MS/MS. After addition of 200 μl of internal standard ([13C6]amprenavir, 1000 ng/ml dissolved in acetonitrile) to 100 μl of plasma samples or calibration standards, the samples were vortex and centrifuged. The supernatant (100 μl) was diluted with 100 μl of 0.1% formic acid and 400 μl of 50:50 water/acetonitrile. These samples (injection volume, 10 or 20 μl) were loaded on the HPLC column by means of a Gilson 215 autosampler controlled using a proprietary software add-in to HP Chemstation. HPLC was performed by using a Hewlett Packard 1100 chromatograph equipped with a column-switching valve, and chromatography was performed on either a 30- or 50- × 2-mm (i.d.), 3-μm Phenomenex Aqua C18 (Phenomenex, Torrance, CA) column at a flow rate of 0.6 or 0.325 ml/min, respectively. The mobile phase consisted of two solvents: A) 10 mM ammonium formate pH 3.5 with 1.5% (v/v) methanol, and B) 100% acetonitrile. The gradient profile for 0.325 ml/min flow rates was 0 to 3 min, 1% (v/v) B; 3 to 4.5 min, linear gradient to 95% (v/v) B; 4.5 to 5.9 min, 95% (v/v) B; 5.9 to 6.0 min, linear gradient to 1% (v/v) B; and 6.0 to 9.0 min, 1% (v/v) B. Gradient times were halved for the 0.6-ml/min flow rate method. Mass spectrometry was performed on a PE Sciex API2000 mass spectrometer equipped with a turbo ion spray source for electrospray ionization in the positive ion mode (PE Sciex, ON, Canada). An equivalent method using dual LC/MS/MS was used to determine midazolam and 1′-OH and 4-OH metabolites (Wring et al., 2000).
Pharmacokinetic and Statistical Analysis.
A noncompartmental pharmacokinetics model was used to calculate the area under plasma concentration-time curves by the linear trapezoidal method using WinNonlin 3.0 software (Pharsight Corporation, Mountain View, CA). Statistical differences were determined by one-way analysis of variance, followed by a multiple comparisons test, or by using the unpaired Student's t test with Prism 2.0 software (GraphPad Software, Inc., San Diego, CA). The significance level wasp < 0.05.
Results
Plasma Concentrations of Amprenavir and Nelfinavir after Multiple Dosing.
After dosing of the amprenavir prodrug, the majority of the prodrug was converted rapidly to amprenavir with prodrug plasma concentrations being <2% of amprenavir plasma concentrations (data not shown). The comparisons of plasma concentration between day 1 and day 14 for amprenavir are shown graphically in Fig. 1and quantified in Table1. Relative to day 1, theCmax and AUC at day 14 were decreased by 33 and 51%, respectively. The loss of plasma exposure was greater after the first dose than after the second with AUC0→6 h on day 14 being 63% lower than day 1 and AUC 6→24 h on day 14 being 43% lower than day 1 (Table 1). After treatment for 14 days, the plasma concentrations of nelfinavir at 1 h after the last dose were reduced 52% relative to day 1 (Table 1).

Plasma concentrations of amprenavir in rats treated for 1 and 14 days.
Rats were dosed with vehicle or amprenavir prodrug (450 mg/kg/day amprenavir-equivalents, twice a day) for 13 days. At day 14, all the rats were given amprenavir prodrug at 0 and 6 h. Values represent means ± S.E. from 3 to 4 rats.
Plasma exposure of amprenavir and nelfinavir after multiple doses
Effect of Amprenavir on Pgp Expression in Intestine and Liver.
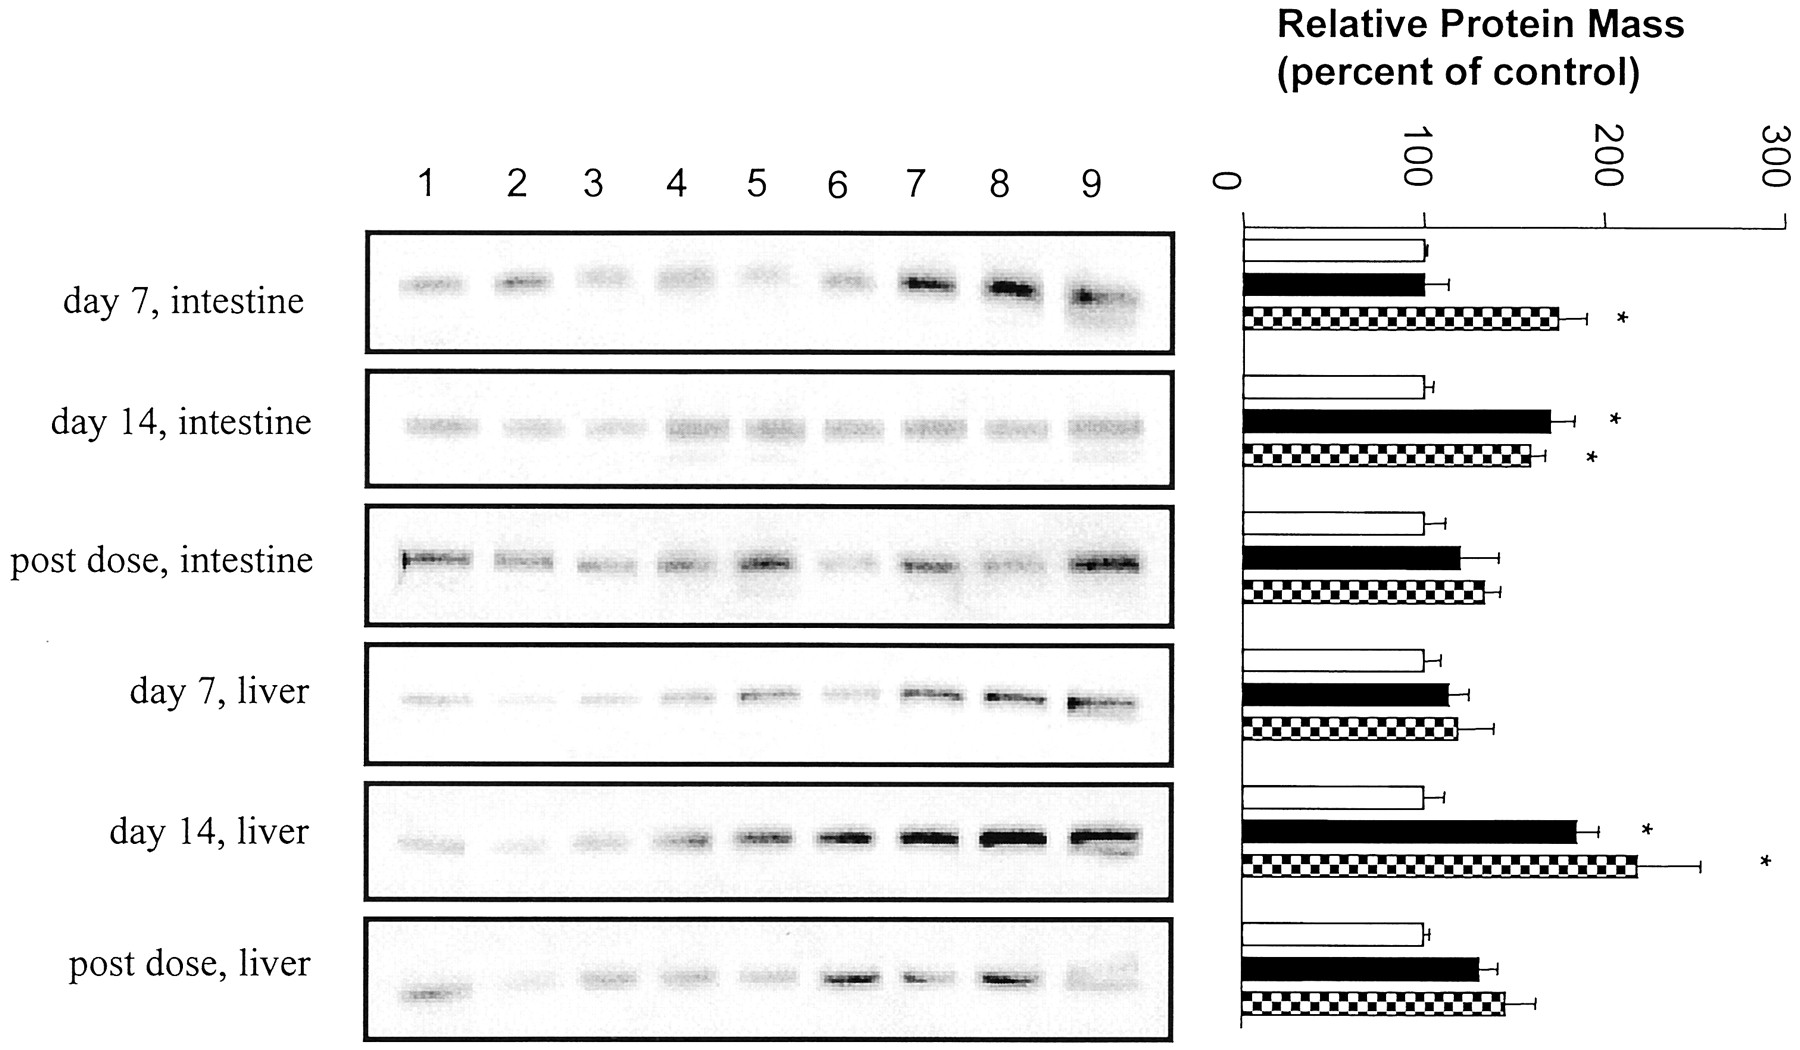
After 7 or 14 days of treatment, there were no significant differences in liver weight or liver/body weight ratios between the vehicle and amprenavir- or nelfinavir-treated rats (data not shown). To determine the effect of multiple doses of HIV PIs on the expression of intestinal and hepatic Pgp, protein levels were determined by Western blot analysis using the C219 and p170/Mdr1-Ab2 antibodies. Intestinal BBM and hepatic crude membranes were isolated from rats treated for 7 or 14 days with vehicle (0.5% HPMC/0.1% Tween 80) or 139 or 450/mg/kg/day amprenavir. The C219 anti-Pgp antibody recognized a protein band of about 150 kDa consistent with the known molecular mass of Pgp. Compared with vehicle-treated rats, dosing of 139 mg/kg/day amprenavir for 7 days did not alter intestinal Pgp levels (Fig.2). In contrast, there was a 71% increase in Pgp immunoreactive protein in the intestinal BBM from animals treated at this dose for 14 days. Treatment with 450 mg/kg/day amprenavir increased intestinal Pgp levels by 75% at day 7 and 59% at day 14. The intestinal Pgp expression at day 14 detected with the p170/Mdr1-Ab2 antibody was very similar to that obtained with C219 (data provided to reviewers). Intestinal Pgp expression returned to control levels by 5 days after the last dose.

Western blot analysis of P-glycoprotein expression in intestine and liver from rats treated with vehicle (lanes 1–3, ■), 139 mg/kg/day (lanes 4–6, ▪), or 450 mg/kg/day amprenavir (lanes 7–9, ▩).
The blots were probed with C219. Left, autoradiographs of Western blots. Right, quantitative analysis of Western blots. Values represent means ± S.E. from three rats. *p < 0.05. Post-dose tissue was taken from animals 5 days after the final dose.
Compared with vehicle-treated rats, 7-day treatment of amprenavir at either the 139 or 450 mg/kg/day dose did not significantly alter hepatic expression of Pgp as detected with the C219 (Fig. 2). In contrast, treatment for 14 days with 139 or 450 mg/kg/day amprenavir resulted in an 85 and 119% increase in hepatic Pgp levels detected with the C219 antibody. However, Pgp immunoreactivity detected with p170/Mdr1-Ab2 was weak, indicating that other Pgp isoforms besidesmdr1a/1b were up-regulated (data provided to reviewers). Expression levels of these isoforms returned to control levels by 5 days after the last dose.
Effect of Amprenavir on CYP3A Expression in Liver and Intestine.
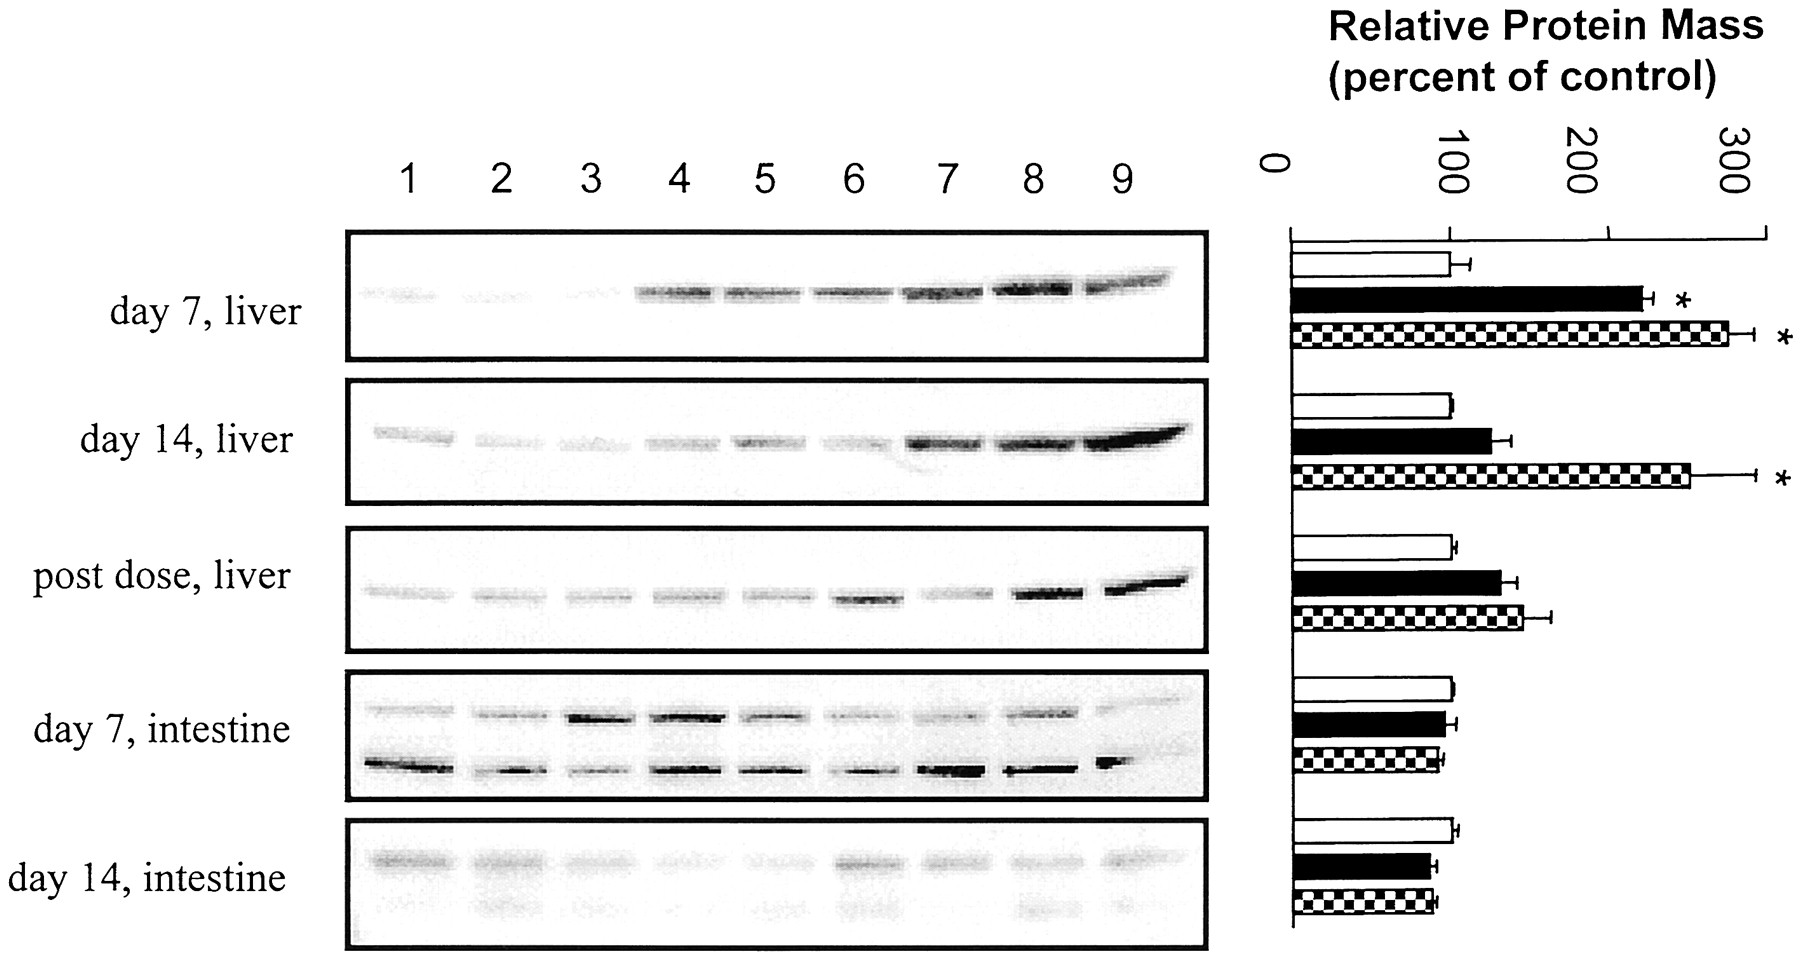
The hepatic CYP3A protein levels were increased by 121% after 139-mg/kg/day and 175% after 450-mg/kg/day amprenavir treatment for 7 days (Fig. 3). Animals treated with 450 mg/kg/day amprenavir for 14 days had 151% higher hepatic CYP3A protein level, and those treated with 139 mg/kg/day were not significantly different from vehicle-treated animals. Similar to the Pgp findings, hepatic CYP3A expression returned to control levels by 5 days after the last dose. In contrast to the increased hepatic CYP3A protein expression, CYP3A activity, as measured by the microsomal metabolism of midazolam, was not significantly different (p > 0.05) between control and amprenavir-treated animals (Table2).

Western blot analysis of cytochrome 3A expression in intestine and liver from rats treated with vehicle (lanes 1–3, ■), 139 mg/kg/day (lanes 4–6, ▪), or 450 mg/kg/day amprenavir (lanes 7–9, ▩).
The blots were probed with anti-rat CYP3A1/2 antibody. Left, autoradiographs of Western blots. Right, quantitative analysis of Western blots. Values represent means ± S.E. from three rats. *p < 0.05. Post-dose tissue was taken from animals 5 days after the final dose.
In vitro metabolism of midazolam in microsomes isolated from rats treated with amprenavir for 14 days
Homogenates of intestinal mucosa were used to determine the expression of intestinal CYP3A. Two bands were observed in this tissue. The molecular mass of the upper band was approximately 60 kDa and corresponds to the molecular mass of hepatic CYP3A. The lower band is approximately 50 kDa and may be a CYP3A degradation product. In contrast to significantly increased hepatic CYP3A expression, amprenavir treatment at either dose given for 7 or 14 days had no significant effect on CYP3A protein level in intestine (Fig. 3).
Effect of Nelfinavir on Pgp and CYP3A Expression in Intestine and Liver.
Intestinal Pgp expression was increased 83% by the treatment with nelfinavir (175 mg/kg/day) for 14 days (Fig.4). However, there was no significant difference in hepatic Pgp between nelfinavir-treated and vehicle-treated groups. Nelfinavir treatment increased hepatic CYP3A by 85%, but it did not alter the expression of intestinal CYP3A.

Effect of nelfinavir on Pgp and CYP3A expression in intestine and liver from control (lanes 1–4, ■) and rats treated with nelfinavir for 14 days (lanes 5–8, ░).
The blots were probed with C219 or anti-rat CYP3A1/2 antibody. Left, autoradiograph of Western blots. Right, quantitative analysis of Western blots. Values represent means ± S.E. from four rats.*p < 0.05.
Effect of HIV PIs on Pgp Expression in LS174T Cells.
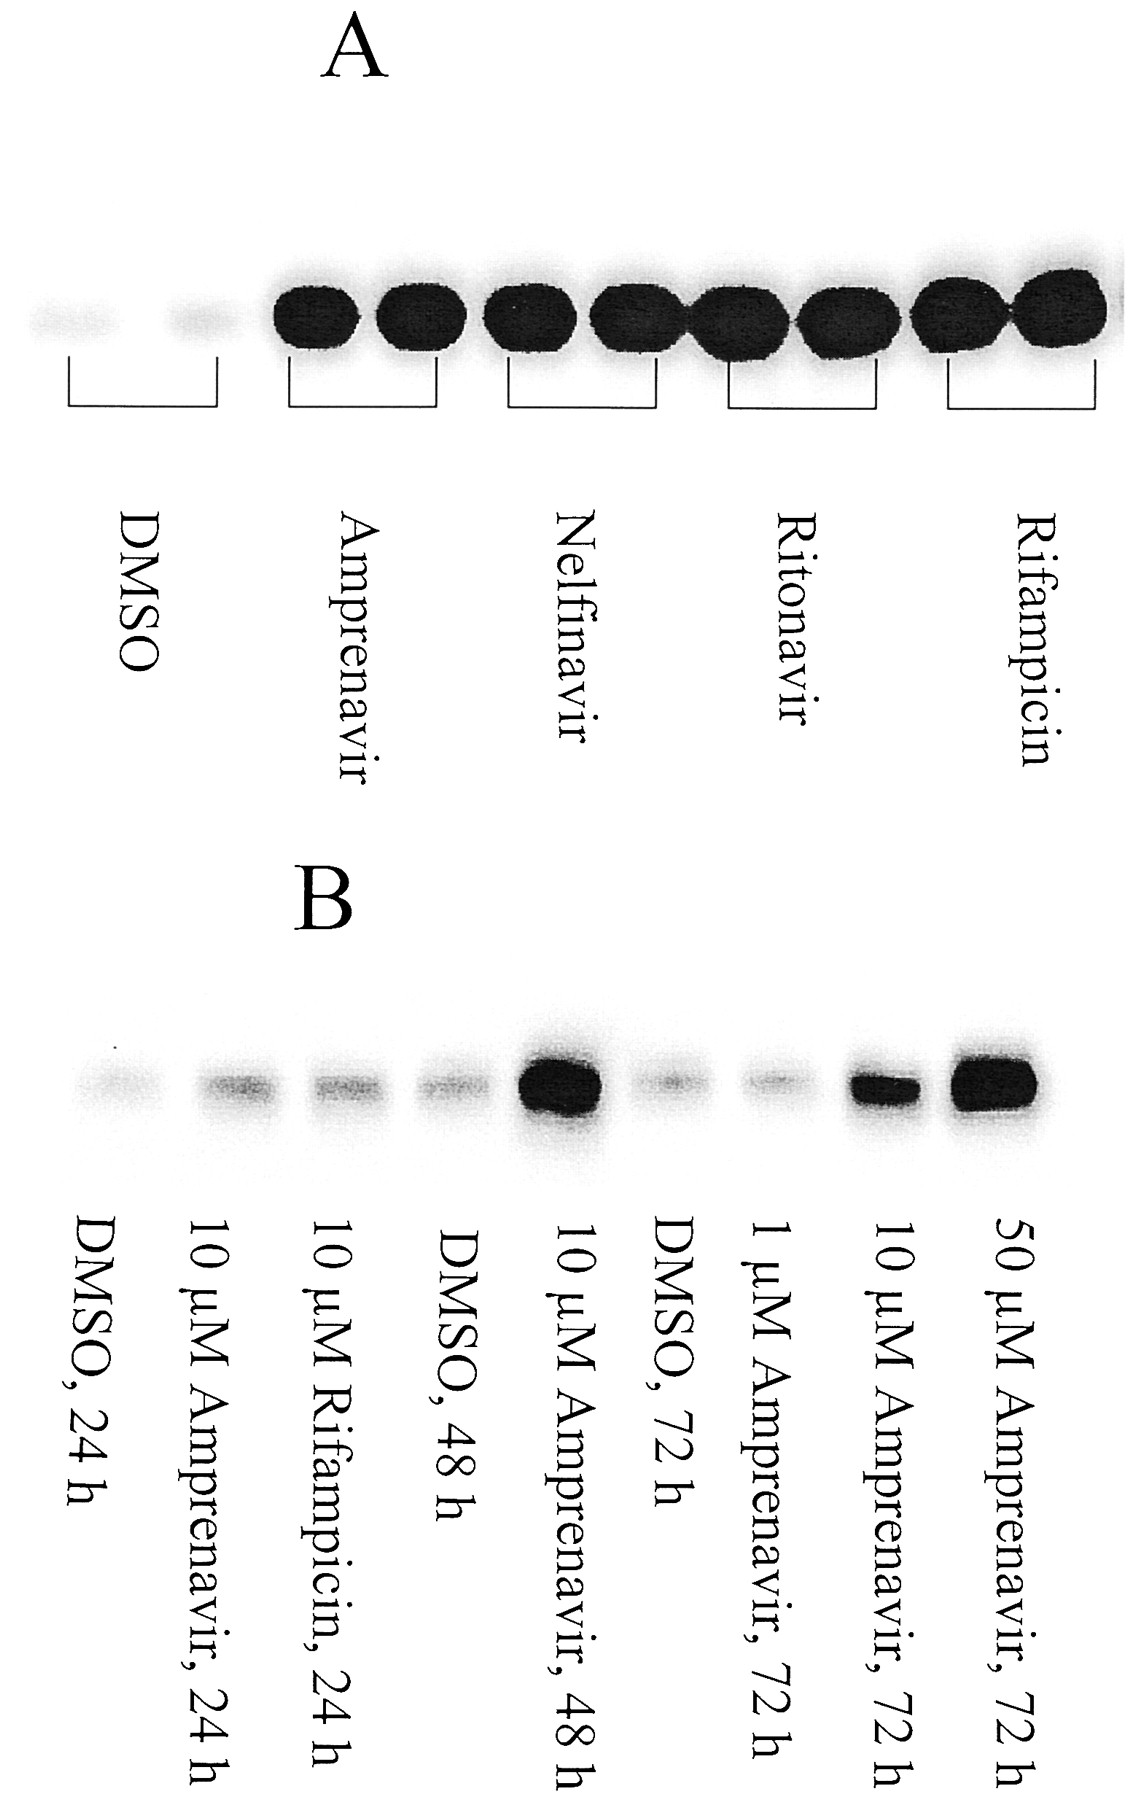
In vitro studies using the LS174T human colon adenocarcinoma cell line were completed to determine whether human Pgp expression was induced by HIV PIs. Western blot analysis using C219 revealed that Pgp was readily detectable in untreated cells and that Pgp expression was strongly induced by the treatment of amprenavir in a dose- and time-dependent manner (Fig. 5). Similar effects were observed for nelfinavir, ritonavir, and rifampicin (Fig. 5).

Induction of P-glycoprotein expression by HIV PIs in LS174T cells.
Whole cell lysates (50 μg) were subjected to electrophoresis, and the blots were probed with C219. A, cells were treated with 10 μM drugs for 72 h; B, dose and time dependence of Pgp induction by amprenavir.
Discussion
The present studies demonstrated that intestinal Pgp and hepatic CYP3A were induced by HIV PIs in rats. Treatment with 450 mg/kg/day amprenavir for 7 or 14 days increased intestinal Pgp and hepatic CYP3A protein levels. Similarly, nelfinavir treatment induced expression of intestinal Pgp and hepatic CYP3A. Interestingly, treatment with 139 mg/kg/day amprenavir for 7 days did not alter intestinal Pgp levels but did increase hepatic CYP3A expression, whereas 14 days of this treatment increased intestinal Pgp but not hepatic CYP3A. These data are in agreement with the report that Pgp serves as an upstream regulator of hepatic P450 expression (Schuetz et al., 2000).
No significant induction effect on hepatic Pgp expression was observed for nelfinavir treatment or 7-day treatment with amprenavir. However, elevated hepatic Pgp levels were seen in animals treated with amprenavir for 14 days when the C219 antibody was used. This antibody cross-reacts with Mdr1-type Pgp (drug-transporting pump), Mdr2 Pgp (a phospholipid translocase), and sister Pgp (a bile salt export pump), all of which are expressed in liver (Georges et al., 1990;Buschman et al., 1992; Childs et al., 1995; Gerloff et al., 1998). Studies with the p170/Mdr1-Ab2 antibody directed specifically against human MDR1 only detected a weak Pgp immunoreactive band, which suggests that other Pgp isoforms besides mdr1a/1b were up-regulated by amprenavir treatment. These results are consistent with previous studies which demonstrated that increased liver Pgp expression by dexamethasone treatment is mainly due to Mdr2 up-regulation (Salphati and Benet, 1998; Demeule et al., 1999). Whether HIV PIs are excreted significantly by hepatic Pgp has not been definitively determined; however, it is likely that hepatic Pgp does not play a major role in the overall elimination process of HIV PIs (Lin et al., 1999).
Although both amprenavir and nelfinavir induced hepatic CYP3A, the present studies showed that amprenavir and nelfinavir treatments did not alter the intestinal CYP3A protein levels in rat. These data indicate that CYP3A expression in the liver and intestine are not coordinately regulated in rats. These findings are consistent with human studies showing that hepatic CYP3A4 activity did not correlate with intestinal CYP3A4 activity or protein content (Lown et al., 1994).
The present studies show that relative to day 1, the plasma exposure of amprenavir and nelfinavir was reduced significantly after dosing for 14 days in rats. Similar phenomena were observed in human. After administration of a single oral dose of 1200 mg of amprenavir in HIV-infected patients, AUC0→∞ andCmax were 47.1 h · μg/ml and 9.1 μg/ml, respectively (Sadler et al., 1999). In contrast, the AUC0–12 and Cmaxwere 18.5 h · μg/ml and 5.4 μg/ml, respectively, in the patients given 1200 mg of amprenavir twice a day for 3 weeks (Agenerase, product inserts, Glaxo SmithKline Inc.). Decreased exposure after multiple doses has also been reported for ritonavir and nelfinavir in human. At a fixed dose, the steady-state trough plasma concentrations of ritonavir decrease 30 to 70% over 2 weeks (Hsu et al., 1997). A greater than dose-proportional increase in nelfinavir plasma concentrations was observed after single doses, suggesting enzyme saturation; however, this did not occur after multiple doses (Viracept, product inserts, Agouron). In a 9-day multiple dose study, a peak in AUC for nelfinavir was observed on day 3 with a value 3-fold higher than the AUC determined on day 1. By day 9, the exposure dropped to 1.5-fold the day-1 AUC (Bardsley-Elliot and Plosker, 2000). These data suggest that in humans, HIV protease inhibitors also auto-induce enzyme/proteins, likely both CYP3A and Pgp. The strong induction of MDR1 Pgp level by amprenavir, nelfinavir, and ritonavir in the LS174T human intestine cell line further suggests the induction of intestinal Pgp by HIV PIs in humans.
The importance of CYP3A induction in drug disposition has been well documented (Flexner, 1998). Although Western blot results showed that amprenavir and nelfinavir induced hepatic CYP3A, both compounds also inhibit CYP3A4 with a KI ∼ 0.5 μM (Decker et al., 1998; Flexner, 1998), thus complicating the balance between the effect of CYP3A induction and inhibition. The results from this study demonstrate that the metabolism of midazolam was not different between control and treated animals even though CYP3A protein levels were significantly higher in the treated group. This suggests that induction of CYP3A alone was not sufficient to explain the decreased exposure of amprenavir seen after multiple doses in rats. The induction of intestinal Pgp may contribute to the decreased exposure in concert with induction of CYP3A. For example, it has been reported for indinavir that more metabolite was produced by Caco-2 cells expressing CYP3A4 when Pgp efflux was present (Hochman et al., 2000). Furthermore, Pgp appears to increase the intestinal metabolism of indinavir in vivo (Lin et al., 1999). Considering that CYP3A and Pgp may function in concert to prevent entry of certain xenobiotics into the body, induction of CYP3A and Pgp is a likely mechanism that causes the decreased exposure of HIV PIs after multiple dosing in rats. Alternatively, changes in the concentration of α1-acid glycoprotein in HIV-positive patients has been suggested to contribute to the loss of amprenavir exposure in humans (Sadler et al., 2001).
Drug-drug interactions at the level of Pgp have not been well defined. Recent reports indicate that potential drug interactions can arise from Pgp induction in humans. For example, a single dose of St John's Wort had no effect on the steady-state pharmacokinetics of digoxin, while after multiple doses, trough plasma concentrations andCmax values for digoxin were reduced (Johne et al., 1999). This effect has been suggested to be due to induction of Pgp, as digoxin has only a minor P450-dependent metabolism (Lacarelle et al., 1991). Concomitant administration of rifampin reduced digoxin and talinolol plasma concentrations substantially after oral administration, and this effect was attributed to increased expression of Pgp in intestine by rifampin (Greiner et al., 1999; Westphal et al., 2000). Knowledge that intestinal Pgp can be induced by HIV PIs raises the possibility of clinically important drug interactions at this membrane transport protein.
In summary, HIV PIs induce both intestinal Pgp and hepatic CYP3A, but not intestinal CYP3A after multiple doses in rats. The plasma concentrations of amprenavir and nelfinavir were significantly decreased at day 14 relative to day 1. These data suggest that induction of Pgp along with induction of CYP3A may contribute to decreased exposure of HIV PIs in rats after multiple doses and may be involved in drug-drug interactions.
Acknowledgments
We thank members of the Bioscience Support Group who assisted with the in vivo portion of these studies, and Ronald Laethem for his assistance with the midazolam metabolism studies. Liyue Huang is a Glaxo SmithKline Group Development Operations (GDO) Postdoctoral Fellow.
Footnotes
-
Send reprint requests to: Dr. Joseph W. Polli, Bioanalysis and Drug Metabolism, Glaxo SmithKline, Inc., Rm. MAI.A3666, P.O. Box 13398, Research Triangle Park, NC 27709-3398. E-mail:JP16063{at}glaxowellcome.com
- Abbreviations used are::
- Pgp
- P-glycoprotein
- AUC
- area under plasma concentration-time curve
- BBM
- brush border membrane
- CYP3A
- cytochrome P450 3A
- HIV PI
- human immunodeficiency virus protease inhibitor
- P450
- cytochrome P450
- HPMC
- hydroxypropylmethylcellulose
- PMSF
- phenylmethylsulfonyl fluoride
- HPLC
- high-performance liquid chromatography
- LC/MS/MS
- liquid chromatography tandem mass spectrometry
- MDR
- multidrug resistance
- DMSO
- dimethyl sulfoxide
- Received August 14, 2000.
- Accepted January 19, 2001.
- The American Society for Pharmacology and Experimental Therapeutics


