


Abstract
Acetaminophen (APAP) is safe at therapeutic levels but causes hepatotoxicity via N-acetyl-p-benzoquinone imine-induced oxidative stress upon overdose. To determine the effect of human (h) pregnane X receptor (PXR) activation and CYP3A4 induction on APAP-induced hepatotoxicity, mice humanized for PXR and CYP3A4 (TgCYP3A4/hPXR) were treated with APAP and rifampicin. Human PXR activation and CYP3A4 induction enhanced APAP-induced hepatotoxicity as revealed by hepatic alanine aminotransferase (ALT) and aspartate aminotransferase (AST) activities elevated in serum, and hepatic necrosis after coadministration of rifampicin and APAP, compared with APAP administration alone. In contrast, hPXR mice, wild-type mice, and Pxr-null mice exhibited significantly lower ALT/AST levels compared with TgCYP3A4/hPXR mice after APAP administration. Toxicity was coincident with depletion of hepatic glutathione and increased production of hydrogen peroxide, suggesting increased oxidative stress upon hPXR activation. Moreover, mRNA analysis demonstrated that CYP3A4 and other PXR target genes were significantly induced by rifampicin treatment. Urinary metabolomic analysis indicated that cysteine-APAP and its metabolite S-(5-acetylamino-2-hydroxyphenyl)mercaptopyruvic acid were the major contributors to the toxic phenotype. Quantification of plasma APAP metabolites indicated that the APAP dimer formed coincident with increased oxidative stress. In addition, serum metabolomics revealed reduction of lysophosphatidylcholine in the APAP-treated groups. These findings demonstrated that human PXR is involved in regulation of APAP-induced toxicity through CYP3A4-mediated hepatic metabolism of APAP in the presence of PXR ligands.
Acetaminophen (APAP) is the most common nonprescription analgesic widely used for pain relief and antipyresis (D'Arcy, 1997). However, APAP has also been extensively characterized as a compound that causes liver and kidney toxicities upon overdose. The reactive metabolite, N-acetyl-p-benzoquinone imine (NAPQ1), is generated from APAP oxidized by hepatic cytochromes P450 (P450), which triggers hepatic toxicity through mitochondrial injury, apoptosis, and cell necrosis, possibly through covalently binding with nucleophilic macromolecules such as DNA or proteins and/or by elevating oxidative stress (Mazer and Perrone, 2008).
Multiple P450s can convert APAP to NAPQI, including CYP2E1 (Raucy et al., 1989), CYP1A2 (Raucy et al., 1989), CYP3A (Guo et al., 2004), CYP2A6 (Chen et al., 1998) and CYP2D6 (Dong et al., 2000). Of these, CYP2E1, CYP1A2, and CYP3A have been implicated in APAP-induced toxicity. In vivo studies established that APAP-induced toxicity is higher in wild-type mice than in Cyp2e1-null mice administered the same dose of APAP (Lee et al., 1996; Wolf et al., 2007). Compared with Cyp1a2-null (Tonge et al., 1998) and Cyp1a2/Cyp2e1-double null mice (Zaher et al., 1998), wild-type mice also display higher lipidosis, hepatic necrosis, and renal tubular necrosis. P450-generated APAP toxicity is influenced by drug-drug interactions, particularly by drug-mediated activation of nuclear receptors. Phenobarbital and 1,4-bis-[2-(3,5-dichloropyridyloxy)benzene,3,3′,5,5′-tetrachloro-1,4-bis(pyridyloxy)benzene], activators of the constitutive androstane receptor, induced hepatotoxicity by APAP, whereas no significant toxicity was noted in Car-null mice (Zhang et al., 2002). In contrast, clofibrate-pretreated wild-type mice showed marked protection against APAP toxicity (Chen et al., 2000), whereas Ppara-null mice lacked resistance to APAP hepatotoxicity (Chen et al., 2009). Compared with the effects of CYP2E1 and CYP1A2 on APAP toxicity that have been investigated comprehensively, the influence of CYP3A4 on APAP metabolism has remained largely unstudied. Because CYP3A4 can represent up to 60% of the total hepatic P450 content and is responsible for hepatic metabolism of 50% of drugs (Isin and Guengerich, 2006), its role in APAP metabolism and toxicity in humans could be significant (Goodwin et al., 2002).
CYP3A4 is under control of the pregnane X receptor (PXR). Upon ligand binding and formation of a heterodimer with retinoid X receptor, human PXR transcriptionally activated genes encoding CYP3As, drug transporters, and other xenobiotic-metabolizing enzymes through binding to PXR response elements usually located in the 5′-flanking region of target genes (Wang and LeCluyse, 2003). Pregnenolone 16α-carbonitrile-activated murine PXR plays a critical role in APAP-induced hepatic toxicity, probably through induction of CYP3A11 expression (Guo et al., 2004). Others have reported a reduction of APAP hepatotoxicity in Pxr-null mice (Wolf et al., 2005). However, because of species differences between human PXR and rodent PXR, rodent models cannot accurately predict inducers and potential drug-drug interactions mediated by human PXR because of different responses to PXR ligands (Jones et al., 2000). Therefore, it is necessary to investigate the potential roles of CYP3A4 and human PXR in APAP-induced toxicity.
In the current study, the relationship between human PXR-regulated CYP3A4 function and the risk of APAP-induced hepatotoxicity was examined using the human PXR and CYP3A4 double transgenic (TgCYP3A4/hPXR) mouse line (Ma et al., 2008a) and rifampicin, a bactericidal antibiotic drug, which is an effective ligand and agonist of hPXR. Moreover, metabolomics, a tool for measuring small-molecule metabolite profiles and fluxes in biological matrices (Chen et al., 2007), was used to monitor the effect of hPXR activation and CYP3A4 induction on APAP metabolism. The data revealed that hPXR activation and CYP3A4 induction enhanced APAP-induced liver injury. Human PXR might be a risk factor for APAP-induced toxicity through APAP metabolism by CYP3A4.
Materials and Methods
Chemicals. Rifampicin (RIF), APAP, midazolam (MDZ), ketoconazole (KTZ), debrisoquine (DEB), and NADPH were obtained from Sigma-Aldrich (St. Louis, MO). 1-Hydroxymidazolam (1′-OH-MDZ) was purchased from BD Gentest (Woburn, MA). High performance liquid chromatography-grade water, acetonitrile and formic acid were purchased from Sigma-Aldrich. Standards of APAP metabolites cysteine-APAP (Cys-APAP), 3-N-acetyl-cysteinyl-APAP (NAC-APAP), APAP O-glucuronide (APAP-G), and APAP sulfate (APAP-S) were available from previous studies (Chen et al., 2008). All other chemicals were of the highest grade commercially available.
Animals. TgCYP3A4/hPXR double transgenic mice were generated by bacterial artificial chromosome transgenesis in Pxr-null mice (Ma et al., 2008a). TgCYP3A4/hPXR mice, hPXR mice, wild-type mice, and Pxr-null mice were housed in temperature- and light-controlled rooms and were given water and pelleted chow ad libitum. All animal experiments were carried out in accordance with the Institute of Laboratory Animal Resources guidelines and approved by the National Cancer Institute Animal Care and Use Committee.
Experimental Design. Two- to 3-month-old TgCYP3A4/hPXR male mice were stratified into six groups (n = ≥6/group): control (Cont), rifampicin treatment alone (Rif), 200 mg/kg APAP treatment (AP2), 400 mg/kg APAP treatment (AP4), 200 mg/kg APAP treatment after rifampicin (10 mg/kg/day) pretreatment for 6 consecutive days (APR2), and 400 mg/kg APAP treatment after rifampicin (10 mg/kg/day) pretreatment for 6 consecutive days (APR4), respectively. The drug administration process was as follows: mice in the Cont, AP2, and AP4 groups received a control diet for 6 consecutive days and mice in the Rif, APR2, and APR4 groups received a rifampicin diet (prepared from the control diet) for 6 consecutive days. After 6 days of feeding, Cont and Rif mice received injections (intraperitoneally) with vehicle (normal saline) and AP2 and APR2 mice received injections (intraperitoneally) with 200 mg/kg APAP. AP4 and APR4 mice received injections (intraperitoneally) with 400 mg/kg APAP, respectively. Glass metabolic cages (Jencons, Leighton Buzzard, UK) were used to collect 24-h urine samples. Serum samples were collected at 1, 2, 4, 8, and 24 h by retro-orbital bleeding. All mice were euthanized by CO2 asphyxiation 24 h after APAP injection. Liver and other tissue samples were harvested and stored at –80°C before analysis.
Two- to 3-month-old hPXR, wild-type, and Pxr-null mice were used for control experiments. Administration of rifampicin and APAP to mice was the same as described above for TgCYP3A4/hPXR mice. hPXR mice were separated into six groups (n = ≥6/group): control, rifampicin treatment alone, 200 mg/kg APAP treatment, 400 mg/kg APAP treatment, 200 mg/kg APAP treatment after rifampicin pretreatment (10 mg/kg/day) for 6 consecutive days, and 400 mg/kg APAP treatment after rifampicin pretreatment (10 mg/kg/day) for 6 consecutive days. Wild-type mice were stratified into six groups (n = ≥6/group): control, rifampicin treatment alone, 200 mg/kg APAP treatment, 400 mg/kg APAP treatment, 200 mg/kg APAP treatment after rifampicin pretreatment (10 mg/kg/day) for 6 consecutive days, and 400 mg/kg APAP treatment after rifampicin pretreatment (10 mg/kg/day) for 6 consecutive days. Likewise, Pxr-null mice were also separated into six groups (n = ≥6/group): control, rifampicin treatment alone, 200 mg/kg APAP treatment, 400 mg/kg APAP treatment, 200 mg/kg APAP treatment after rifampicin pretreatment (10 mg/kg/day) for 6 consecutive days, and 400 mg/kg APAP treatment after rifampicin pretreatment (10 mg/kg/day) for 6 consecutive days. Serum samples were collected at 24 h by retro-orbital bleeding. All mice were euthanized by CO2 asphyxiation 24 h after the last dose. Liver and other tissue samples were harvested and stored at –80°C before analysis.
Assessment of Liver Injury. For assessment of macroscopic liver damage, liver tissue was flushed with phosphate-buffered saline and fixed in 10% buffered formalin. Necrosis was scored by double-blind analysis on a routine hematoxylin and eosin-stained section according to the morphological criteria described previously (Schulte, 1991). APAP-induced liver injury was further evaluated by measuring aspartate aminotransferase (AST) and alanine aminotransferase (ALT) in serum. In brief, 1 μl of serum was mixed with 200 μl of AST or ALT assay buffer (Catachem, Inc., Bridgeport, CT) in a 96-well microplate, and the oxidation of NADH to NAD+ was monitored at 340 nm for 5 min. Blood urea nitrogen (BUN) was used to determine APAP-induced kidney injury. The assay was conducted in a 96-well microplate, and the reactions were monitored at 520 nm for 30 min (BioAssay Systems, Harvard, CA). Reduced glutathione (GSH) and oxidized glutathione levels in liver were measured by a glutathione assay kit (Sigma-Aldrich), and liver hydrogen peroxide (H2O2) levels were determined by use of the PeroxiDetect kit (Sigma-Aldrich) according to the manufacturer's protocol.
RNA Analysis.CYP3A4, CYP3A7, Cyp3a11, Cyp1a2, Cyp2e1, glutathione S-transferase a1 (Gsta1), glucuronosyltransferase 1a6 (Ugt1a6), multidrug resistance gene (Mdr1a), and organic anion transporting polypeptide 2 (Oatp2) mRNAs were analyzed by a real-time quantitative polymerase chain reaction (qPCR). Hepatic RNA was extracted using TRIzol reagent (Invitrogen, Carlsbad, CA), and qPCR was performed using cDNA generated from 1 μg of total RNA with SuperScript II Reverse Transcriptase (Invitrogen). Primers for qPCR were designed using Primer Express software (Applied Biosystems, Foster City, CA), and sequences are available upon request. qPCR reactions were carried out using SYBR Green PCR Master Mix (SuperArray Bioscience Corporation, Frederick, MD) by using an ABI Prism 7900HT Sequence Detection System (Applied Biosystems). Values were quantitated using the comparative cycle threshold (CT) method, and results were normalized to mouse β-actin.
Protein Analysis of CYP3A4 and Assay of CYP3A4 Activity. Liver tissues were collected 24 h after APAP administration and homogenized in ice-cold buffer (1.15% KCl, 50 mM Tris-HCl, and 1 mM EDTA, pH 7.4), and microsomes were prepared by differential centrifugation. Pellets were resuspended in 100 mM Tris-HCl (pH 7.4), 0.1 mM EDTA, 0.1 mM dithiothreitol, 0.15 M KCl, and 20% v/v glycerol, aliquoted, and stored at –80°C. Primary antibodies to CYP3A4 (clone 2–75–1–2) (Yu et al., 2005) and CYP3A7 (Cheung et al., 2006) diluted 1:1000 with Tris-buffered saline/Tween 20, followed by peroxidase-conjugated anti-mouse IgM (CYP3A4) or peroxidase-conjugated anti-rabbit IgG (CYP3A7) diluted 1:10,000 with Tris-buffered saline/Tween 20, were used for Western blot analysis. The constitutive protein glyceraldehyde-3-phosphate dehydrogenase (GAPDH) was used as a positive control. In addition, 1′-OH-MDZ was used to measure CYP3A4 activity in TgCYP3A4/hPXR mice. The incubation was performed in 100 mM sodium phosphate buffer (pH 7.4) containing microsomes with 50 to 100 μg of protein and 50 μM MDZ in a final volume of 200 μl. For the inhibitory analysis, KTZ was added to the incubation system to a final concentration of 2 μM and preincubation carried out at 37°C for 5 min. The reactions were initiated by the addition of 20 μl of NADPH (20 mM) at 37°C for 10 min and terminated by the addition of 1 ml of ethyl acetate and 1 ml of methyl t-butyl ether mixture. Samples were centrifuged at 3000g for 5 min at 4°C. The organic layer was then transferred to a new tube, dried with N2, and reconstituted in 100 μl of 70% methanol and 30% H2O containing 0.1% formic acid. All reactions were performed in duplicate. 1′-OH-MDZ was detected by liquid chromatography (LC)-coupled tandem mass spectrometry.
APAP Metabolite Profiles in Urine. Pretreatment urine samples and urine samples 24 h after intraperitoneal injection of 200 and 400 mg/kg APAP to control and RIF-treated mice, were collected. Samples were prepared by mixing 40 μl of urine with 160 μl of 50% aqueous acetonitrile and centrifuging at 18,000g for 10 min to remove protein and particulates. Supernatants were injected into the UPLC system (Waters, Milford, MA), and metabolites were separated by a gradient ranging from water to 95% aqueous acetonitrile containing 0.1% formic acid over a 10-min run. APAP and its four major metabolites (Cys-APAP, NAC-APAP, APAP-G, and APAP-S) were identified through accurate mass measurement, comparison with authentic standards, and analysis of the MS2 fragmentation patterns. The peak areas were quantified to represent the signal intensities. A transamination product of Cys-APAP, S-(5-acetylamino-2-hydroxyphenyl)mercaptopyruvic acid (SAMP) (Chen et al., 2008), was also identified through accurate mass measurement and analysis of the MS2 fragmentation pattern, and its peak areas were quantified to represent the signal intensities. After data acquisition in the TOFMS, chromatograms and spectra of APAP and APAP products were processed by MetaboLynx software (Waters) to measure the product variation. Relative abundances of APAP and its metabolites were determined by normalizing the single ion counts of each metabolite versus DEB [internal standard (IS)] of each urine sample.

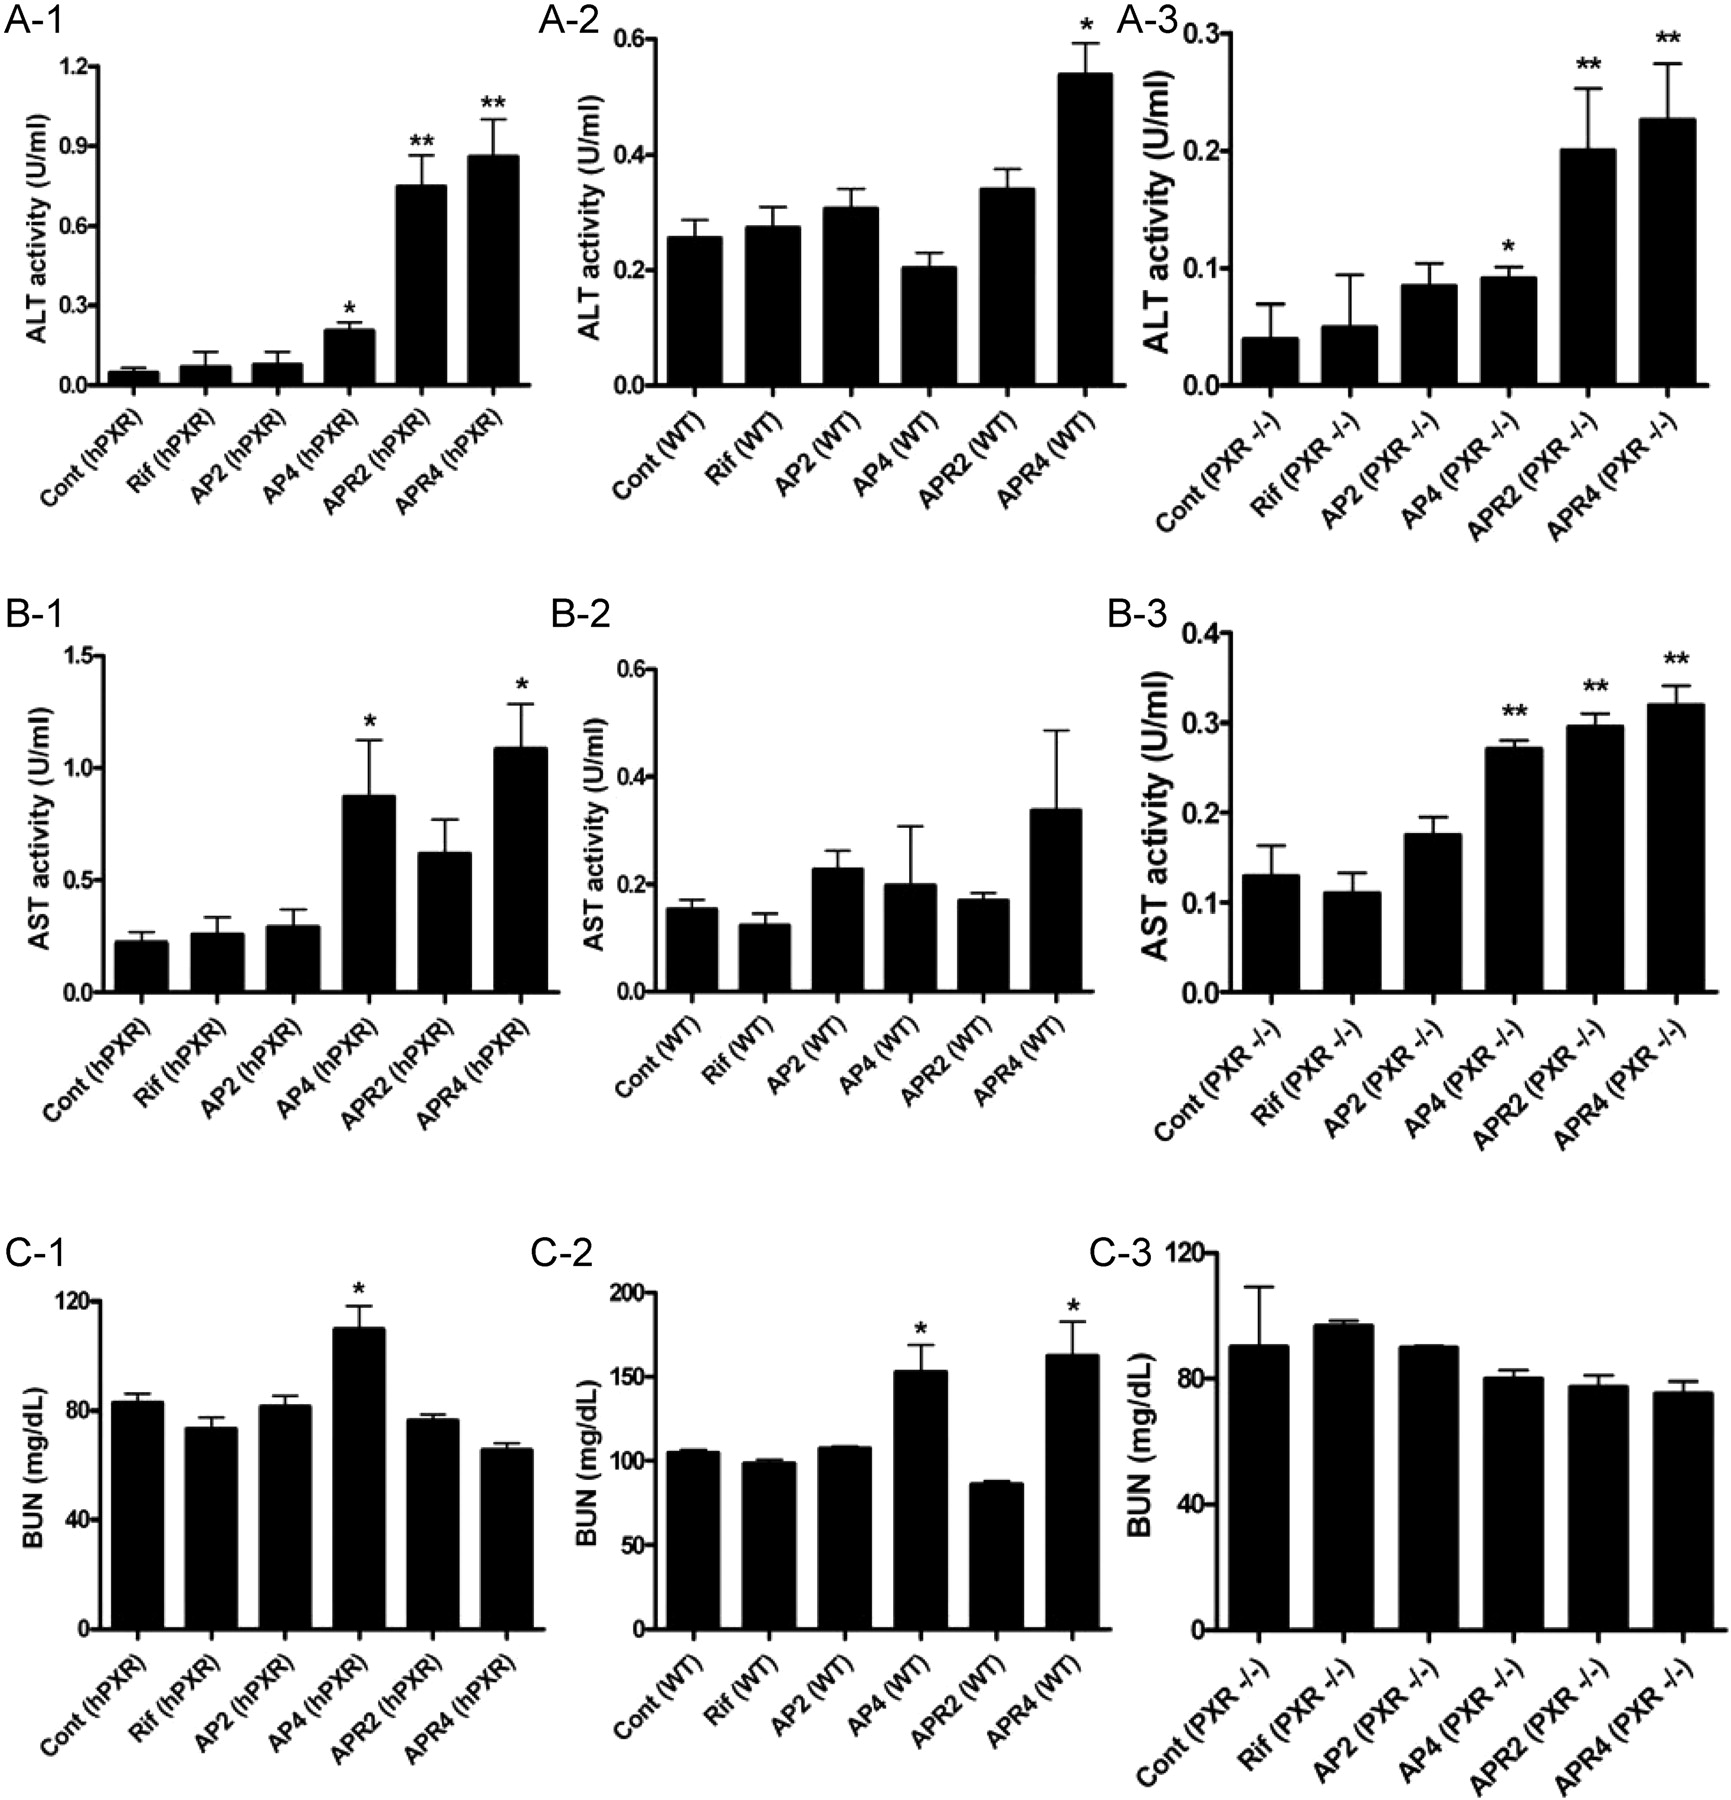
Determination of APAP-induced hepatotoxicity and nephrotoxicity. Two- to 3-month-old TgCYP3A4/hPXR male mice were stratified into six groups: control (Cont), rifampicin treatment (Rif), 200 mg/kg APAP treatment (AP2, intraperitoneal injection), 400 mg/kg APAP treatment (AP4, 400 mg/kg intraperitoneal injection), 200 mg/kg APAP treatment after rifampicin pretreatment (10 mg/kg/day p.o.) for 6 consecutive days (APR2), and 400 mg/kg APAP treatment after rifampicin pretreatment (10 mg/kg/day p.o.) for 6 consecutive days (APR4), respectively. Serum samples were collected 24 h after intraperitoneal injection of 200 and 400 mg/kg APAP. The data are expressed as the mean ± S.D. (n = ≥6; *, p < 0.05; **, p < 0.01; ***, p < 0.001). A, ALT activity (units per milliliter) was measured, with 20-fold elevation of ALT activity between APR2 and AP2 (p < 0.005) and 40-fold elevation between APR4 and AP4 (p < 0.001). B, AST activity (units per milliliter) was measured, with 4-fold elevation of ALT activity between APR2 and AP2 (p < 0.05) and 5-fold elevation between APR4 and AP4 (p < 0.01). C, BUN level (milligrams per deciliter) was detected, with statistical significant differences detected between APR4 and controls.
Quantification of APAP Metabolite Profiles in Serum. Serum samples were collected from the control and RIF-treated groups at 1, 2, 4, and 8 h after intraperitoneal injection of 200 and 400 mg/kg APAP, respectively. One volume of serum was deproteinated by 20 volumes of 66% aqueous acetonitrile. After a 10-min centrifugation at 18,000g, the supernatant was injected into UPLC-TOFMS for quantitation with a gradient of mobile phase ranging from water to 99% aqueous acetonitrile containing 0.1% formic acid over a 10-min run. APAP and its major metabolites (Cys-APAP, NAC-APAP, and APAP-G) were identified through accurate mass measurement, comparison with authentic standards, and analysis of the MS2 fragmentation pattern, and their peak areas were quantified to represent the signal intensities. After data acquisition in TOFMS, chromatograms and spectra of APAP and APAP products were processed by MetaboLynx software to measure the product variation. Relative abundances of APAP and its metabolites were determined by normalizing the single ion counts of each metabolite versus DEB (IS) of each serum sample.
Metabolomics Analysis of Urine and Serum. A 5-μl aliquot of diluted urine and a 1-μl aliquot of diluted serum samples were injected into a Waters UPLC-TOFMS system, respectively. An Acquity UPLC BEH C18 column (Waters) was used to separate chemical components, including APAP and its metabolites at 35°C. The mobile phase flow rate was 0.5 ml/min with an aqueous acetonitrile gradient containing 0.1% formic acid over a 10-min run (0% acetonitrile for 0.5 min to 20% acetonitrile by 5 min to 95% acetonitrile by 9 min, then equilibration at 100% water for 1 min before the next injection). The QToF Premier mass spectrometer was operated in the positive electrospray ionization mode. Capillary voltage and cone voltage were maintained at 3 kV and 20 V, respectively. Source temperature and desolvation temperature were set at 120 and 350°C, respectively. Nitrogen was used as both cone gas (50 l/h) and desolvation gas (600 l/h), and argon was used as collision gas. For accurate mass measurement, the TOFMS was calibrated with sodium formate solution (range m/z 100–1000) and monitored by the intermittent injection of the lock mass sulfadimethoxine ([M + H+] = 311.0814 m/z) in real time. Mass chromatograms and mass spectral data were acquired and processed by MassLynx software (Waters) in centroid format.
Principal Components Analysis and Partial Least-Squares Discriminant Analysis of Urinary and Serum Metabolomic Data. Chromatographic and spectral data were deconvoluted by MarkerLynx software. A multivariate data matrix containing information on sample identity, ion identity (retention time and m/z), and ion abundance was generated through centroiding, deisotoping, filtering, peak recognition, and integration. The intensity of each ion was calculated by normalizing the single ion counts versus the total ion counts in the whole chromatogram. The data matrix was further exported into SIMCA-P software (Umetrics, Kinnelon, NJ) and transformed by mean-centering and Pareto scaling, a technique that increases the importance of low abundance ions without significant amplification of noise. Principal components of urine and serum were generated by PCA and PLS-DA analysis, respectively, to represent the major latent variables in the data matrix and were described in a scores scatter plot.

Determination of APAP toxicity in hPXR, wild-type, and Pxr-null mice after rifampicin and APAP treatment. hPXR, wild-type, and Pxr-null mice were separated into groups and administered drugs as detailed under Materials and Methods. Serum samples were collected 24 h after intraperitoneal injection of vehicle, 200 mg/kg APAP, and 400 mg/kg APAP. The data are expressed as the mean ± S.D. (n = ≥6; *, p < 0.05; **, p < 0.01). Cont (hPXR), control (A-1, B-1, C-1); Rif (hPXR), rifampicin treatment alone; AP2 (hPXR), 200 mg/kg APAP treatment, AP4 (hPXR), 400 mg/kg APAP treatment, APR2 (hPXR), 200 mg/kg APAP treatment after rifampicin pretreatment (10 mg/kg/day) for 6 consecutive days; APR4 (hPXR), 400 mg/kg APAP treatment after rifampicin pretreatment (10 mg/kg/day) for 6 consecutive days; Cont (WT), wild-type (WT) control (A-2, B-2, C-2); Rif (WT), rifampicin treatment alone, AP2 (WT), 200 mg/kg APAP treatment, AP4 (WT), 400 mg/kg APAP treatment, APR2 (WT), 200 mg/kg APAP treatment after rifampicin pretreatment (10 mg/kg/day) for 6 consecutive days; APR4 (WT), 400 mg/kg APAP treatment after rifampicin pretreatment (10 mg/kg/day) for 6 consecutive days; Cont (PXR–/–), control Pxr-null mice (A-3, B-3, C-3); Rif (PXR–/–), rifampicin treatment alone; AP2 (PXR–/–), 200 mg/kg APAP treatment; AP4 (PXR–/–), 400 mg/kg APAP treatment; APR2 (PXR–/–), 200 mg/kg APAP treatment after rifampicin pretreatment (10 mg/kg/day) for 6 consecutive day; APR4 (PXR–/–), 400 mg/kg APAP treatment after rifampicin pretreatment (10 mg/kg/day) for 6 consecutive days.
Statistics. Experimental values are expressed as mean ± S.D. Statistical analysis was performed with two-tailed Student's t tests, except time course GSH variation was analyzed by one-way analysis of variance test, both with a p < 0.05 considered statistically significant.
Results
Effect of Rifampicin on APAP-Induced Toxicity. ALT and AST activities are sensitive diagnostic indicators of hepatotoxicity (Ozer et al., 2008). ALT activity increased 2- to 10-fold in the AP2 and AP4 groups compared with controls and was elevated 20- and 500-fold in the APR2 and APR4 groups compared with controls (Fig. 1A). RIF activation of human PXR led to a 20-fold elevation of ALT activity when AP2 was compared with APR2 (p < 0.005) and a 40-fold increase in APR4 relative to AP4 (p < 0.001) after a 24-h administration of APAP (Fig. 1A). In addition, AST activities in the RIF and APAP coadministration groups increased 2- to 6-fold over controls, coupled with an increase of 4-fold comparing APR2 with AP2 (p < 0.05) or 5-fold comparing APR4 with AP4 (p < 0.01), respectively (Fig. 1B). Histological scoring revealed a gradual development of liver injury in the AP2, AP4, APR2, and APR4 mice, ranging from mild piecemeal necrosis and ballooning degeneration to a sprinkling of inflammatory cells and wildly spread scattered foci of hepatocellular necrosis (Supplemental Fig. 1). Moreover, the influence of APAP and RIF administration on kidney function was evaluated by measuring BUN levels. BUN gradually increased from the AP2, AP4, and APR2 to the APR4 groups. The 400 mg/kg APAP and RIF cotreatment caused augmentation of BUN levels compared with controls (Fig. 1C), suggesting that severe kidney injury (Edelstein, 2008) developed upon administration of RIF and high-dose APAP.
To determine the specificity of CYP3A4 on APAP toxicity, hPXR mice without the CYP3A4 transgene were treated with RIF and APAP. The results showed that ALT activities were increased in the APR2 and APR4 groups but only modestly compared with the robust increased observed in TgCYP3A4/hPXR mice (compare Fig. 1 and Fig. 2, A-1 and B-1). Wild-type mice and Pxr-null mice showed markedly lower fold increases in ALT and AST activities than were observed in hPXR mice. In Pxr-null mice, RIF raised ALT activity up to 4- to 5-fold in the APR2 and APR4 groups compared with controls and 2-fold between the APR2 and AP2 groups or APR4 and AP4 groups, although these differences failed to reach statistical significance (p < 0.07). BUN values in Pxr-null mice showed no significant variation between control and treated groups, albeit a modest elevation of BUN was observed in the AP4 group of hPXR mice and a slight increase in BUN levels was found in the AP4 and APR4 groups of wild-type mice compared with nontreatment mice (Fig. 2, C-1, C-2, and C-3). Compared with the different response of RIF-mediated APAP toxicity between TgCYP3A4/hPXR mice and hPXR, wild-type, and Pxr-null mice, these results suggested a major role for human PXR and CYP3A4 in the enhancement of APAP toxicity upon ligand activation.
APAP-Induced Oxidative Stress. GSH, an essential antioxidant in mammalian cells, is a substrate for conjugation of NAPQ1, yielding glutathione-APAP (GS-APAP), which is associated with reduced APAP toxicity. GS-APAP is further metabolized to Cys-APAP and NAC-APAP. Exhaustion of GSH levels by high APAP levels exacerbates APAP-induced oxidative stress, which could lead to hepatotoxicity. To examine the influence of RIF activation on APAP-induced GSH depletion, hepatic GSH levels were analyzed 1, 2, 4, and 8 h after APAP administration (Fig. 3A). At 1, 2, and 4 h, higher levels of GSH were observed in the untreated group. Compared with the control group, APAP-treated mice presented significantly lower levels of hepatic GSH at 1, 2, and 4 h. Total GSH levels were markedly decreased by more than 90% of the normal levels with coadministration of APAP and RIF, especially at 1 and 2 h after APAP treatment, suggesting an increased requirement of GSH on APAP metabolism upon RIF activation. At 4 and 8 h after APAP treatment, GSH levels in the AP2, AP4, APR2, and APR4 groups gradually recovered, despite higher toxicity occurring with APAP and RIF treatment. In addition, because GSH modulates redox-sensitive components of signal transduction cascades and overdepletion of GSH disrupts redox balance, hepatic H2O2 levels were measured 24 h after administration of APAP (Fig. 3B). The results showed that a 400 mg/kg dose of APAP or RIF treatment alone both significantly raised H2O2 levels compared with that found in untreated mice. H2O2 levels in APR4 and APR2 mice were increased by 1.5- and 2-fold compared with the levels in the AP4 (p < 0.005) and AP2 (p < 0.05) group mice, respectively. Moreover, H2O2 levels in APR4 mice increased to nearly 3 times those found in untreated mice, which might be due to the combination of APAP and rifampicin treatment. Overproduction of reactive oxygen species (ROS) can result in damage to cellular organelles and macromolecules (Covarrubias et al., 2008). Therefore, excess depletion of GSH and production of ROS from hPXR activation with RIF treatment increased APAP-induced oxidative stress injury. It is interesting to note that except for high-dosage APAP leading to increased oxidative stress, RIF itself caused a slight increase in H2O2 levels (p < 0.05). The elevated H2O2 production could be a response to increased cellular metabolic activity due to the pleiotropic effects of the inducer on cellular proliferation (Davies, 1999). RIF was also reported to increase hepatic lipid peroxidation and decrease the activities of superoxide dismutase and glutathione peroxidase in rats (Shen et al., 2009). Superoxide dismutase and glutathione peroxidase prevent the formation of ROS (Afonso et al., 2007). Thus, RIF might increase production of H2O2 by inhibiting the activities of antioxidant enzymes such as superoxide dismutase and glutathione peroxidase.

Analysis of APAP-induced oxidative stress. TgCYP3A4/hPXR male mice were stratified into groups as in Fig. 1. A, total hepatic GSH/oxidized glutathione level (nanomoles per milligram of liver) in time course profiles of 1, 2, 4, and 8 h in Cont, Rif, AP2, AP4, APR2, and APR4 mice after APAP administration. One-way analysis of variance analysis showed the differences between six groups in time points of 1, 2, and 4 h. B, aqueous H2O2 concentrations rose in serum upon APAP and rifampicin coadministration between APR2 and AP2 (p < 0.05) or APR4 and AP4 (p < 0.005). The mean ± S.D. is shown (n = 3–4; *, p < 0.05; **, p < 0.01; ***, p < 0.001).
Human PXR Activation by Rifampicin Administration. Hepatic expression of PXR target genes after RIF treatment was analyzed by quantitative real-time PCR analysis of mRNA from genes including human CYP3A4 and CYP3A7 and mouse Cyp3a11, Cyp1a2, Cyp2e1, Gsta1, Ugt1a6, Mdr1a, and Oatp2. CYP3A4, Cyp3a11, Gsta1, Ugt1a6, Mdr1a, and Oatp2 are representative genes whose expression is regulated by PXR (Xu et al., 2005). RIF induced expression of CYP3A4, Cyp3a11, Gsta1, and Ugt1a6 (Fig. 4). It is noteworthy that expression of CYP3A4 increased by 200- to 400-fold upon RIF treatment compared with that in untreated controls, whereas expression of Cyp3a11 and Ugt1a6 rose by a meager 2- to 4-fold in TgCYP3A4/hPXR mice. Although TgCYP3A4/hPXR mice contain CYP3A7 and CYP3A4, CYP3A7 mRNAs levels were considerably less than the expression of CYP3A4. CYP3A7 induction was also noted in adult TgCYP3A4/hPXR mice after RIF treatment, which might be attributed to the high homology of the PXR binding motif between CYP3A7 and CYP3A4 (Song et al., 2004). However, it is minor compared with the robust induction of CYP3A4 by RIF. The data suggested that CYP3A7 in adult liver was not biologically relevant and probably does not contribute to the observed hepatotoxicity effects. The expression of mRNAs encoding Cyp1a2 and Cyp2e1, two P450s involved in APAP metabolism, was not different between control and treated mice. Mouse β-actin served as an internal control for qPCR analysis. Thus, CYP3A4 may be the most important P450 involved in APAP metabolism in TgCYP3A4/hPXR mice. Gsta1 mRNA expression in TgCYP3A4/hPXR mice also revealed significant elevation after APAP and RIF coadministration, suggesting that the PXR activation increasing Gsta1 expression.
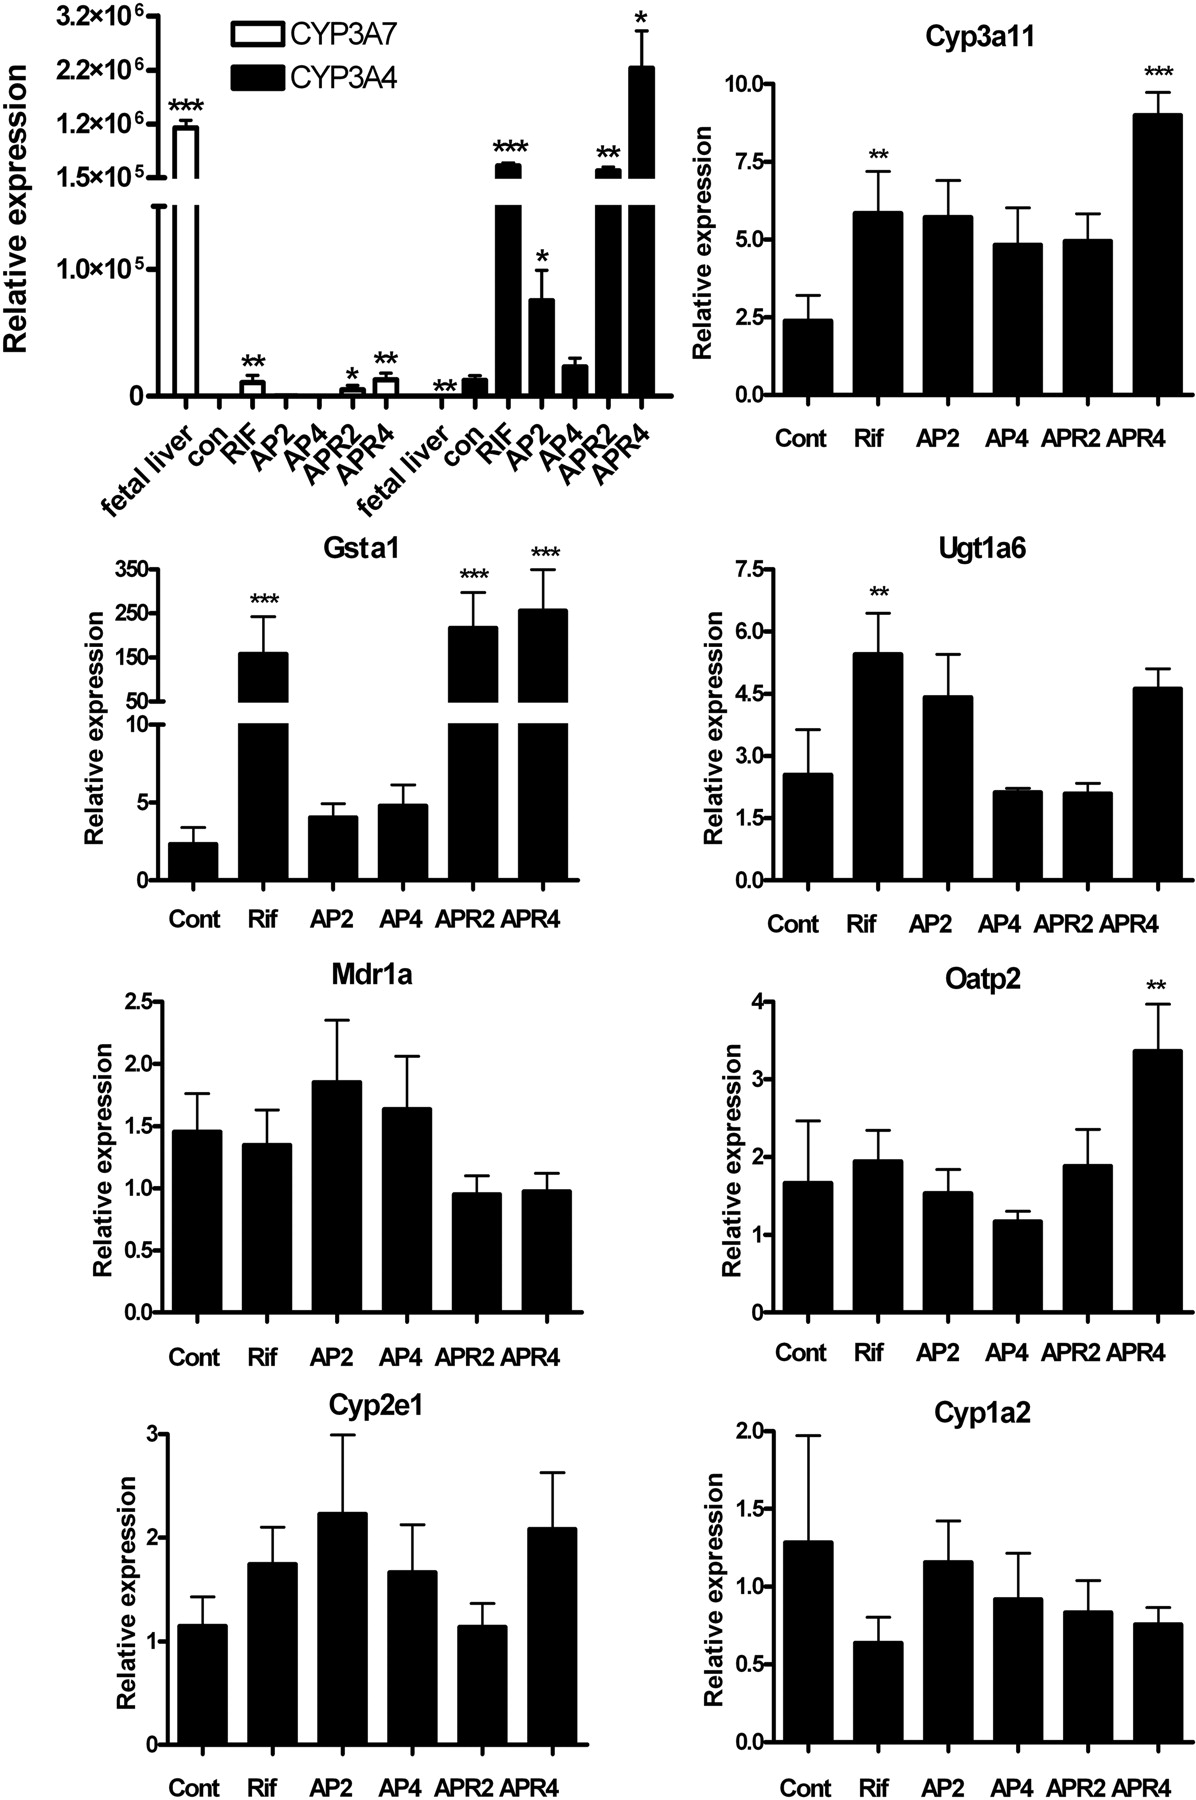
mRNA analysis after APAP administration and PXR activation. Expression of mRNAs encoding CYP3A4, CYP3A7, Cyp3a11, Gsta1, Ugt1a6, Mdr1a, Oatp2, Cyp2e1, and Cyp1a2 were determined by qPCR. TgCYP3A4/hPXR male mice were stratified into groups as in the legend to Fig. 1. Liver tissues were collected 24 h after APAP injection, and RNA was extracted. Mouse β-actin mRNA served as an internal control. The mean ± S.D. is shown (n = ≥6; * for p < 0.05; ** for p < 0.01; *** for p < 0.001, compared with the corresponding control). Among these, relative expressions of CYP3A4 and CYP3A7 were normalized with a ΔCT value of adult CYP3A7 expression as 1. Statistical analysis of CYP3A7 and CYP3A4 expression was compared with the nontreatment group as a control. Other genes were normalized with a ΔCT value of control expression as 1 and statistically compared with the nontreatment group as a control.
CYP3A4 Induction by Rifampicin Treatment. The TgCYP3A4/hPXR mouse contains the human PXR, CYP3A4, and CYP3A7 genes; CYP3A4 is expressed in the liver and intestine (Scott and Halpert, 2005), whereas CYP3A7 is expressed mostly in the fetus (Hines, 2007). It was reported that CYP3A4 was only detected in 2- and 4-week-old mice but not in mice more than 6 weeks old (Ma et al., 2008a). Results showed that CYP3A4 expression in 2- to 3-month old mice was markedly induced with RIF treatment in RIF and APR groups compared with untreated controls due to hPXR activation (Fig. 5A). GAPDH, a housekeeping protein, was used as a loading control. Because CYP3A7 expression was extremely low in adult liver (Fig. 4), protein expression of CYP3A7 was not detected with the same loading protein amount (15 μg). Moreover, MDZ-dependent CYP3A activity was enhanced by 6-fold in the RIF group compared with that in the control group and was elevated 10-fold in the coadministration groups compared with that in the control group (Fig. 5B). KTZ, a potent inhibitor of CYP3A enzymes (Zhou, 2008), abolished activity found in untreated controls. CYP3A4 was therefore strongly induced in TgCYP3A4/hPXR mice due to human PXR activation upon RIF treatment according to RNA, protein, and catalytic activity analysis.
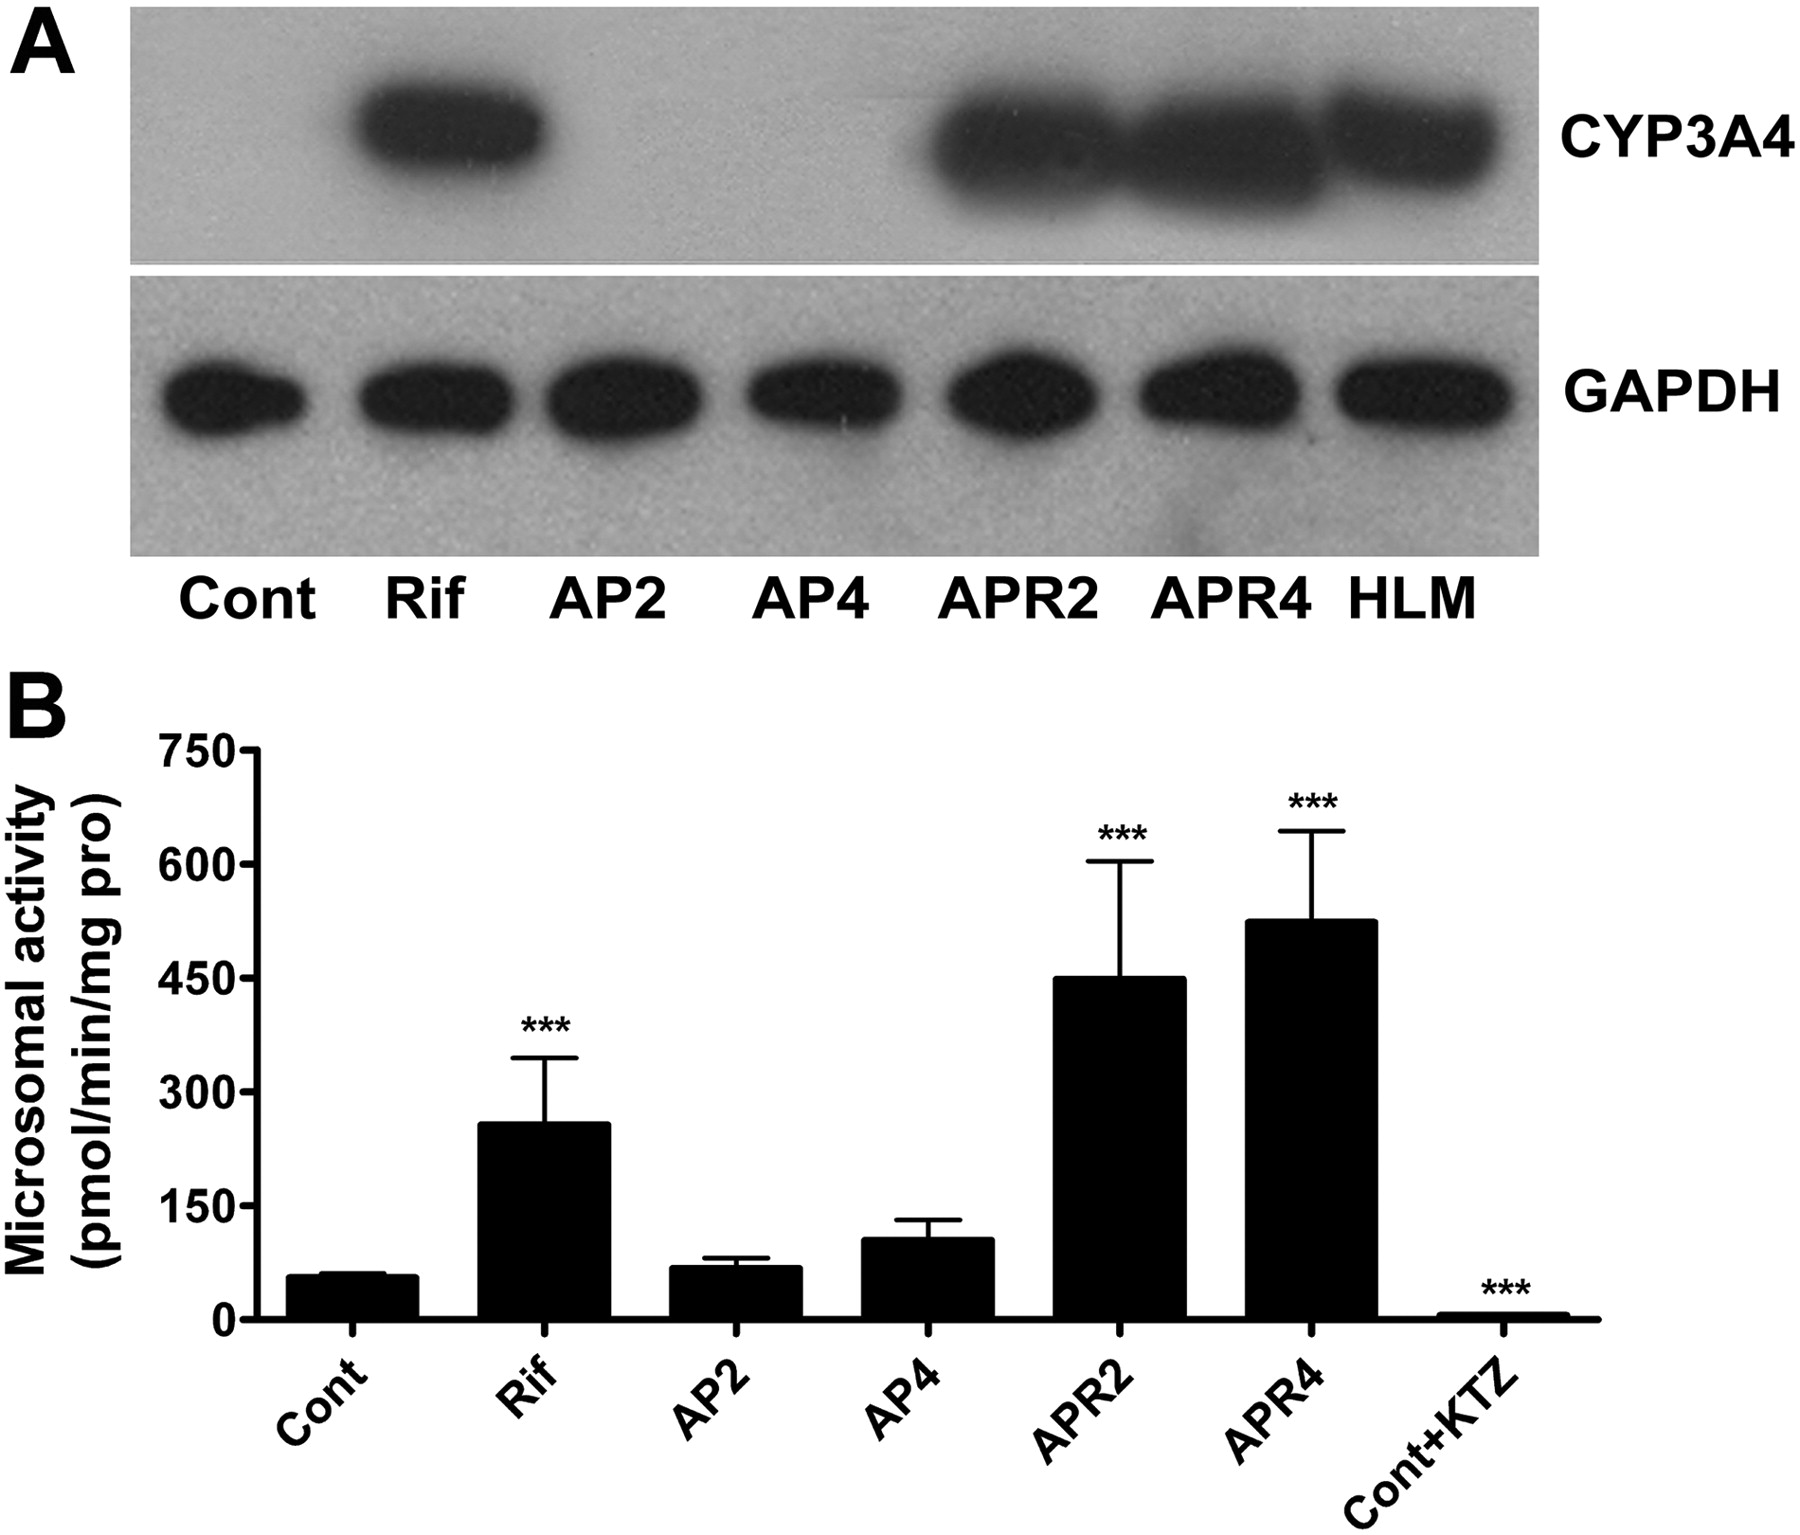
Hepatic CYP3A4 expression in TgCYP3A4/hPXR mice by Western blot evaluation and CYP3A activity in liver microsomes. Liver tissues were collected from six groups (Cont, Rif, AP2, AP4, APR2, and APR4) of transgenic male mice. Liver microsomes were prepared by differential centrifugation. Pooled microsomal samples (n = ≥6 livers in each group, 15 μg of total loading proteins) were used for Western blot analysis. A, the monoclonal antibody against CYP3A4 (275-1-2) specifically recognizes human CYP3A4 but not mouse Cyp3a or other liver proteins. GAPDH was used as a loading control. HLM, human liver microsome. B, CYP3A-involved MDZ 1′-hydroxylation was used as the probe for CYP3A activity and detected by LC-coupled tandem mass spectrometry. Ketoconazole (2 μM) was added to inhibit CYP3A activity. 6-Chloromelatonin was loaded as internal standard. The mean ± S.D. is shown (n = ≥6; ***, p < 0.001, compared with the control group).
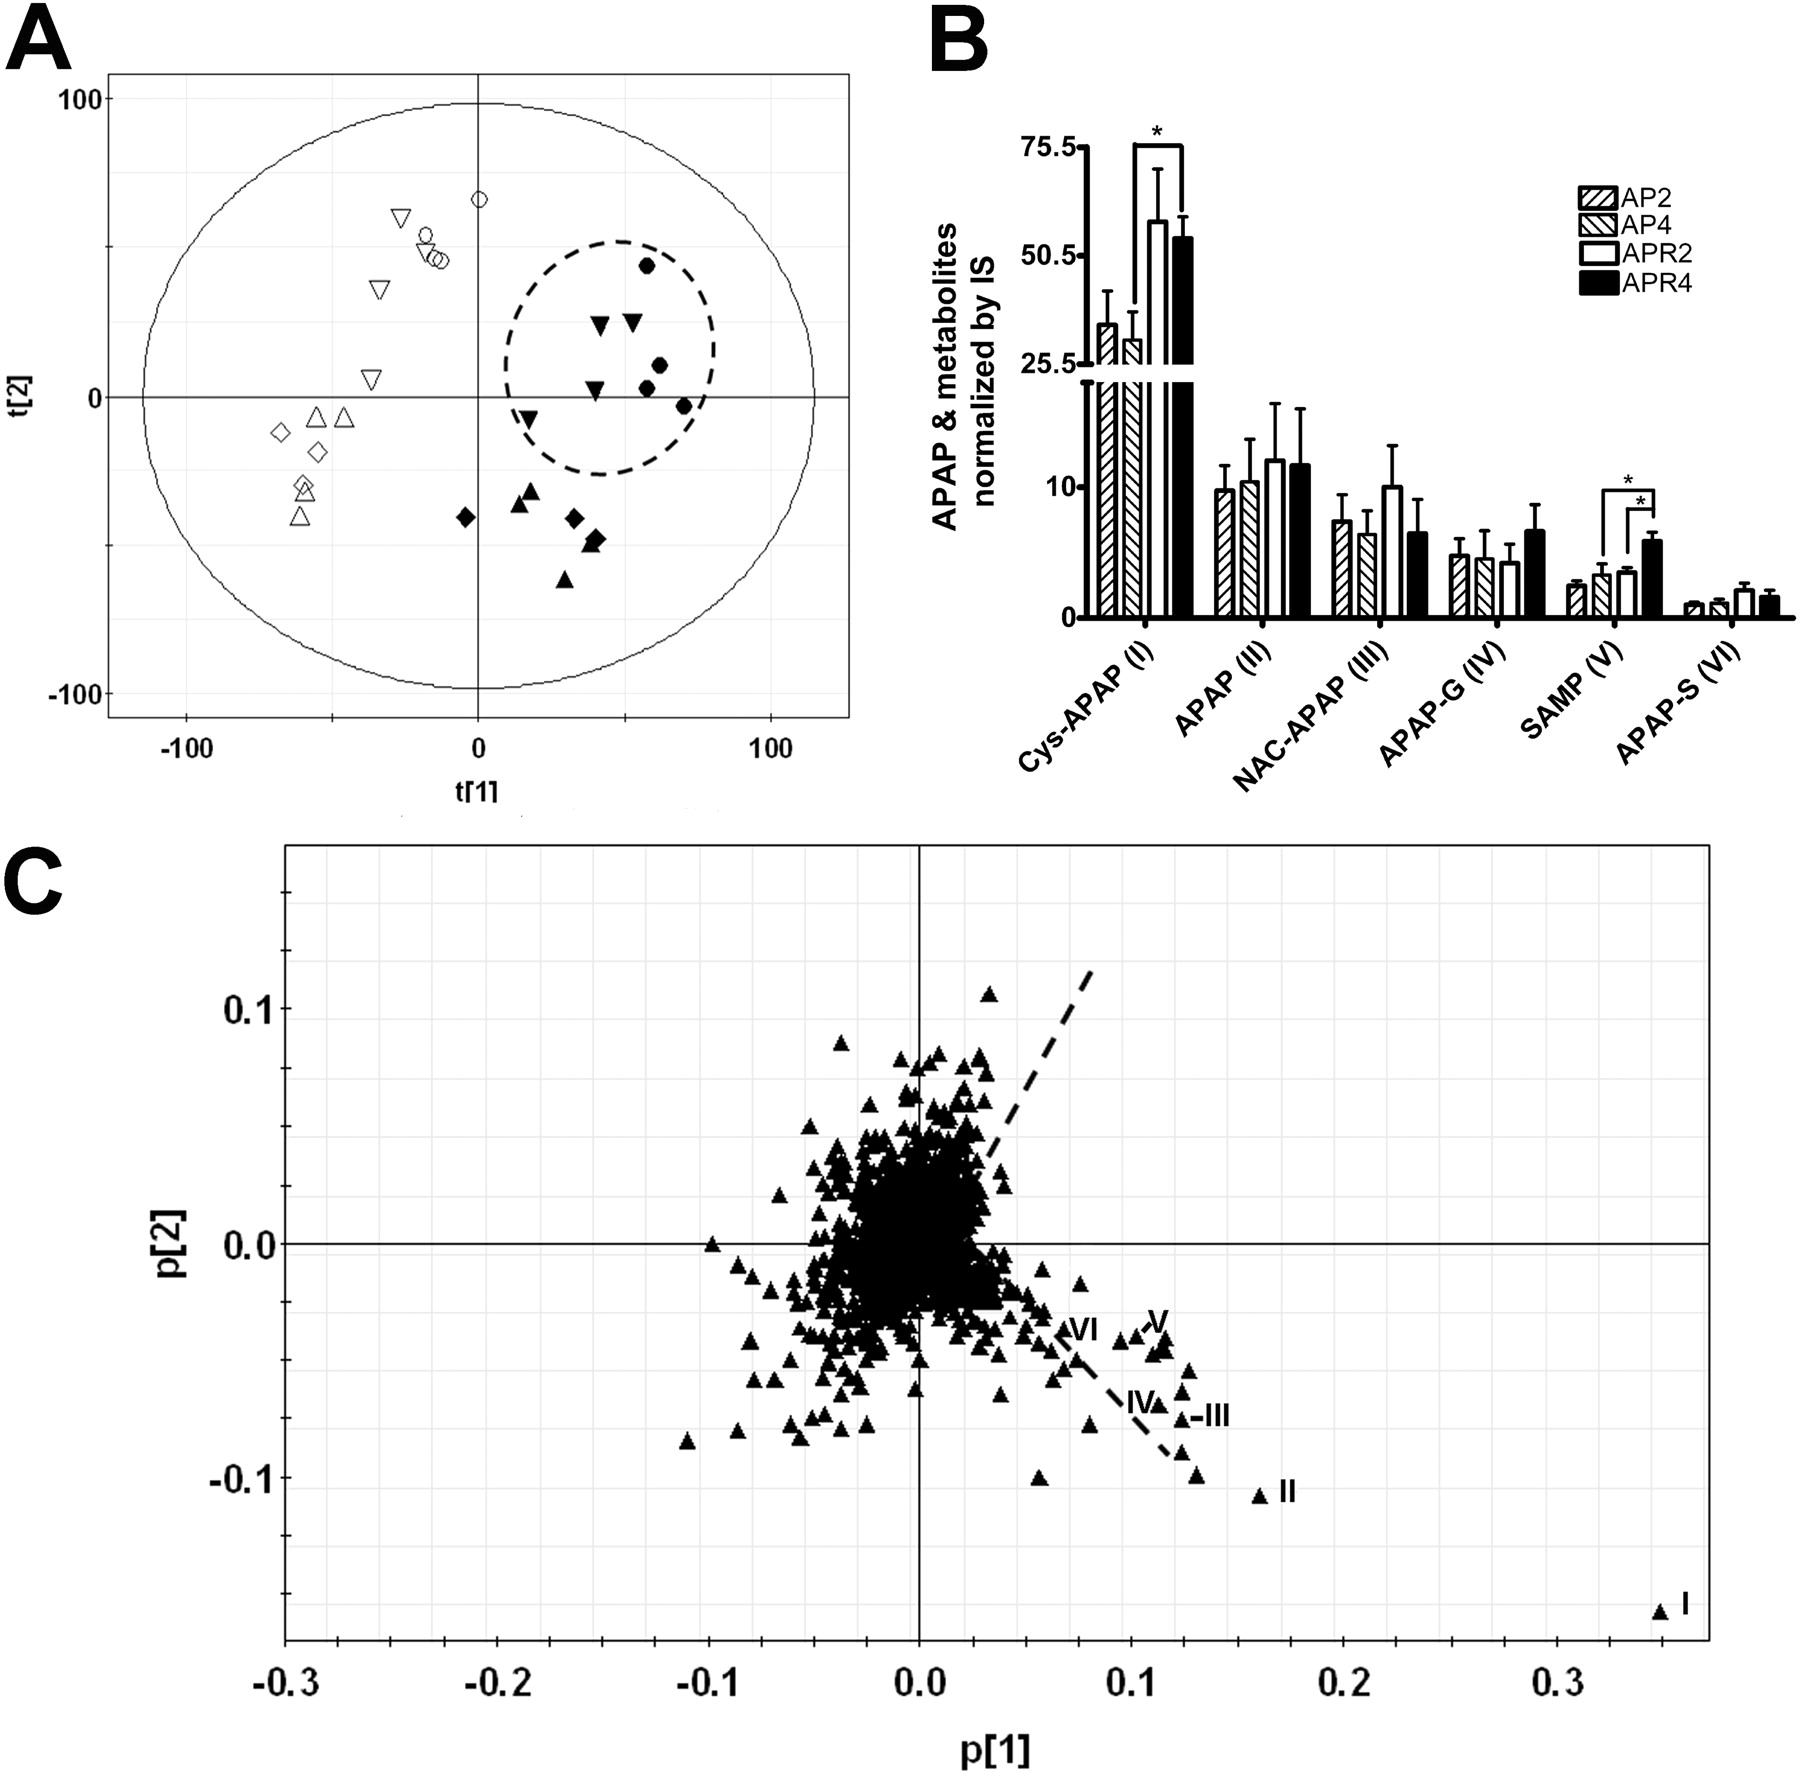
Metabolomics Analysis of APAP Metabolites in Urine. Functionally, biotransformation of APAP can be categorized into toxication and detoxication pathways. APAP glucuronidation and APAP sulfation are detoxicated metabolites excreted into urine. GS-APAP, the result of a toxic metabolite that is converted into Cys-APAP or NAC-APAP, is predominantly excreted via the biliary route (Tokatli et al., 2007). These two secondary metabolites are converted by hepatic γ-glutamyltranspeptidase (Seifert and Anderson, 2007) and excreted into urine. To dissect the APAP-metabolizing pathways in TgCYP3A4/hPXR mice, metabolomics analysis was carried out. Data collected from UPLC-TOFMS analysis of urine were processed by PCA. A multivariate model was constructed to delineate the relationship among samples and the contribution of each detected urinary chemical ion to the model. As shown by the scores scatter plot (Fig. 6A), urine samples from APAP-treated mice clearly separated from controls in the first component of the model, and those from double treated mice separated from those of APAP-treated mice in the second component of the model. Loading plots showed a strong contribution of APAP and APAP metabolites (I–VI), which largely defined the separation between high-toxicity groups with APAP and RIF cotreatment and low-toxicity/no toxicity groups upon APAP treatment (Fig. 6C). The model fit (R2 value) and prediction powers (Q2 value) of the PCA model were 0.594 and 0.307, respectively. By comparison, quantitative analysis (Fig. 6B) showed that Cys-APAP (ion I) was the most abundant and critical ion in urine contributing to the separation of high-toxicity and low-toxicity mice. SAMP (ion V), which is assumed to be the Cys-APAP metabolite (Chen et al., 2008) and is up-regulated with release of cysteine aminotransferase due to kidney injury (Mazer and Perrone, 2008), was elevated in APR mice, associated with kidney injury as revealed by the increase in BUN levels.
Quantification of Major APAP Metabolites in Serum. APAP and APAP metabolites exhibited different time course profiles in serum compared with urine (Fig. 7A). APAP was the dominant ion at 1 and 2 h after drug treatment. APAP was metabolized at a higher rate from 1.5- to 6-fold in APR4 mice compared with AP4 mice at 1 and 2 h, respectively, suggesting that APAP conversion was correlated with increased CYP3A4 activity. In addition, GS-APAP levels were higher in APR4 mice 1 h after APAP administration, which also resulted in higher downstream Cys-APAP in APR4 mice. After several hours, most GS-APAP was excreted in the bile, whereas Cys-APAP/NAC-APAP was excreted in urine (Tokatli et al., 2007). Although there were similar levels of hepatic GSH between untreated and treated groups, GS-APAP was still higher in the APR4 group than in the AP4 group. The up-regulation of glutathione synthesis in the APAP-challenged group might be due to the response to the oxidative burden from reactive metabolites. Moreover, it should be noted that higher APAP dimer (Chen et al., 2008) in serum was observed in APR mice compared with APAP-treated mice (Fig. 7B); the APAP dimer is generated from APAP by ROS species (Karageuzyan, 2005). In a similar manner, aqueous H2O2 increased from 1.5 to 3.5 μM with RIF and APAP treatment. Thus, the APAP dimer could potentially be a biomarker for APAP-induced oxidative stress.
Serum Metabolomics Analysis of APAP-Induced Liver Necrosis. Serum metabolomics analyzed by PLS-DA revealed clear separation between TgCYP3A4/hPXR mice administered APAP alone and those given APAP plus RIF (Fig. 8A). The model fit (R2 value) and prediction power (Q2 value) of the PLS-DA model were 0.301 and 0.366, respectively. The fit and prediction power of the PLS-DA model were tested by 20 permutations. The permutation test was performed to determine whether the differences found between the groups are significant (Bijlsma et al., 2006), and reduced R2 and Q2 values after permutation proved the validity of the model. Loading plots (Fig. 8B) demonstrated that multiple lysophosphatidylcholines (LPCs) contributed to the clarification of double treatment groups from APAP treatment groups, which were C20:4-LPC, C18:0-LPC, C20:3-LPC, C22:6-LPC, and C18:3-LPC, as demonstrated by tandem MS and comparison with authentic standards (Supplemental Fig. 2). Among the ions, C20:4-LPC arachidonic acid (AA) presented as the principal ion that gradually declined with rising liver toxicity and ultimately showed a 3-fold decrease in APR4 mice compared with untreated controls (Fig. 8C).
Discussion
PXR mediates the cellular response to xenobiotics, as well as specific endobiotic metabolic pathways (Kliewer et al., 1998). Because of a large ligand-binding pocket, PXR is activated by a wide range of structurally diverse compounds compared with other nuclear receptors (Kliewer et al., 2002). Many PXR ligands have been identified among prescription drugs, natural products, dietary supplements, environmental pollutants, or endogenous hormones and bile acids (Ma et al., 2008b). Human and mouse PXR markedly differ in their response to ligand activation even though they share nearly 80% amino acid identity in the ligand-binding domain and 96% amino acid identity in the DNA-binding domain and display a similar tissue expression pattern (Blumberg et al., 1998). For example, rifampicin had virtually no activity on mouse PXR but was a very efficient activator of human PXR. On the other hand, pregnenolone 16α-carbonitrile was only a weak activator of human PXR but an efficacious activator of mouse PXR (Lehmann et al., 1998). Because of the marked species differences in ligand-binding specificities between human and mouse PXR, mice humanized for PXR were developed to study human drug metabolism pathways in the mouse (Ma et al., 2008b). In addition, because PXR mediates CYP3A function by binding specifically as a heterodimer with retinoid X receptor to DR3 motifs found in the promoter regions of CYP3A target genes (Lehmann et al., 1998), CYP3A4, which accounts for more than 50% of drug metabolism in human, was introduced into PXR-humanized mice and the TgCYP3A4/hPXR mice yielded a platform to investigate regulation of CYP3A4-mediated drug metabolism in vivo (Ma et al., 2008a).

Distribution of APAP and its metabolites in urine. TgCYP3A4/hPXR male mice were stratified into groups as in Fig. 1. Urine samples were obtained from preinjection controls of AP2, AP4, APR2, and APR4 and after APAP injection of AP2, AP4, APR2, and APR4 mouse groups. Urinary metabolite profiles were measured by using UPLC-TOFMS, data processing was performed by using MarkerLynx software, and principal components analysis was performed using SIMCA-P+ software. A, scores plot of a PCA model on 24-h urine samples from the preinjection control and after APAP injection of AP2, AP4, APR2, and APR4 group mice. A two-component PCA model was constructed to characterize the relationship among eight mouse groups (3–4 mice/group), including the preinjection control of AP2 ▵, AP4 ⋄, APR2 ▿, and APR4 ○ and after APAP injection of AP2 ▴, AP4 ♦, APR2 ▾, and APR4 • group mice. The t[1] and t[2] values represent the scores of each sample in principal component 1 and 2, respectively. Fitness (R2) and prediction power (Q2) of this PCA model are 0.594 and 0.307, respectively. B, quantitative analysis of major APAP metabolites in control and APAP-treated urine samples. Debrisoquine was loaded as an IS. APAP and major APAP metabolites shown are as follows: I, Cys-APAP; II, APAP; III, NAC-APAP; IV, APAP glucuronide; V, SAMP; VI, APAP sulfate. The mean ± S.D. is shown (n = 3–4; *, p < 0.05). C, loadings plot of chemical ions from 24-h urine samples. The p[1] and p[2] values represent the contributing weights of each ion to principal components 1 and 2 of the PCA model, respectively. Major APAP metabolites (I–VI) contribute to the separation of the control and APAP-induced low hepatotoxicity group mice from APAP-induced high hepatotoxicity mice.
APAP, with the commercial brand of Tylenol (Culley and Krenzelok, 2005), is a nonprescription analgesic used throughout the world (Coombes, 2007), occupying the top seller in the pain-killing market in North America. However, with the popularity of this drug, overdosing of APAP has accounted for 39% of drug-induced acute hepatotoxicity (Farrell, 1997). CYP2E1, CYP1A2, and CYP3A4 were reported to be involved in converting APAP into NAPQI. Relative to the established role of human CYP2E1 and CYP1A2 in APAP metabolism, less is known about the role of CYP3A4 and hPXR in APAP metabolism and toxicity.
In the current study, rifampicin administration followed by hPXR activation and CYP3A4 induction markedly enhanced APAP-induced liver toxicity. CYP3A4 was proposed to be the major enzyme responsible for APAP metabolism by analysis of metabolic enzyme profiles and comparison of the APAP toxicity with hPXR mouse controls. Increased expression of CYP3A4 led to transformation of APAP into reactive intermediate electrophilic metabolites and exhaustion of hepatocellular glutathione that then triggers the cascade of events leading to hepatotoxicity. The results indicated that CYP3A4 was induced more than 100-fold versus control, whereas mouse Cyp3a was only elevated 2.5-fold. Previous microarray data showed that rifampicin administration increased expression of CYP3A4 by approximately 50-fold (Honkakoski et al., 2003). The magnitude of induction difference between mouse and human CYP3A mRNA is probably due to the difference in constitutive expression of CYP3A4 versus mouse CYP3A11 mRNAs. However, the mechanism for this difference in extent of constitutive expression between the human and mouse CYP3A genes is not understood. GSTA1 was also significantly elevated in RIF-induced TgCYP3A4/hPXR mice compared with controls. This finding is in agreement with earlier studies showing that toxic chemicals have the potential to induce GST activity in human or rodent liver tissue (Hayes and Pulford, 1995). GSTs are detoxication enzymes that catalyze the conjugation of glutathione with reactive metabolites formed during xenobiotic oxidation reactions, resulting in reduced toxicity (Pushparajah et al., 2008). Thus, it is likely that the GST induction observed is a protective mechanism that occurs in response to xenobiotic exposure due to PXR activation.

Quantification of major APAP metabolites in serum. TgCYP3A4/hPXR male mice were stratified into groups as in Fig. 1. Serum was obtained from 1, 2, 4, 8, and 24 h after APAP treatment. The metabolite profile was analyzed by using UPLC-QTOFMS, and data processing was performed by using MetaboLynx software. A, venous blood was obtained 1, 2, 4, and 8 h after APAP administration. Abundance of APAP, Cys-APAP, NAC-APAP, and GS-APAP were described from 1, 2, 4, and 8 h, respectively. B, the APAP dimer displayed a significant increase from APR4 to AP4 24 h after the APAP injection. The mean ± S.D. is shown (n = 3–4; *, p < 0.05; **, p < 0.01; ***, p < 0.001).
Metabolite profiling can be used to track metabolic changes originating from liver damage and to identify drug metabolites that affect these processes. In this regard, metabolomics, which measures the metabolic responses of living systems to physiological stimuli, can present information on multiorgan functional response in real time. Here a brief view of APAP hepatotoxicity based on quantitative and qualitative analysis of APAP metabolites in TgCYP3A4/hPXR mice was undertaken. APAP is converted mainly to the APAP glucuronide and APAP sulfate, which represent detoxication pathways, or to GS-APAP that is further metabolized to Cys-APAP or NAC-APAP. GS-APAP results from conjugation of NAPQI, the unstable intermediate from APAP oxidation that represents the major activation pathway for toxicity. Urinary metabolomics revealed that Cys-APAP contributed to separation of the toxic group from the subtoxic/nontoxic group. Cys-APAP is correlated with dose-dependent renal GSH depletion that could interfere with intrarenal detoxification of APAP or its toxic metabolite NAPQI. This may be the mechanism for the potentiation of APAP nephrotoxicity. SAMP, a metabolite of Cys-APAP produced by cysteine aminotransferase, gradually accumulated as a result of severe renal injury caused by APAP. Moreover, compared with previous studies of CYP2E1-mediated APAP metabolism (Chen et al., 2008), upon coadministration of rifampicin and APAP, TgCYP3A4/hPXR mice displayed higher cellular H2O2 concentrations than that with the same treatment dose of APAP (200 and 400 mg/kg) to control mice, suggesting that hPXR activation and CYP3A4 induction led to more ROS. This elevated ROS would increase production of the APAP dimer and oxidative stress-induced hepatotoxicity and nephrotoxicity.
Serum metabolomics analysis revealed that LPC variation is associated with elevation in toxicity. LPCs are generated by the action of phospholipase A2 on membrane phosphatidylcholine (Adibhatla and Hatcher, 2008), which are the most abundant cellular phospholipids associated with a variety of physiological and pathological processes including inflammation and atherosclerosis (Carlquist et al., 2007). Earlier studies revealed that increased LPC was implicated in thioacetamide-induced chronic liver necrosis, which might be through elevated phospholipase A2 activity (Osada et al., 1988). However, in this study, C20:4-LPC AA abundance was significantly reduced by 60% and associated with decreased LPC, such as C18:0-LPC, C20:3-LPC, C22:6-LPC, and C18:3-LPC. Indeed, it was reported that LPC could be metabolized by multiple P450s (Cho et al., 2008), and 50 to 75% of P450-dependent AA metabolites are formed by liver microsomes (Sacerdoti et al., 2003). Thus, catabolism of LPC could be potentiated by RIF-induced hPXR activation. LPC/AA metabolites could possibly exacerbate liver disease, particularly cirrhosis, and play a key role in the pathophysiology of portal hypertension and renal failure (Murray and Brater, 1993). Thus, the role of LPC, phospholipase, PXR-mediated P450 induction, and APAP hepatotoxicity required further investigation.
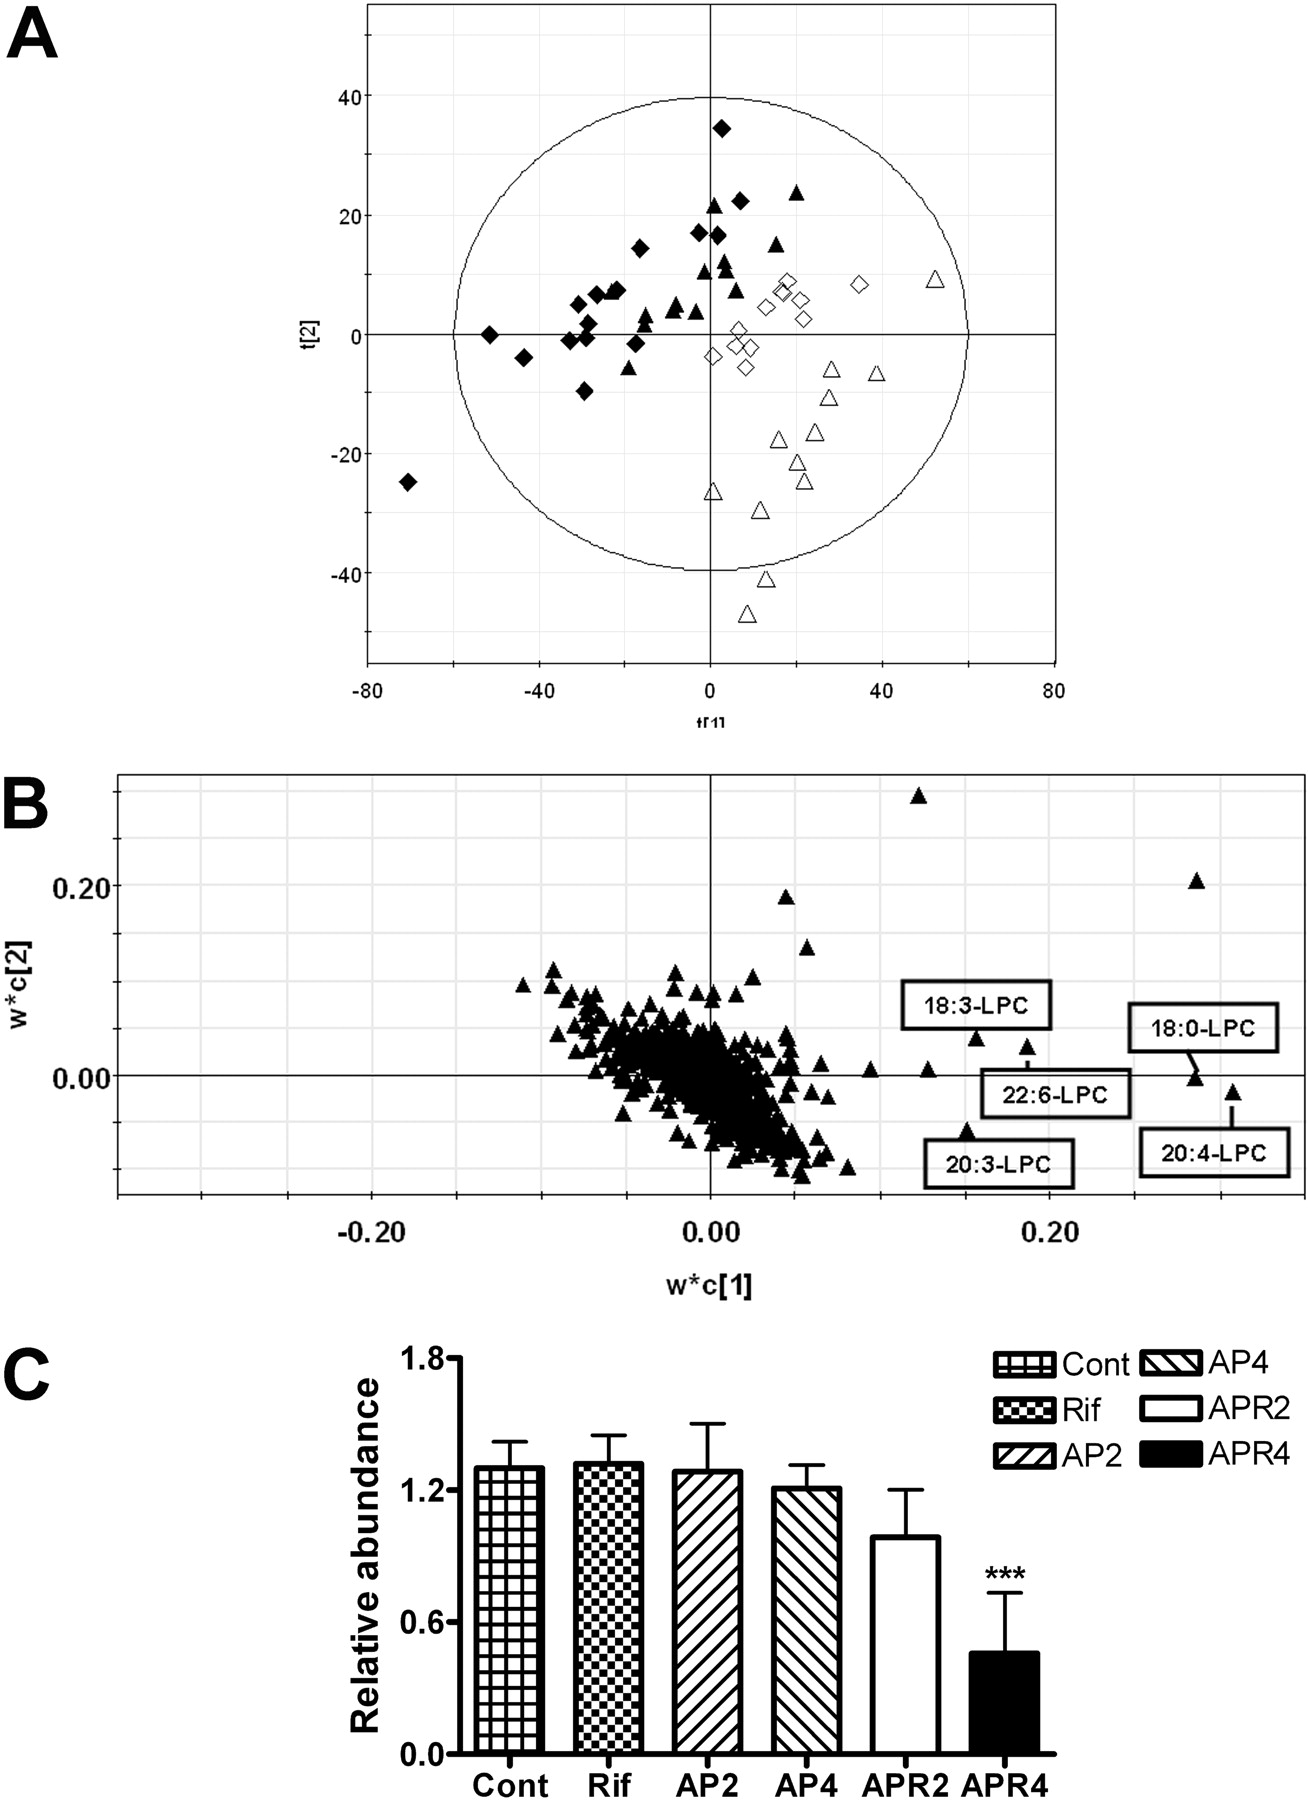
Analysis of APAP-treated serum through LC-MS-based metabolomics. A, scores plot of a PLS-DA model on 1-, 2-, 4-, and 8-h serum samples from AP2, AP4, APR2, and APR4 mice. A two-component PLS-DA model was constructed to characterize the relationship among four mouse groups (four mice per group), including APAP single-treated mice (⋄, AP2; ▵, AP4); and APAP/rifampicin coadministration mice (♦, APR2; ▴, APR4). The t[1] and t[2] values represent the scores of each sample in principal component 1 and 2, respectively. Fitness (R2) and prediction power (Q2) of this PLS-DA model are 0.301 and 0.366, respectively. B, loadings plot of chemical ions from 1-, 2-, 4-, and 8-h serum samples. The w*c[1] and w*c[2] values represent the contributing weights of each ion to principal components 1 and 2 of the PLS-DA model, respectively. Major ions contributing to the separation of wild-type mice treated with 400 mg/kg APAP/rifampicin from other mouse groups are labeled as C20:4-LPC, C18:0-LPC, C20:3-LPC, C22:6-LPC, and C18:3-LPC, respectively. C, relative abundance of AA (C20: 4-LPC) in serum normalized by the internal standard. The value of AA in each group was an average of the contents of 1, 2, 4, and 8 h. Debrisoquine was loaded as the internal standard. The mean ± S.D. is shown (n = 12; ***, p < 0.001).
In summary, this study in TgCYP3A4/hPXR mice revealed that CYP3A4 is involved in hPXR agonist-activated APAP toxicity. Nevertheless, determination of the molecular and signaling pathways involved in APAP toxicity requires additional studies. However, several of the observations reported herein implied that human PXR is involved in APAP-induced toxicity through its transcriptional activation of CYP3A4. Thus, PXR activators, such as rifampicin or other prescribed drugs and dietary nutrients, should be used cautiously when possible over-the-counter use of APAP is indicated. Increased toxicity of APAP should be included in the list of possible drug-drug interactions through PXR-mediated metabolic activation. Finally, metabolomics seems to be an efficient and useful platform with which to investigate drug metabolites and endogenous biomarkers of APAP-induced liver injury as also was noted in earlier studies (Chen et al., 2009).
Acknowledgments
We thank John Buckley (Laboratory of Metabolism/National Cancer Institute/National Institutes of Health) for assistance with the animal investigations and the National Institutes of Health Fellows Editorial Board for manuscript editing.
Footnotes
-
This work was supported in part by the National Cancer Institute Intramural Research Program; and the U.S. Smokeless Tobacco Company.
-
Article, publication date, and citation information can be found at http://dmd.aspetjournals.org.
-
doi:10.1124/dmd.109.027565.
-
ABBREVIATIONS: APAP, acetaminophen; NAPQI, N-acetyl-p-benzoquinone imine; P450, cytochrome P450; PXR, pregnane X receptor; TgCYP3A4/hPXR, double transgenic mice expressing human PXR and CYP3A4; RIF, rifampicin; MDZ, midazolam; KTZ, ketoconazole; DEB, debrisoquin; 1′-OH-MDZ, 1′-hydroxy-midazolam; Cys-APAP, cysteine-APAP; NAC-APAP, 3-N-acetyl-cysteinyl-APAP; APAP-G, APAP O-glucuronide; APAP-S, APAP sulfate; Cont, control; Rif, rifampicin treatment alone; AP mice, mice administrated APAP; APR mice, mice administered APAP and rifampicin; ALT, alanine aminotransferase; AST, aspartate aminotransferase; BUN, blood urea nitrogen; GSH, reduced glutathione; H2O2, hydrogen peroxide; PCR, polymerase chain reaction; qPCR, quantitative polymerase chain reaction; CT, cycle threshold; GAPDH, glyceraldehyde-3-phosphate dehydrogenase; LC, liquid chromatography; MS, mass spectrometry; UPLC, ultra-performance liquid chromatography; SAMP, S-(5-acetylamino-2-hydroxyphenyl)mercaptopyruvic acid; TOFMS, time-of-flight mass spectrometry; IS, internal standard; PCA, principal components analysis; PLS-DA, partial least-squares discriminant analysis; GS-APAP, glutathione-APAP; ROS, reactive oxygen species; LPC, lysophosphatidylcholines; AA, arachidonic acid.
-
↵
 The online version of this article (available at http://dmd.aspetjournals.org) contains supplemental material.
 - Accepted May 21, 2009.
- Received March 16, 2009.
- U.S. Government work not protected by U.S. copyright


