


Abstract
In smokers, the primary pathway of nicotine metabolism is P450 2A6-catalyzed 5′-oxidation. The nicotine Δ5′(1′)-iminium ion product of this reaction is further metabolized to cotinine by aldehyde oxidase. Previous investigators have reported kinetic parameters for cotinine formation using human liver cytosol as a source of aldehyde oxidase. Using [5-3H]nicotine and radioflow high-performance liquid chromatography analysis, we determined kinetic parameters for nicotine 5′-oxidation by P450 2A6 and the closely related human extrahepatic P450 2A13 as well as the rodent P450s 2A3, 2A4, and 2A5. The formation of both cotinine and nicotine Δ5′(1′)-iminium ion was monitored. The Km and Vmax values for P450 2A6 were 144 ± 15 μM and 1.30 ± 0.05 pmol/min/pmol, respectively. Previously reported Km values for cotinine formation by P450 2A6 in the presence of cytosol were much lower, ranging from 11 to 45 μM. P450 2A13 was a somewhat better catalyst of nicotine Δ5′(1′)-iminium formation, with 2-fold lower Km and 2-fold higher Vmax values than P450 2A6. The rat P450 2A3 and the mouse P450 2A5, which are 85 and 84% identical to P450 2A6, were much more efficient catalysts of nicotine 5′-oxidation. P450 2A4 was not an efficient catalyst of nicotine metabolism. Whereas 5′-oxidation was the major pathway of nicotine metabolism for all five P450 2A enzymes, these enzymes also catalyzed methyl oxidation. Nornicotine, the product of this reaction was detected as 5 to 15% of the total nicotine metabolites. Nornicotine is the amine precursor to the esophageal carcinogen N′-nitrosonornicotine. Therefore, methyl oxidation of nicotine by P450 2A6 or P450 2A13 followed by nitrosation of nornicotine are possible endogenous pathways of N′-nitrosonornicotine formation.
Nicotine is the major addictive agent in tobacco (Benowitz, 1988), and 5′-oxidation of this alkaloid is the primary pathway of its metabolism in smokers (Gorrod and Schepers, 1999). The product of this reaction, 5′-hydroxynicotine, is in equilibrium with nicotine Δ5′(1′)-iminium ion (Fig. 1). The formation of cotinine from the iminium ion is catalyzed by a cytosolic enzyme, aldehyde oxidase (Brandänge and Lindblom, 1979). In humans, P450 2A6 is the major catalyst of nicotine 5′-oxidation (Cashman et al., 1992; Nakajima et al., 1996; Messina et al., 1997; Yamazaki et al., 1999), and the extent of nicotine 5′-oxidation by individuals who do not express P450 2A6 is decreased >85% (Kitagawa et al., 1999; Yamanaka et al., 2004). A role for P450 2A6 in nicotine 5′-oxidation in human liver microsomes was first reported by Cashman et al. (1992) and subsequently by Nakajima et al. (1996) and Messina et al. (1997). The latter two groups also reported kinetic parameters for cotinine formation by lymphoblastoid expressing P450 2A6 when coincubated with aldehyde oxidase. A more recent publication reported kinetic parameters for cotinine formation by P450 2A6 heterologously expressed in baculovirus/Sf21 cells (Yamazaki et al., 1999). In all of these studies, cotinine was monitored, not the Δ5′(1′)-iminium ion or any other nicotine metabolites.
Several years ago, we characterized the formation of amino ketone (Fig. 1) by P450 2A6 and human liver microsomes (Hecht et al., 2000). Amino ketone is a product of nicotine 2′-oxidation that is in equilibrium with 2′-hydroxynicotine and the Δ2′(1′)-iminium ion (Fig. 1). Nicotine may also be oxidized at the methyl carbon to form N′-(hydroxymethyl)nornicotine that exists in equilibrium with the methylene-iminium ion (Fig. 1). It is unknown whether N′-(hydroxymethyl)-nornicotine is a product of either P450 2A6 or human liver microsomal metabolism. However, nornicotine, a nonenzymatic decomposition product of N′-(hydroxymethyl)nornicotine is a metabolite of nicotine in smokers (Benowitz et al., 1994). In the current study, the relative rates of nicotine 5′-, 2′-, and methyl-oxidation by P450 2A6 are investigated and compared with the rates for P450 2A13, an extrahepatic P450 thought to be important in the metabolic activation of the tobacco-specific lung carcinogen NNK (Jalas et al., 2005). In addition, nicotine metabolism by rodent P450 2A enzymes is studied.
Rats and mice are routinely used to characterize the addictive effects of nicotine; however, there is minimal data on what P450s catalyze nicotine 5′-oxidation in these animals. There are data supporting a role for P450 2B1 as the catalyst of nicotine metabolism in the rat liver (Hammond et al., 1991; Nakayama et al., 1993). Nicotine metabolism by mouse P450s has not been reported previously. However, in both the lung and the liver of mice, there are two enzymes, P450 2A4 and 2A5, that are closely related to the human P450s 2A6 and 2A13, which are possible catalysts of nicotine 5′-oxidation in the mouse (Honkakoski and Negishi, 1997). The rat liver does not contain a P450 2A6 homologous enzyme; however, a closely related enzyme, P450 2A3, is present in rat lung (Gopalakrishnan et al., 1999). P450 2A3 is an extrahepatic enzyme analogous to the extrahepatic human P450 2A13. These five P450 2A enzymes are 84 to 96% identical and have a number of common substrates (Honkakoski and Negishi, 1997; von Weymarn et al., 1999; von Weymarn and Murphy, 2003; Wong et al., 2005). Of particular note is that all five P450 2A enzymes catalyze the oxidation of the tobacco-specific nitrosamine N′-nitrosonornicotine (NNN) (Wong et al., 2005). NNN is structurally similar to nicotine, differing by only the replacement of the methyl group with a nitroso group. Therefore, we expected that P450 2A13 and the rodent P450 2A enzymes would, like P450 2A6, catalyze nicotine metabolism. In the work presented here, we determined the rate of nicotine 5′-oxidation by P450s 2A3, 2A4, and 2A5 compared with P450 2A13 and P450 2A6 both in the presence and absence of aldehyde oxidase. Kinetic parameters were determined for the 5′-oxidation of nicotine by these five enzymes.

Nicotine oxidation pathways.
Materials and Methods
Chemicals and Enzymes. (S)-5′-Bromonicotine was synthesized as described previously (Kuehl and Murphy, 2003). [5-3H](S)-Nicotine was prepared by catalytic tritiation of (S)-5′-bromonicotine by ChemSyn (Lenexa, KS) and provided to us as a mixture (<70% [5-3H](S)-nicotine). Before use, the [5-3H](S)-nicotine was purified by HPLC using the system described below for the metabolism studies. Purified [5-3H](S)-nicotine was stored in 0.5% trifluoroacetic acid (TFA) at -80°C and used within 2 weeks of purification. Amino ketone was provided by Stephen Hecht (University of Minnesota, Minneapolis, MN). (S)-Nicotine, (S)-cotinine, (S)-nornicotine, and all other biochemical reagents were obtained from Sigma-Aldrich (St. Louis, MO) and were of analytical grade. Human liver cytosol was prepared in our laboratory by a previously established method (Fowler et al., 1994) from liver samples kindly provided by F. Peter Guengerich (Vanderbilt University, Nashville, TN). Cytosol protein concentration was determined using Coomassie Plus protein assay reagent kit (Pierce Chemical, Rockford, IL). The enzymes used in this study were microsomal preparations from baculovirus/Spodoptera frugiperda (Sf9) expression systems. Microsomes containing P450s 2A3 and 2A13, provided by Dr. Xinxin Ding (New York State Department of Health, Albany, NY), were prepared as described previously (Liu et al., 1996). Microsomal preparations of P450s 2A4, 2A5, 2A6, and human NADH-cytochrome P450 oxidoreductase (OR) were prepared by previously described methods (Patten et al., 1996; Felicia et al., 2000).
[5-3H]Nicotine Metabolism by P450s. The P450 enzymes were briefly preincubated with OR, in a 1:2 molar ratio. The final incubation mixtures contained 50 mM Tris buffer, pH 7.5, an NADPH generating system (0.4 mM NADP+, 10 mM glucose 6-phosphate, and 0.4 unit/ml glucose phosphate dehydrogenase), cytochrome P450 (2A3, 11 pmol; 2A4, 67.8 pmol; 2A5, 22.4 pmol; 2A6, 14.7 pmol; and 2A13, 21 pmol), OR, and [5-3H]nicotine (specific activity 0.025–0.91 Ci/mmol, 1–750 μM). The final incubation volume was 200 μl. The samples were incubated for 10 min at 37°C, either with or without human liver cytosol (0.5 mg protein/ml, unless otherwise noted). Reactions were terminated by the addition of 20 μl of 10% TFA and then centrifuged at 1500g (10 min), and the supernatant was removed and filtered through a 0.2-μm nylon membrane and analyzed by HPLC the same day. Linearity with time and enzyme concentration was determined for each enzyme before determining kinetic parameters.
Kinetic parameters for nicotine 5′-oxidation were calculated from the sum of cotinine and Δ5′(1′)-iminium ion. Rates determined from reactions that contained cytosol. For each of the five enzymes the rate of 5′-oxidation was also determined in the absence of cytosol at several different concentrations of nicotine and shown not to be significantly different from that in the presence of cytosol. Michaelis-Menten constants for the total 5′-oxidation rate for each enzyme were calculated using the EZ-Fit 5 software (Perrella Scientific, Amherst, NH).
For P450s 2A3, 2A5, and 2A13, the rate of formation of nornicotine was determined at the same nicotine concentrations used for determination of the kinetic parameters (Table 2). However, lower rates of metabolism and higher Km values for P450 2A4 and P450 2A6 did not allow quantification of nornicotine at all concentrations due to the limit of detection for the conditions used. Therefore, the extent of nornicotine formation by P450s 2A4 and 2A6 was determined in separate experiments carried out in duplicate with 100 μM [5-3H]nicotine and 100 pmol of P450 enzyme. The reaction time was 45 min, and cytosol was not added. Reactions were terminated and analyzed as described above.
Kinetic parameters for nicotine 5′ oxidation by P450s 2A enzymes The enzyme assay conditions and the quantitation of products from nicotine 5′-oxidation are described under Materials and Methods. The concentrations of nicotine used for P450 2A3 and P450 2A5 were 1.0, 2.5, 5, 10, 25, 50, and 100 μM. For P450 2A6, two additional concentrations were used: 250 and 500 μM. For P450 2A4, the nicotine concentrations were 10, 25, 50, 100, 250, 500, and 750 μM. Two independent experiments were carried out for each enzyme, and for each experiment duplicate reactions were carried out for each nicotine concentration. Kinetic and statistical analyses were done using the EZ-Fit 5 Kinetics program. Values reported are ±S.E.
Quantification of P450 2A13 metabolites for the determination of kinetic parameters was carried out twice, once using the above-mentioned method of analysis and a second time as follows. The P450 2A13 reactions were terminated after 30 min by the addition of 20 μl of 1 N NaOH, followed by the addition of 5 nmol of cotinine as an internal standard. Nicotine and its metabolites were extracted into 1 ml of chloroform, and after phase separation back-extracted into 200 μl of a 5% TFA solution and analyzed by HPLC.
Radioflow HPLC Analysis of the Metabolites. A Waters system equipped with a UV detector and a β-RAM radioflow detector (IN/US Systems, Tampa, FL) was used. The filtered samples (100 μl or less) were injected onto a Luna C18 reverse phase HPLC column (0.46 × 25 cm, 5 μm; Phenomenex, Torrance, CA), and nicotine and metabolites were eluted isocratically (0.2% TFA in water) over 30 min at a flow rate of 0.7 ml/min as described previously (Hecht et al., 2000). The scintillant (Monoflow X; National Diagnostics, Atlanta, GA) flow rate was 2.1 ml/min. [5-3H]Nicotine and [5-3H]nicotine metabolites were monitored and quantified by radioflow detection, and nicotine and added metabolite standards were monitored by UV detection at 254 nm.
Characterization of the “8-min Peak”. For each P450 2A enzyme reaction with 50 μM [5-3H]nicotine in the absence of cytosol, the 8-min peak was collected by HPLC. The TFA present in the HPLC solvent was neutralized with 0.1 N NaOH so that the sample pH was 7.0 to 8.0. The samples were split in half, and Tris buffer (100 mM; pH 7.5) was added to bring the total volume to 950 μl. Human liver cytosol (50 μl; 22 mg of protein/ml) was added to one half of the sample, and water (control) was added to the other. Samples were incubated at 37°C for 1 h before terminating the reactions with the addition of 50 μl of 10% TFA. Samples were centrifuged at 1500g (10 min), and the supernatant was removed and filtered through a 0.2-μm nylon filter and analyzed by HPLC with radioflow detection and coinjection with cotinine. MS analysis on a Finnigan LCQ Deca instrument (Thermo Electron Corporation, Waltham, MA) of the 8-min peak was carried out for P450s 2A5, 2A6, and 2A13. The metabolite was collected from reactions with 100 μM [5-3H]nicotine in the absence of cytosol. After reanalysis of a fraction of the collected peak by radioflow HPLC to quantify the product, 0.5 N NaOH was added to the collected fraction (100 μl), and the metabolite was extracted into 200 μl of chloroform. After phase separation, the metabolite was back-extracted into 50 μl of 5% hydrochloric acid solution in water, and a 10-μl aliquot (containing 10 pmol of metabolite) was directly infused into the LCQ Deca operating in the positive ion mode with electrospray ionization. The MS settings were as follows: capillary temperature, 275°C; source voltage, 5 kV; source current, 3.5 μA; and sheath gas, 70 arbitrary units. The MS apparatus was operated in the positive ion mode. Full scan of m/z in the ranges of 50 to 500 was monitored.
LC/MS/MS Analysis of P450 2A5-, 2A6-, and 2A13-Generated Nicotine Metabolites. Reactions were carried out for each enzyme with 100 μM nicotine as described above, with no cytosol added. After filtration, terminated reactions samples (5 μl) were analyzed by liquid chromatography-electrospray ionization MS on a Finnigan TSQ Ultra AM instrument. A Luna 3 μm C18 (150 × 0.50 mm; Phenomenex) capillary column was used. The mobile phase was isocratic (8% formic acid and 0.025% TFA in water). MS settings were as follows: capillary temperature, 300°C; spray voltage, 5000 V; collision energy, 20 V; collision pressure, 1.5 mTorr; source collision-induced dissociation, -12 V; and scan time, 0.2 s. The MS apparatus was operated in the positive ion mode. Before the analysis of the nicotine metabolite mixtures, nicotine, cotinine, nornicotine, and amino ketone standards were analyzed by LC/MS/MS. Product ion spectra for nicotine m/z 163 (M + H), cotinine m/z 177 (M + H), nornicotine m/z 148 (M+), and amino ketone m/z 179 (M + H)+ were obtained in the m/z range 50 to 180. Retention times were 5.5 min for nornicotine, 5.8 min for nicotine, 8.3 min for aminoketone, and 8.9 min for cotinine. In addition, LC/MS/MS analysis of the collected 8-min peak, tentatively identified as nicotine Δ5′(1′)-iminium ion, was carried out. A product ion spectrum was obtained at m/z 161 scanning from m/z 50 to 165. The retention time of this metabolite was 5.2 min. Selective reaction monitoring (SRM) for amino ketone detection in P450 2A6 nicotine reactions was performed based on amino ketone standard MS/MS product spectrum, monitoring m/z 78, 106, and 148.
Results
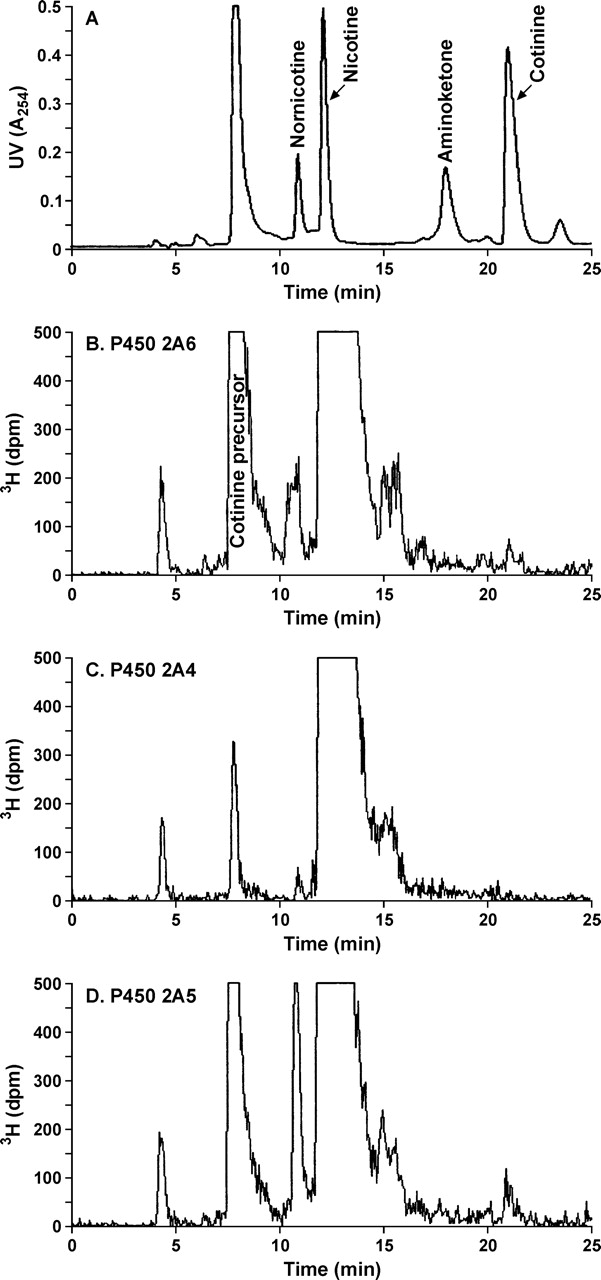
To quantify P450 2A-catalyzed nicotine metabolism, the 3H-metabolites generated by each of the heterologously expressed enzymes were analyzed directly by radioflow HPLC. Representative chromatograms are presented in Fig. 2. Samples were coinjected with three available nicotine metabolites—nornicotine, amino ketone, and cotinine (Fig. 2A). The peak detected by UV at 8 min (Fig. 2A) is NADPH and NADP+ present in the reaction mixture. In all samples, the major radioactive peak eluted at 12.5 min; this is [5-3H](S)-nicotine. The small radioactive peak eluting at 4 min is present in control incubations without enzyme. The major metabolite peak detected for all enzymes eluted at 8 min. If the same reactions were carried out in the presence of cytosol as a source of aldehyde oxidase, the major metabolite peak coeluted with cotinine (Fig. 3). A small cotinine peak was detected in the absence of cytosol.

Radioflow HPLC analysis of [5-3H]nicotine metabolites generated by P450 2A enzymes in the absence of cytosol. [5-3H]Nicotine (100 μM; 50 nCi/nmol) was incubated for 45 min with P450 2A6 (20 pmol) (B), P450 2A4 (200 pmol) (C), or P450 2A5 (45 pmol) (D), and 100 μl of the reaction mixture with added metabolite standards (A) was analyzed as described under Materials and Methods. In A, the peak at 8 min is NADP+ and NADPH present in the reaction mixture.

Radioflow HPLC analysis of P450 2A13 catalyzed nicotine metabolism in the presence and absence of cytosol as a source of aldehyde oxidase. [5-3H]Nicotine (100 μM; 100 nCi/nmol) was incubated with 15 pmol of P450 2A13 with (A) or without (B) cytosol (5 mg/ml) for 30 min. Details of the reaction and analysis are as described under Materials and Methods.
When the 8-min peak was collected and treated with cytosol, it was quantitatively converted to cotinine, confirming this metabolite was a precursor to cotinine, either the Δ5′(1′)-iminium ion and/or 5′-hydroxynicotine (Fig. 1). To further investigate the identity of this metabolite, it was analyzed by liquid chromatography/mass spectrometry and LC/MS/MS. A single ion of m/z 161 was detected upon MS analysis of the collected 8-min peak. Tandem mass spectrometric analysis of m/z 161 (nicotine Δ5′(1′)-iminium ion, M+), resulted in a single daughter ion of m/z 130. In addition, when the mixture of P450 2A-generated nicotine metabolites was analyzed directly by capillary LC/MS/MS for m/z 161, a metabolite was detected eluting 0.6 min before nicotine (Fig. 4A). The major daughter ion of this metabolite was m/z 130 (Fig. 4A, inset). These data are consistent with the identification of this peak as nicotine Δ5′(1′)-iminium ion.
A second radioactive metabolite peak (11 min; Fig. 2D) was easily detected as a product of P450 2A5-catalyzed nicotine metabolism. This metabolite, which coeluted with nornicotine (Fig. 2A), was also detected as a product of metabolism by the other P450 2A enzymes, although it was not always easily quantified. When the P450 2A5 metabolite was collected and analyzed by LC/MS/MS, the product ion spectra was identical to nornicotine standard. The rate of formation of nornicotine was similar in the presence or absence of cytosol. To further characterize the presence of nornicotine as a product of P450 2A metabolism, reaction mixtures were analyzed directly by capillary LC/MS/MS. A metabolite m/z 148 with product ion identical to nornicotine was detected that eluted at 5.55 min, between the 5′-iminium ion and nicotine, the correct retention time for nornicotine (Fig. 4B). The extent of nicotine methyl oxidation (as measured by nornicotine formation) relative to nicotine 5′-oxidation was determined by radioflow HPLC analysis for all five P450 2A enzymes. The average percentage of formation of nornicotine (per total metabolism) by P450s 2A3, 2A5, and 2A13 was calculated for a range of nicotine concentrations from 1 to 100 μM to be 13.2 ± 1.4, 14.8 ± 0.9, and 11.2 ± 2.0%, respectively. Due to the lower rates of nornicotine formation by P450s 2A4 and 2A6, this metabolite was not detected as an easily quantifiable peak for these two enzymes at the lower nicotine concentrations. At 100 μM nicotine, nornicotine accounted for 12% of the total metabolites formed by P450s 2A4 and 5% by P450 2A6.
None of the P450 2A enzymes generated detectable levels of [3H]aminoketone (Figs. 2 and 3). The formation of this product of nicotine 2′-oxidation by P450 2A6 was further investigated by LC/MS/MS analysis using SRM for the three ions present in the product ion spectra of aminoketone standard (Fig. 4C). The SRM transitions monitored were m/z (179 → 148) [M + H–NH2CH3], m/z (179 → 106) [C5NH4CO+], and m/z (179 → 78) [C5NH4+]. These three fragments were detected upon LC/MS/MS analysis of the products of P450 2A6-catalyzed nicotine metabolism in the correct abundance at 8.3 min the retention time of amino ketone (Fig. 4D). The rate of aminoketone formation was not quantified by LC/MS/MS. However, based on the limit of detection for the [5-3H]nicotine experiments the amount of aminoketone formed by P450 2A6 would be less than 2% of the products of 5′-oxidation.
Aminoketone is in equilibrium with 2′-hydroxynicotine and the Δ2′(1′)-iminium (Fig. 1). Therefore, we investigated the P450 2A6-catalyzed formation of these compounds by LC/MS/MS. When analyzing for the 5′-iminium ion, a second m/z 161 peak was detected eluting just past nicotine (Fig. 4A). As with the 5′-iminium ion, the only product ion detected was m/z 130 (Fig. 4A, inset). This peak was not present when the collected 5′-iminium ion was analyzed, suggesting this is a metabolite peak, possible the 2′-iminium ion. Consistent with the identity of this peak as a metabolite is that with both P450 2A6 and P450 2A5, two small radioactive peaks eluting between 15 and 16 min were detected (Fig. 2). However, due to the large amount of radioactivity nicotine in the sample, it was not possible to confirm whether either of these radioactive peak were products of the reaction.

LC/MS/MS analysis of P450 2A6-catalyzed nicotine metabolism. A, monitoring m/z 161, nicotine Δ5′(1′)-iminium ion, M+ (the inserts are product ion spectra of the two peaks). B, monitoring m/z 148, nornicotine, M+ (the inset is the product ion spectra of the 5.6-min peak). C, product ion spectra of amino ketone standard, m/z 179. D, select reaction ion monitoring for amino ketone as a metabolite of P450 2A6. Nicotine, m/z 163, [M + H]+, elutes at 5.8 min and cotinine, m/z 177 [M + H]+, elutes at 8.9 min.
Previous investigators have analyzed P450 2A6-catalyzed nicotine 5′-oxidation by measuring the formation of cotinine in the presence of cytosol. To determine the kinetic parameters of (S)-nicotine 5′-oxidation, we initially did the same; however, we monitored both the formation of cotinine and the 5′-iminium ion. At the higher concentrations of nicotine, the amount of cytosol added was often not sufficient to completely convert the iminium ion to cotinine. The data in Table 1 for P450s 2A13, 2A3, and 2A5 clearly illustrate this point. Under the conditions of this experiment, the rate of cotinine formation by P450 2A13 did not increase significantly above a concentration of 25 μM. However, the rate of iminium ion formation continued to increase. Significant amounts of the 5′-iminium ion were detected at all nicotine concentrations for both P450 2A3 and P450 2A5 (Table 1). Nicotine Δ5′(1′)-iminium ion was not detected in the kinetic analyses of either P450 2A6 or P450 2A4 (data not shown) under the conditions of these experiments.
Metabolism of nicotine by P450 2A13, P450 2A3, and P450 2A5: formation of the Δ5′(1′)iminium ion versus cotinine P450 2A enzymes were incubated with [5-3H]nicotine (specific activity 1–200 μM) at 37°C for 30 min in the presence of human liver cytosol as described under Materials and Methods. The formation of product was measured using HPLC with radioflow detection.
The kinetic parameters for 5′-oxidation of nicotine were determined for the five P450 2A enzymes and are presented in Table 2. Both cotinine and the 5′-iminium ion were quantified. P450s 2A3 and P450 2A5 were the most efficient catalysts of this reaction, and their Km and the Vmax values were very similar. For P450 2A3 the Km was 8.5 ± 0.07 μM and the Vmax 1.68 ± 0.04 pmol/min/pmol and for P450 2A5 Km was 7.7 ± 0.8 μM and Vmax 1.53 ± 0.04 pmol/min/pmol. The Km values for the human enzymes P450 2A6 and P450 2A13 were 10- and 20-fold higher than for P450s 2A3 and 2A5. The Vmax for P450 2A6 was similar to P450s 2A3 and 2A5, and the Vmax value for P450 2A13 was about 2-fold greater. P450 2A4 was by far the least efficient catalyst. The Vmax/Km value was 0.001 compared with 0.199 for P450 2A5. The lower efficiency of P450 2A4-catalyzed nicotine 5′-oxidation is primarily due to its low Vmax, 0.14 pmol/min/pmol. The next least efficient catalyst was P450 2A6, Vmax/Km = 0.009.
Discussion
We report here the characterization of nicotine metabolism by five P450 2A enzymes with greater than 84% protein sequence identity. Nicotine 5′-oxidation was quantified directly, not only as cotinine formation. For all five enzymes, MS/MS analysis of the major primary product of 5′-oxidation was consistent with its identity as nicotine Δ5′(1′)-iminium ion. However, we cannot exclude the possibility that this metabolite was 5′-hydroxynicotine that was converted to the iminium ion in the mass spectrometer. However, this is unlikely since our analysis was carried out under acidic conditions at which the iminium ion predominates (Brandänge and Lindblom, 1979). The formation of nicotine Δ5′(1′)-iminium ion was quantified previously as the major product of both rabbit lung P450 2B4 and rat liver P450 2B1-catalyzed nicotine metabolism (Williams et al., 1990b).
It is interesting to compare the kinetic parameters for nicotine 5′-oxidation by these P450 2A enzymes to the parameters determined previously by us for the nicotine-derived carcinogens (S)-NNN and NNK (Jalas et al., 2005; Wong et al., 2005). As was true for NNN 5′-oxidation and NNK α-hydroxylation, rat P450 2A3 and mouse P450 2A5 were excellent catalysts of nicotine 5′-oxidation. The Km values for the 5′-oxidation of nicotine for both P450 2A3 and P450 2A5 were similar to those for NNK α-hydroxylation and 2.5- to 10-fold higher than those for the 5′-oxidation of (S)-NNN (Wong et al., 2005). The 5′-oxidation of both (S)-nicotine and (S)-NNN by the mouse P450 2A4, which is 98% identical to P450 2A5, was much less efficient. Likewise P450 2A4 is not an efficient catalyst of NNK α-hydroxylation. The relative efficiencies of the human P450s 2A6 and 2A13 for these three substrates are much more variable than the rodent enzymes. P450 2A6 is an excellent catalyst of (S)-NNN 5′-oxidation, with a Km value of <3 μM, significantly lower than the 144 μM we report here for nicotine 5′-oxidation. P450 2A6 is a poor catalyst of NNK α-hydroxylation, but P450 2A13 is an outstanding catalyst, whereas P450 2A6 and 2A13 only differ modestly in their relative catalytic activity for the 5′-oxidation of (S)-nicotine and (S)-NNN.
Kinetic parameters have been determined previously for cotinine formation by P450 2A6. Reported Km values ranged from 11 to 45 μM (Nakajima et al., 1996; Messina et al., 1997; Yamazaki et al., 1999). The lowest value of 11 μM was reported using microsomes from Sf21 cells expressing P450 2A6, similar to the Sf9 baculovirus expression system used in the present study. We report here a significantly higher Km value of 144 μM. One explanation for the much higher Km value reported here for P450 2A6 is that in the previous studies, the rate of cotinine formation was not a measure of total nicotine 5′-oxidation.
In Table 1, we present data for nicotine metabolism by P450 2A enzymes in the presence of human liver cytosol. Detectable amounts of the 5′-iminium ion were present in reactions with P450s 2A3, 2A4, and 2A13. Under the conditions of our experiment, the rate of cotinine formation for P450 2A13 reached a maximum at about one-fourth the nicotine concentration at which the rate of total nicotine 5′-oxidation was the greatest. In P450 2A3 and 2A4, the rate of cotinine formation and total 5′-oxidation reached a maximum at similar nicotine concentrations; however, nicotine Δ5′(1′)-iminium ion was detected at all concentrations.
The nicotine concentration at which cotinine formation will be saturated is dependent not only on the ratio of aldehyde oxidase to P450 enzyme but on the rate of the reaction and the relative Km value of the P450 enzyme and aldehyde oxidase. The Km value for the formation of cotinine from nicotine Δ5′(1′)-iminium ion by human liver aldehyde oxidase was reported to be 0.85 μM (Obach, 2004), very low compared with the Km value for nicotine 5′-oxidation for P450 2A enzymes.
The conditions of our kinetic experiments with P450 2A6 in the presence of cytosol were such that we did not detect the nicotine Δ5′(1′)-iminium ion. However, we monitored this metabolite and therefore are confident that all products of 5′-oxidation were included in our determination of kinetic parameters. This was not the case in the previous reports (Nakajima et al., 1996; Messina et al., 1997; Yamazaki et al., 1999). Both Nakijima et al. (1996) and Messina et al. (1997) report adding enough cytosol in human liver microsome reactions to maximize cotinine formation; however, it is not clear whether this was done for the expressed P450s or whether it was done at various nicotine concentrations. The lymphoblastoid system used by these investigators expresses very little enzyme, and the analyses were carried out close to the limit of detection for the HPLC UV assay used. The amount of cotinine generated by lymphoblastoid expressing P450 2A6 at Vmax was less than twice the reported limit of detection, 300 pmol of cotinine per milliliter of reaction (Messina et al., 1997). The limit of detection for the radioflow HPLC assay used in the present study was less than 1 pmol metabolite per milliliter of reaction, depending on the specific activity of the [5-3H]nicotine used. These differences in the sensitivity of quantitation may contribute to the different kinetic parameters reported in the previous studies.
The recently reported Km value of 20 μM for cotinine formation by P450 2A13 may also not represent the Km for nicotine 5′-oxidation since the iminium ion was not quantified, and based on our results it is likely to be present (Bao et al., 2005). We report here a Km value of 75 μM for P450 2A13-catalyzed 5′-oxidation; this is about half the value for P450 2A6. In addition, the Vmax value for P450 2A13 is 2.4 times higher than that for P450 2A6. Therefore, the data in the present study characterize P450 2A13 as a more efficient catalyst of nicotine 5′-oxidation than is P450 2A6.
In addition to nicotine 5′-oxidation, all five P450 2A enzymes catalyzed the formation of nornicotine. P450s 2A3, 2A4, 2A5, and 2A13 catalyzed nornicotine formation to similar extents (11–14.8% of total metabolism). However, P450 2A6-catalyzed nornicotine metabolism was only about 5% of total metabolism. Nornicotine formation accounts for about 0.4% of the nicotine metabolites excreted by smokers, snuff users, and individuals on the nicotine patch (Benowitz et al., 1994; Davis and Curvall, 1999). Nornicotine is formed by loss of formaldehyde from N′-(hydroxymethyl)nornicotine (Fig. 1), the likely product of the P450-catalyzed reaction. It was reported previously that the rabbit P450 2A9/10 (isolated as a mixture) was an excellent catalyst of both nicotine 5′-oxidation and methyl oxidation (Williams et al., 1990a). Nornicotine formation accounted for 24% of the total metabolites generated by these rabbit 2A enzymes, which are 84 to 85% identical to the five P450 2A enzymes in the present study (Peng et al., 1993).
In a previous study, we reported that P450 2A6 catalyzed the formation of amino ketone (a product of 2′-oxidation) at about 11% the rate of cotinine formation (Hecht et al., 2000). In the present study, no amino ketone was detected by radioflow HPLC analysis, and only a small amount was detected by LC/MS/MS analysis on P450 2A6-catalyzed nicotine metabolism. The limit of detection for a radioactive metabolite was about 2% of the nicotine Δ5′(1′)-iminium ion. There are a number of differences between the two studies. In the previous study, cytosol was included in the reaction, and cotinine was quantified by HPLC with UV detection. The formation of amino ketone was independently quantified by gas chromatography/MS analysis after derivatization with benzoyl chloride. We did not monitor the formation of nicotine Δ5′(1′)-iminium; therefore, the rate of amino ketone formation relative to total 5′-oxidation might have been significantly less than the 11% reported relative to cotinine formation. Another difference in the analysis between the two studies that may have resulted in detection of a greater amount of amino ketone is the treatment of the sample before GC/MS analysis. In the previous study, reactions were terminated with base, and then nicotine and metabolites were extracted into methylene chloride and back-extracted into acid. This manipulation of the sample may have resulted in an increased recovery of amino ketone from the reaction mixture and also may have shifted the equilibrium from the 2′-iminium ion and 2′-hydroxynicotine toward amino ketone. Experiments to accurately quantify the rate of nicotine 2′-oxidation are ongoing.
In summary, we report here that both rat P450 2A3 and mouse P450 2A5 are more efficient catalysts of nicotine 5′-oxidation than are P450 2A6 and P450 2A13. All four enzymes also catalyze methyl oxidation. The product of this reaction, nornicotine, is the amine precursor of the tobacco carcinogen NNN (Hecht, 1998). If endogenous nitrosation occurred in smokers, this would be a second source of NNN in these individuals.
Footnotes
-
This study was supported by Grant CA-84529 from the National Cancer Institute.
-
Article, publication date, and citation information can be found at http://dmd.aspetjournals.org.
-
doi:10.1124/dmd.105.004549.
-
ABBREVIATIONS: NNK, 4-(methylnitrosamino)-1-(3-pyridyl)-1-butanone; NNN, N′-nitrosonornicotine; HPLC, high-performance liquid chromatography; TFA, trifluoroacetic acid; OR, oxidoreductase; MS, mass spectrometry; LC/MS/MS, liquid chromatography/tandem mass spectrometry; SRM, selective reaction monitoring.
- Received March 1, 2005.
- Accepted April 21, 2005.
- The American Society for Pharmacology and Experimental Therapeutics


