


Abstract
CYP3A4-mediated biotransformation of (R)-N-(1-(3-(4-ethoxyphenyl)-4-oxo-3,4-dihydropyrido[2,3-d]pyrimidin-2-yl)ethyl)-N-(pyridin-3-ylmethyl)-2-(4-(trifluoromethoxy)phenyl)acetamide (AMG 487) was previously shown to generate an inhibitory metabolite linked to dose- and time-dependent pharmacokinetics in humans. Although in vitro activity loss assays failed to demonstrate CYP3A4 time-dependent inhibition (TDI) with AMG 487, its M2 phenol metabolite readily produced TDI when remaining activity was assessed using either midazolam or testosterone (KI = 0.73–0.74 μM, kinact = 0.088–0.099 min−1). TDI investigations using an IC50 shift method successfully produced inhibition attributable to AMG 487, but only when preincubations were extended from 30 to 90 min. The shift magnitude was ∼3× for midazolam activity, but no shift was observed for testosterone activity. Subsequent partition ratio determinations conducted for M2 using recombinant CYP3A4 showed that inactivation was a relatively inefficient process (r = 36). CYP3A4-mediated biotransformation of [3H]M2 in the presence of GSH led to identification of two new metabolites, M4 and M5, which shifted focus away from M2 being directly responsible for TDI. M4 (hydroxylated M2) was further metabolized to form reactive intermediates that, upon reaction with GSH, produced isomeric adducts, collectively designated M5. Incubations conducted in the presence of [18O]H2O confirmed incorporation of oxygen from O2 for the majority of M4 and M5 formed (>75%). Further evidence of a primary role for M4 in CYP3A4 TDI was generated by protein labeling and proteolysis experiments, in which M4 was found to be covalently bound to Cys239 of CYP3A4. These investigations confirmed a primarily role for M4 in CYP3A4 inactivation, suggesting that a more complex metabolic pathway was responsible for generation of inhibitory metabolites affecting AMG 487 human pharmacokinetics.
Introduction
(R)-N-(1-(3-(4-ethoxyphenyl)-4-oxo-3,4-dihydropyrido[2,3-d] pyrimidin-2-yl)ethyl)-N-(pyridin-3-ylmethyl)-2-(4-(trifluoromethoxy) phenyl)acetamide (AMG 487) is a potent and selective CXCR3 antagonist that exhibited good oral bioavailability and robust in vivo biological activity in a preclinical model of cellular recruitment (Johnson et al., 2007). In a single ascending dose phase 1 clinical study (suspension dosing), AMG 487 displayed favorable human pharmacokinetics characterized by near-proportional increases in AUC and Cmax exposure over a dose range of 25 to 1100 mg (Floren et al., 2003). Unexpectedly, the ensuing multiple ascending dose phase 1 clinical study, conducted over a dose range of 25 to 250 mg (solution dosing), produced pharmacokinetic data that revealed considerable supraproportional AUC and Cmax exposure increases upon repeated AMG 487 administration (Tonn et al., 2009). The extent of AMG 487 accumulation observed was not anticipated, given the half-life determined in the preceding single-dose study. Multiple-dose data indicated that nonlinear pharmacokinetic behavior was both time- and dose-dependent, with a key finding that decreasing metabolite/AMG 487 plasma concentration ratios as a function of dose correlated with reduced oral clearance. AMG 487 development was subsequently halted as a consequence of these findings and the realization that repeat administration may affect intrinsic clearance of the drug.
Thorough investigation into the metabolism of AMG 487 provided support for the hypothesis that nonlinear pharmacokinetics could be explained by the presence of an inhibitory metabolite (Tonn et al., 2009). CYP3A was primarily responsible for AMG 487 metabolism (Scheme 1), producing a major pyridyl N-oxide metabolite (M1) and a minor O-deethylated metabolite (M2) that underwent further CYP3A-mediated oxidation, forming an O-deethylated pyridyl N-oxide (M3). All three metabolites were detected in vitro and in plasma of multiple-dose subjects: M1 at plasma concentrations that exceeded AMG 487 and M2 and M3 at plasma concentrations notably lower than those of the parent drug. The absence of significant levels of unchanged AMG 487 in urine (<0.5% of dose) served as a basis for the claim that metabolism played a major role in AMG 487 clearance.
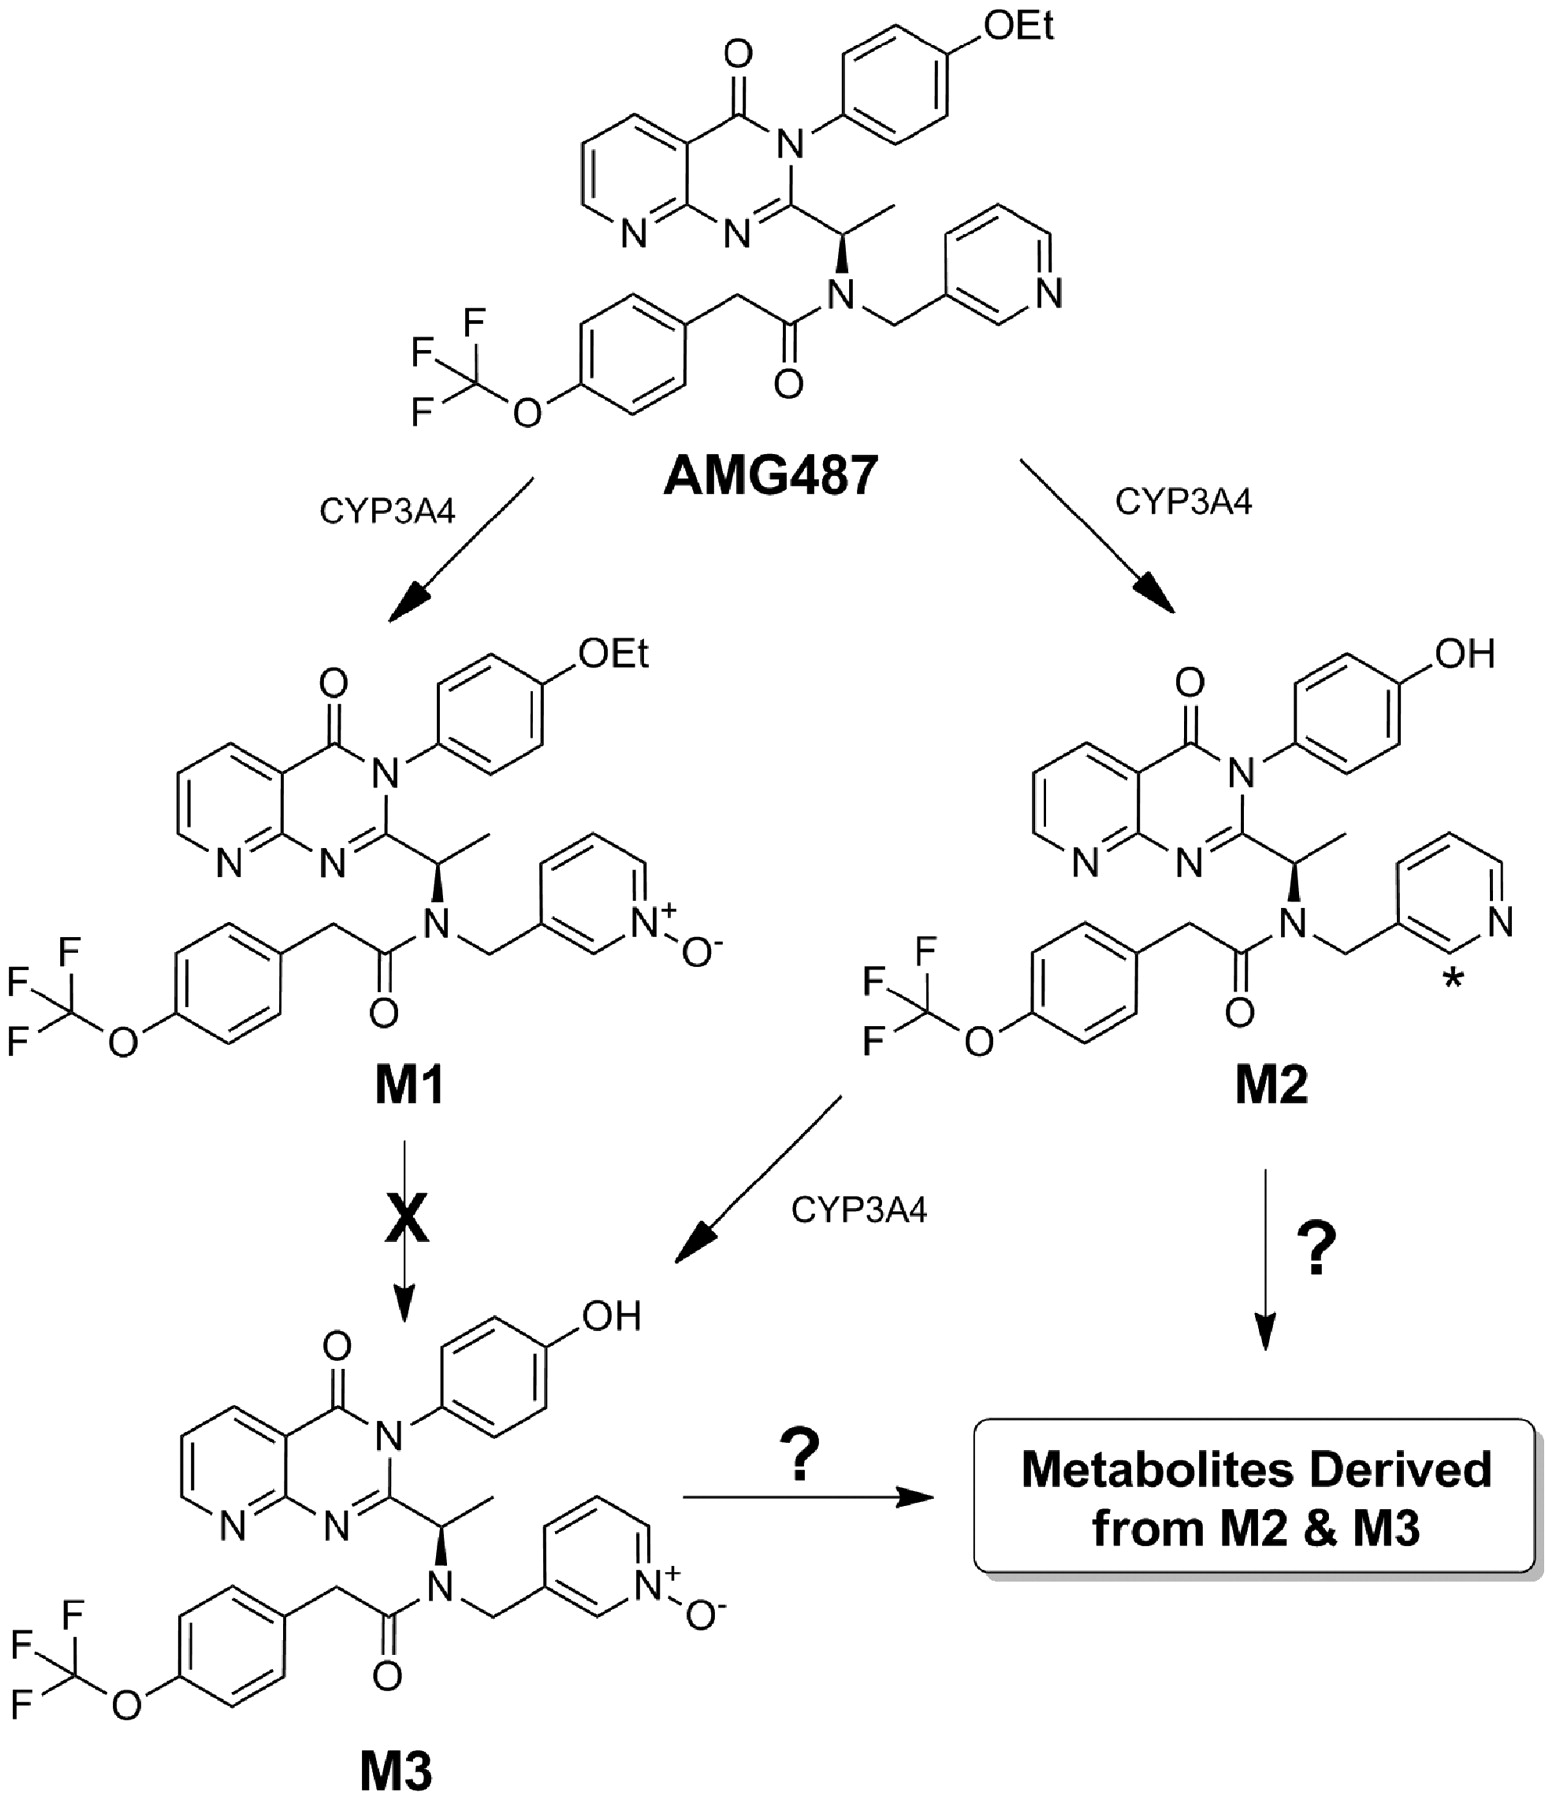
CYP3A4-mediated metabolism of AMG 487. A sequential oxidation process gives rise to M3 via M2; however, additional metabolites arising from further oxidation of M2 or M3 were previously not identified. *, position of 3H in radiolabeled material.
A survey of the three confirmed AMG 487 metabolites concluded that only M2 possessed inhibitory properties (Tonn et al., 2009). M2 was found to be a potent competitive CYP2C9 and CYP3A inhibitor (unbound IC50 = 0.7 and 1.4 μM, respectively), but perhaps more intriguing in light of the observed time-dependent pharmacokinetics was the discovery of M2-mediated TDI of microsomal CYP3A (unbound KI = 1.4 μM, kinact = 0.041 min−1). Further characterization of CYP3A TDI showed inhibition to be irreversible, and radiolabel experiments confirmed mechanism-based inactivation via NADPH-dependent covalent binding to microsomal protein. Overall, compelling enzymology data such as these implicated M2 as a likely factor in AMG 487 nonlinear pharmacokinetics. However, the question remained as to how a low-level metabolite (37 and 12 nM Cmax on days 1 and 7, respectively) could potentially impart such dramatic effects as those observed clinically. One possible explanation is that circulating levels of M2 underrepresent those actually present in the liver. Another plausible explanation is that M2 requires further metabolism to form a reactive species or other metabolite capable of CYP3A TDI. Although it is already known that sequential metabolism is a feature of AMG 487 clearance, the metabolic fate of M2 beyond its biotransformation to M3 requires further elucidation to better understand the role of M2 as an inhibitory metabolite.
Metabolites pose a unique challenge to preclinical drug discovery scientists. They can be detected and characterized in vitro and in vivo in preclinical species, but often it is not possible to perform definitive identification without deploying additional resources, including synthesis of authentic standards. Nonetheless, the role of metabolites as CYP3A4 inhibitors and potential perpetrators of drug-drug interactions has been established by studies of itraconazole (Isoherranen et al., 2004; Templeton et al., 2008, 2010) and diltiazem (Höglund and Nilsson, 1989; Sutton et al., 1997; Zhao et al., 2007; Hanson et al., 2010). A similar theory that AMG 487 nonlinearity is related to an inhibitory metabolite has been proposed (Tonn et al., 2009); however, the identity of that metabolite has yet to be elucidated fully. To test the hypothesis that a product of M2 metabolism plays a role in CYP3A4 TDI, M2 biotransformation has been characterized with the goal of identifying an inhibitory metabolite or reactive intermediate primarily responsible for enzyme inhibition. Results from GSH trapping experiments conducted in the absence and presence of [18O]H2O, NMR-based structure elucidation attempts, and LC-MS/MS analysis of an adducted CYP3A4 peptide are presented. In vitro experimental conditions in which TDI originating from AMG 487 preincubation is confirmed have also been identified, suggesting that conventional 30-min preincubation approaches are not always adequate to rule out TDI.
Materials and Methods
Chemicals and Biological Reagents.
AMG 487 and its M2 metabolite were synthesized by the Chemistry Research and Discovery group at Amgen (South San Francisco, CA). [3H]M2 (site-specifically labeled) was prepared by Moravek Biochemicals (Brea, CA) at a specific activity of 23.4 Ci/mmol and radiochemical purity of >99%. HLM used in P450 activity loss TDI assays were purchased from CellzDirect (Austin, TX); BD UltraPool HLM were used in IC50 shift TDI assays (BD Biosciences, San Jose, CA). CYP3A4 Supersomes used in metabolism studies were from BD Biosciences. [18O]H2O, normalized 95 atom %, was from Isotec (Sigma-Aldrich, St. Louis, MO). Sources of reduced NADPH were Enzo Life Sciences, Inc. (Farmingdale, NY) and Sigma-Aldrich. Diltiazem, testosterone, GSH, MgCl2, and potassium phosphate buffer were purchased from Sigma-Aldrich. Midazolam, 1′-hydroxymidazolam-[13C3], and 6β-hydroxytestosterone-[D7] were purchased from BD Biosciences. All other chemicals and liquid chromatography solvents were acquired from commercial sources and were of the highest grade available.
CYP3A TDI Evaluation by Activity Loss Assay.
The assay was performed with a two-stage procedure in a 96-well format. Each time point was sampled in duplicate, and kinetic parameters were determined using data from three independent experiments. Inactivation in preincubation mixtures was conducted in potassium phosphate buffer (100 mM, pH 7.4) containing HLM (1 mg/ml) and either AMG 487 (0.3–75 μM) or M2 (0.1–30 μM). After a 5-min equilibration at 37°C, reactions were initiated by addition of NADPH (1 mM) in a final incubation volume of 0.3 ml. Reactions proceeded for 0, 10, 20, 30, or 60 min for AMG 487 and for 0, 2, 4, 6, or 10 min for M2, at which time aliquots (n = 2 per time point) were transferred to new incubations for assessment of the remaining CYP3A4 activity. Incubations (prewarmed to 37°C) contained NADPH (1 mM) and either midazolam (10 μM) or testosterone (200 μM) in potassium phosphate buffer (100 mM, pH 7.4). The final volume was 0.3 ml. Reactions were allowed to proceed for 3 or 5 min (for midazolam or testosterone substrates, respectively) and were terminated by addition of an equal volume of ACN containing tolbutamide internal standard. Quenched mixtures were vortex-mixed and centrifuged, and resulting supernatants were diluted with water (1:1) before LC-MS/MS analysis. An Agilent 1100 series HPLC instrument (Agilent Technologies, Santa Clara, CA) fitted with an HTC PAL autosampler (LEAP Technologies, Carrboro, NC) was used to perform chromatography on an Agilent Eclipse Plus C18 column (5 μm, 2.1 × 50 mm). The mobile phase consisted of 0.1% formic acid in water (A) and ACN containing 0.1% formic acid (B) at a flow rate of 0.4 ml/min. A linear gradient from 5 to 95% B was applied over 3.3 min. Quantification of 1′-hydroxymidazolam and 6β-hydroxytestosterone was conducted using an AB Sciex 4000 QTRAP mass spectrometer with a TurboIonSpray source (Applied Biosystems, Foster City, CA). Source voltages and collision energies were optimized for detection of 6β-hydroxytestosterone (m/z 305.3 → 269.3), 1′-hydroxymidazolam (m/z 342.3 → 324.3), and tolbutamide internal standard (m/z 271.1 → 91.1. Data were acquired in Analyst (version 1.4.2).
Kinetic parameters were determined using GraphPad Prism (GraphPad Software Inc., San Diego, CA). The natural log of percentage of remaining CYP3A activity versus preincubation time was plotted for each inhibitor concentration, and initial inactivation rate constants (kobs) were calculated from the slopes of the log-linear portion of each plot. Inactivation parameters were estimated by nonlinear regression using the following relationship:
 where KI is the inhibitor concentration at which the rate of enzyme inactivation is half the maximal rate, kinact is the rate constant for the maximal inactivation rate, and Io is the initial inhibitor concentration (Waley, 1985; Silverman, 1995).
CYP3A TDI Evaluation by IC50 Shift Assay.
CYP3A TDI IC50 shifts were determined for AMG 487, M2, and diltiazem (a sequential metabolism TDI control). Assays were conducted in potassium phosphate buffer (100 mM, pH 7.4) containing an NADPH-regenerating system (composed of 1.3 mM NADP+, 3.3 mM glucose 6-phosphate, and 0.4 U/ml glucose-6-phosphate dehydrogenase), magnesium chloride (3.3 mM), DMSO (≤0.2%), and BD UltraPool HLM. Incubations were prepared in a volume of 400 μl at 37°C in 96-well plates on a Mécour thermal block heated with a circulating water bath. Assays were initiated by introduction of microsomal protein. Shift assays were conducted with two methods of introducing substrate into the reaction: a “dilution” method or “substrate addition” method. In the dilution method, a preincubation mixture containing microsomal protein (0.2 mg/ml for the midazolam assay or 0.5 mg/ml for the testosterone assay) and inhibitor was incubated for 30 or 90 min, after which an aliquot (40 μl) was transferred to a secondary reaction mixture containing probe substrate and an NADPH-regenerating system, resulting in a 10-fold dilution of the inhibitor and microsomal protein. In the substrate addition method, inhibitor and microsomal protein (0.02 mg/ml for the midazolam assay or 0.05 mg/ml for the testosterone assay) were preincubated for 30 or 90 min. After the preincubation period, an NADPH-regenerating system (or, if already present, water) in a 24-μl volume was added, followed quickly by probe substrate (0.5 μl dissolved in acetonitrile). Probe substrate concentrations were 3 μM (midazolam) or 50 μM (testosterone), and activity incubations were performed for 5 or 10 min, respectively. Preincubations for both methods were run with and without an NADPH-regenerating system, except as noted below for M2. Assays were stopped by addition of 100 μl of stable isotope-labeled internal standard (1′-hydroxymidazolam-[13C3] or 6β-hydroxytestosterone-[D7] for testosterone) prepared in 0.1% formic acid in ACN. Samples were subsequently centrifuged (4000g) for 20 min at 20°C to pellet the protein. Supernatant was removed and stored at −20°C before LC-MS/MS analysis (Perloff et al., 2009). The IC50 “shift” was calculated as the ratio of IC50 values in the absence and presence of NADPH.
AMG 487 preincubation concentrations in the dilution method ranged from 0 to 300 μM in decreasing half-log increments. Secondary incubation AMG 487 concentrations after dilution (10×) ranged from 0 to 30 μM. The substrate addition method was performed at AMG 487 concentrations of 0 to 30 μM, similar to the secondary dilution incubations. Dilution method diltiazem preincubation concentrations ranged from 0 to 1000 μM in the “+NADPH” incubations and from 0 to 3000 μM in the “−NADPH” incubations, decreasing in half-log increments. Secondary incubations contained 0 to 100 and 0 to 300 μM concentrations, respectively. For the substrate addition method, diltiazem was assayed at the same concentrations as secondary incubations in the dilution experiment. For M2, a direct IC50 was performed (same conditions as secondary incubation, but without preincubation) as the comparator to the shifted IC50 instead of −NADPH. M2 concentrations ranged from 0 to 100 μM, decreasing in half-log increments. A shifted IC50 was performed using only the dilution method, with M2 concentrations of 0 to 10 μM in the secondary incubations.
Partition Ratio Determination for CYP3A4 Inactivation by M2.
A partition ratio, the moles of metabolite(s) formed per mole of enzyme inactivated, was estimated in a three-part titration experiment (Silverman, 1995) that included enzyme inactivation, dialysis, and activity measurement. Inactivation was conducted in potassium phosphate buffer (100 mM, pH 7.4) containing CYP3A4 Supersomes (0.2 μM) and either M2 (0–30 μM) or ketoconazole (1 μM) as control. After a 5-min equilibration at 37°C, reactions were initiated by addition of NADPH (1 mM) in a final volume of 0.6 ml. Reactions proceeded for 10 min before aliquots (0.4 ml) were transferred to 10,000-Da molecular mass cutoff Slide-A-Lyzer dialysis cassettes (Thermo Fisher Scientific, Waltham, MA). To reduce excess inhibitor before determination of remaining enzyme activity, samples were dialyzed against potassium phosphate buffer (100 mM, 2 liters) for 4 h at 4°C. After dialysis, aliquots (30 μl; n = 3 per inhibitor concentration) were transferred to new incubations for assessment of the remaining CYP3A4 activity using either midazolam (10 μM) or testosterone (200 μM), as described previously herein.
The percentage of remaining CYP3A4 activity at each substrate concentration was plotted against the molar ratio of M2 to CYP3A4 enzyme using GraphPad Prism. The intercept between the regression line fit at molar ratios less than 50 and the x-axis yielded the turnover number. The partition ratio was calculated by subtracting a value of 1 from the turnover number.
Metabolism of [3H]M2 by Recombinant CYP3A4.
Metabolic incubations were prepared containing CYP3A4 Supersomes (0.2–0.6 μM), MgCl2 (0.33 mM), GSH, or potassium cyanide (5 mM) and M2 (10 μM) in potassium phosphate buffer (100 mM, pH 7.4). Specifically labeled [3H]M2 (pyridine ring) was isotopically diluted to 61 mCi/mmol before use, such that 10 μM M2 concentrations afforded 0.5 μCi/incubation (0.5 ml final volume). After equilibration at 37°C for 5 min, reactions were initiated by addition of NADPH (1.3 mM) and allowed to proceed at 37°C for 45 min. Reactions were terminated by addition of ACN (250 μl) containing 0.2% formic acid, vortex-mixed, and centrifuged to remove protein. Samples were analyzed by LC-MS/MS using an LC-20AD HPLC system (Shimadzu, Columbia, MD) fitted with an HTC PAL autosampler. Chromatographic resolution of M2 metabolites was achieved on a Gemini C6 phenyl column (3μm, 3 × 150 mm; Phenomenex, Torrance, CA) using a mobile phase consisting of 0.1% formic acid (A) and 0.1% formic acid in ACN (B) at a flow rate of 0.5 ml/min. A shallow linear gradient from 5 to 95% B was applied over 60 min. MS analyses were performed using either an AB Sciex 4000 QTRAP mass spectrometer with a TurboIonSpray source or a Thermo Scientific hybrid LTQ Orbitrap mass spectrometer (Thermo Fisher Scientific, Bremen, Germany) with an API2 source. All high-resolution mass spectra were acquired using 30,000 resolving power. Exact mass measurement was accomplished using external calibration. Electrospray ionization with positive ion detection was used; the source temperature was set to 250°C, and the ion spray voltage was held at 4.5 kV. For analysis of [3H]M2 samples, column eluates were split approximately 80:20, with the majority of flow directed to a model 4 β-RAM detector acquiring data in Laura Lite (version 3.4.1.10; LabLogic Systems Inc., Brandon, FL).
NMR Analysis of GSH Conjugates Resulting from Metabolism of M2.
To obtain sufficient quantities of M5 GSH conjugates for NMR analysis, M2 was incubated with CYP3A4 Supersomes. Feasibility studies showed that lower volume incubations afforded greater conversion to M5; thus, scale-up was accomplished via pooling 75 incubations of 1 ml each. Incubations were performed similarly to metabolism studies described previously, with the exception of CYP3A4 (0.25 μM), M2 (5 μM), and NADPH (2 mM) concentrations. After 40 min of incubation, an additional aliquot of CYP3A4 Supersomes (20% of initial) was added, and reactions were finally terminated at 1 h by addition of ACN (3 ml) containing 0.5% acetic acid. Samples were vortex-mixed and centrifuged for 10 min to remove protein. Supernatants were then transferred to fresh tubes and dried under N2 at 37°C. During the drying process, the supernatants were pooled into a single sample.
Dried supernatants were reconstituted in approximately 40 ml of ammonium formate buffer (10 mM, pH 5) in 10% ACN-90% H2O and subjected to chromatography on a FractionLynx semipreparative scale LC system coupled to a Quattro micro triple-quadrupole MS detector (Waters, Milford, MA). The mobile phase consisted of ammonium formate (10 mM, pH 5) in 5% ACN-95% H2O (A) and in 95% ACN-5% H2O (B). A Waters X-Bridge C18 column (5 μm, 10 × 150 mm) was used at a flow rate of 10 ml/min under the following gradient conditions: 0 to 3 min, 99% A; 3 to 22 min, 99 to 55% A; 22 to 22.1 min, 55 to 5% A; 22.1 to 26 min, 5% A; 26 to 27 min, 5 to 99% A; and 27 to 30 min, 99% A. Fractions were collected on the basis of selective ion monitoring of m/z 897 (M5 GSH adducts) and m/z 576 (M2) in positive ion mode, pooled, and dried on a vacuum centrifuge (SpeedVac; Thermo Fisher Scientific). M2 eluted at 21.5 min, and M5 GSH conjugates, labeled GSH-A and GSH-B, eluted at 15.5 and 16.0 min, respectively.
M2, GSH-A, and GSH-B were each dissolved in CD3OD (160 μl) and transferred to 3-mm tubes. NMR data were acquired on a 600 MHz spectrometer equipped with a 5-mm cryoprobe (Bruker Instruments, Billerica, MA). Structural assignment was performed by analyzing one-dimensional 1H NMR, two-dimensional 1H/1H total correlation spectroscopy, two-dimensional rotating frame nuclear Overhauser enhancement spectroscopy, and two-dimensional 1H/13C heteronuclear single quantum correlation and heteronuclear multiple-bond correlation spectroscopy data sets.
18O Incorporation into M2 Metabolites from [18O]H2O.
CYP3A4 Supersome incubations were prepared using either a standard procedure, described previously herein, or a modified procedure to include 18O-enriched water. In the modified procedure, the required volumes of potassium phosphate buffer (100 mM, pH 7.4) and MgCl2 for a 1-ml incubation were placed in a glass test tube (n = 2) and dried under an N2 stream. Residues were reconstituted in an identical volume of [18O]H2O (normalized 95 atom %) before addition of GSH and M2 (prepared in [18O]H2O and DMSO, respectively). CYP3A4 Supersome concentrations (0.1 μM) were reduced relative to those in previous studies to minimize levels of unlabeled water. Final M2 and NADPH concentrations were 20 μM and 2 mM, respectively. With correction for unlabeled water introduced from the enzyme aliquot, the final percentage of [18O]H2O present in the incubation mixture was estimated to be 86%. After 1 h, reactions were terminated by the addition of ACN (3 ml) containing 0.5% acetic acid. Sample workup before LC-MS/MS analysis was as described previously. Chromatographic separation of incubation contents was performed with an Agilent 1200 HPLC system (Agilent Technologies), an HTS PAL autosampler (Leap Technologies), and an Agilent Polaris C18-A column (3 μm, 2 × 100 mm). The mobile phase consisted of 0.1% formic acid in water (A) and ACN containing 0.1% formic acid (B). Initial conditions were 5% B for 3 min, after which a linear gradient increased B to 30% over 37 min followed by an additional increase to 95% B over 10 min. Full-scan mass data for assessment of 18O incorporation into M2 metabolites were acquired using a Thermo Scientific hybrid LTQ Orbitrap Velos mass spectrometer (Thermo Fisher Scientific). Mass spectra were acquired in the high-resolution mode under conditions described previously, with the exception of source temperature (300°C) and ion spray voltage (5 kV).
Isotope profile simulations were performed using MS-Isotope in ProteinProspector (version 5.9.4; University of California, San Francisco, CA), to help quantify 18O incorporation into M2 metabolites (http://prospector.ucsf.edu/prospector/mshome.htm). Simulations were performed at 30,000 resolution, similar to LTQ Orbitrap experiments, with Gaussian profile output in tab delimited text format. Graphical representations of simulated data were produced in SigmaPlot (version 11.0; Systat Software, San Jose, CA) and are presented in units of percent relative abundance.
CYP3A4 Protein Labeling and Peptide Adduct Characterization.
CYP3A4 Supersomes (0.4 μM) and M2 (50 μM) were incubated in 0.5 ml of potassium phosphate buffer (100 mM, pH 7.4) for 30 min at 37°C in the presence or absence of NADPH. Incubations were subsequently placed on ice and concentrated to a 15-μl volume using a SpeedVac. Aliquots (800 μl) of ammonium bicarbonate buffer (50 mM, pH 8.1) and methanol (100 μl) were added to each incubation sample. Mixtures were then incubated with proteinase K (Roche Diagnostics, Indianapolis, IN) in a 1:50 (w/w) ratio for 4 h at room temperature. After proteolysis, the pH was adjusted to 5 by addition of 0.1% TFA, followed by addition of ACN (5% final volume). A Vydac silica C18 macrospin column (The Nest Group, Southborough, MA) was equilibrated with 80% ACN containing 0.1% TFA by centrifugation in a microcentrifuge for 2 min at 2000 rpm. Peptide mixtures were then added, and the column was washed three times with 5% ACN containing 0.1% TFA. Peptides were subsequently eluted by washing three times with 80% ACN containing 0.1% TFA. The pooled eluate was concentrated as before to a volume of 20 μl. Peptides resulting from digestion were analyzed by LC-MS/MS using an Accela 1250 HPLC system coupled to an HTS PAL autosampler, which was interfaced with an LTQ Orbitrap Velos mass spectrometer. Samples were injected onto a Jupiter C18 column (3 μm, 4.6 × 150 mm; Phenomenex) at a flow rate of 0.5 ml/min, with a portion of the column eluate (20%) diverted to the mass spectrometer. The mobile phase consisted of 0.05% formic acid (A) and 0.05% formic acid in ACN (B). Initial conditions were 98% A/2% B, and peptides were eluted using the following gradient: 2% B for 2 min, 2 to 95% B over 35 min, and 95% B for 5 min. Ions were detected in positive mode; precursor masses were acquired in the FT Orbitrap, and the top five most intense multiply charged ions in each MS spectrum were selected for fragmentation in the linear ion trap. CID fragment ion spectra were produced using 35% collision energy and a 1.0-Da isolation window. The resulting data were searched via SEQUEST embedded in Proteome Discoverer 1.2 (Thermo Fisher Scientific). A putative peptide adduct was sequenced using the MS2 data set, followed by additional MS3 analysis to identify the nature of the adduct.
Results
CYP3A TDI Evaluation by Activity Loss Assay.
Despite adjustments in enzyme levels and increases in preincubation times (60–90 min), a robust and reproducible CYP3A4 TDI signal suitable for kinetic characterization was not observed for AMG 487 with midazolam or testosterone probe substrates (data not shown). Within the expected range of assay variability, it could not be concluded definitively whether AMG 487 was itself a time-dependent P450 inhibitor or whether it produced a metabolite capable of TDI. As expected, however, application of standard activity loss conditions for assessment of M2 clearly revealed CYP3A4 TDI with both midazolam and testosterone probes. Semilog plots of remaining activity versus preincubation time showed linear activity loss through 10 min, so determination of kobs did not require the full 30-min preincubation (data not shown). Inactivation kinetics derived by nonlinear regression from kobs and M2 concentration data were similar for midazolam and testosterone (Supplemental Fig. S1). KI and kinact values were 1.9 μM and 0.088 min−1 for midazolam and 1.9 μM and 0.099 min−1 for testosterone. With correction for nonspecific M2 binding to microsomal protein (fu = 0.39) as reported previously (Tonn et al., 2009), unbound KI values were 0.73 and 0.74 μM for midazolam and testosterone, respectively, and were similar to previous measurements (Tonn et al., 2009). With use of unbound KI, inhibitor potency as determined by kinact/KI was 0.12 to 0.13 ml · min−1 · nmol−1.
CYP3A TDI Evaluation by IC50 Shift Assay.
IC50 shifts were generated for AMG 487, M2, and diltiazem (control) under conditions that varied by length of preincubation, method of probe substrate introduction, and probe substrate. The standard preincubation time of 30 min for AMG 487 revealed a borderline positive signal with IC50 shifts of 1.5 and 1.4 for substrate addition and dilution approaches, respectively, using midazolam as a probe substrate (Table 1). Of interest, the testosterone probe substrate under the same conditions yielded a negative result (shifts ≤1.1). Increasing the preincubation time to 90 min provided the most robust positive TDI signal yet for AMG 487 when midazolam was the probe, for which IC50 shifts of 3.2 and 2.9 were observed by substrate addition and dilution methods, respectively. It did not appear that the method of probe substrate addition significantly affected TDI detection for AMG 487, but rather the increase in preincubation time was the most significant factor. Of note, the testosterone probe experiment did not indicate TDI risk for AMG 487 despite a longer preincubation (IC50 shift of 1.1–1.4). Although not expected to meaningfully influence the results, the IC50 shift experiments were conducted using an NADPH-regenerating system, whereas the activity loss experiments used NADPH. Compared with the activity loss results, the IC50 shift method, in general, appeared to be more sensitive for detection of TDI when AMG 487 served as the inhibitor.
AMG 487-, M2-, and diltiazem-mediated microsomal CYP3A IC50 shift data
Values were determined in HLM by substrate addition or dilution methods, using midazolam or testosterone as reporter substrate.
Assessment of diltiazem, known to elicit CYP3A4 TDI by means of sequential metabolism (Hanson et al., 2010), resulted in readily detectable IC50 shifts under all conditions used for AMG 487 (Table 1). The magnitude of shift increased with incubation time, as anticipated on the basis of AMG 487 results, and shifts measured by the dilution approach appeared to be greater in magnitude than those by the substrate addition approach. IC50 shifts were on the order of 1.7 to 2.2 for 30 min of preincubation by substrate addition and were on the order of 8.5 to 23 for 30 min of preincubation by dilution. After preincubation time was increased to 90 min, IC50 shifts were on the order of 7.9 to 23 by substrate addition and were on the order of 1200 to 2300 by the dilution method. In contrast to AMG 487, testosterone was the more sensitive substrate probe compared with midazolam and consistently gave rise to shifts of greater magnitude for diltiazem.
An IC50 shift for M2 was readily observed, as expected, requiring only the standard 30-min preincubation to elicit shifts of 24 and 31 for midazolam and testosterone, respectively (Table 1). The substrate addition IC50 shift approach was not explored for M2.
Partition Ratio Determination for CYP3A4 Inactivation by M2.
A titration experiment was performed as described previously (Silverman, 1995) using recombinant CYP3A4 enzyme. Because M2 was known to demonstrate competitive inhibition properties in addition to TDI (Tonn et al., 2009), dialysis was performed between the preincubation step and the remaining activity determination with either midazolam or testosterone probe substrate. The dialysis part of the experiment was particularly important at higher M2/CYP3A4 ratios at which residual M2 could lead to underestimation of remaining functional enzyme by virtue of competitive inhibition, which could artifactually influence the partition ratio estimate. A 4-h dialysis at 4°C was used for M2 samples because improvement in recovery (determined by enzyme activity) was not observed when 4- and 24-h dialysis results for ketoconazole (competitive control) were compared: both showed between 70 and 80% recovery relative to that with DMSO (data not shown). Another reason to limit dialysis duration was the previous data demonstrating additional M2-dependent microsomal CYP3A activity loss over a 24-h dialysis interval (Tonn et al., 2009). The partition ratio for M2 determined in the present study was 36 for both midazolam and testosterone probe substrates (Supplemental Fig. S2), suggesting inefficient CYP3A4 inactivation.
Metabolism of [3H]M2 by Recombinant CYP3A4.
The TIC mass chromatogram (derived from a series of manually entered, M2-specific ion transitions associated with common biotransformations) revealed metabolism of M2 to more than eight products (Fig. 1A). As expected, M3 was present (28.0 min) and confirmed to be an N-oxide (m/z 592) by TiCl3 reduction (data not shown). Metabolite peaks in the retention time range of 25 to 27 min (preceding M3) had mass characteristics (m/z 608) and MS2 spectra suggesting that they were further oxidation products of M3, initial confirmation of a more complex sequential metabolism process than previously recognized. Additional metabolites of M2 included hydroxylated M4 isomers (m/z 592; 21.0 and 21.8 min), arising via oxidation of the phenol ring as supported by MS2 data (not shown) and NMR spectra. GSH conjugates were also observed (m/z 897; 17.4, 18.0, and 18.5 min). Designated M5, these appeared to be isomers on the basis of identical MS2 spectra (Fig. 2). In the absence of GSH, M5 isomers were not observed, and the rest of the TIC chromatogram was qualitatively unchanged (data not shown). The accompanying radiochromatogram (Fig. 1B) indicated that the major components of the incubation mixture had been detected and characterized by the mass spectrometer. Some disparity between approximate relative abundance from TIC data and true relative abundance from radio data was noted, particularly for the M5 GSH adduct isomers whose contribution to overall metabolism was underestimated in the TIC. Overall, the lack of mass balance observed previously in human liver microsome experiments (Tonn et al., 2009) between the quantity of M2 consumed (∼90%) and the amount of M3 formed (only ∼10%) can probably be explained by M2 conversion to M4 that was not quantified experimentally.

Metabolism of [3H]M2 by recombinant CYP3A4 in the presence of GSH. A, TIC mass chromatogram from selected transitions demonstrating formation of M4 and M5 isomers (previously unidentified). B, corresponding 3H radiochromatogram showing the full metabolite profile with accurate relative abundance of [3H]M2 and its metabolites.

The MS2 spectrum of M5 (m/z 897) and fragmentation diagram supporting the proposed structure. MS2 data acquired for each M5 isomer were similar.
The presence of M5 GSH adduct(s) provided clear evidence of bioactivation. Three chromatographically resolved M5 isomers were detected, and each possessed a molecular ion at m/z 897, suggesting addition of GSH to M4. The MS2 spectrum of each M5 isomer was indistinguishable, showcasing a diagnostic fragment ion at m/z 768 as the base peak (Fig. 2). This ion was produced via neutral loss (129 Da) of the pyroglutamic acid moiety present in the GSH peptide (Baillie and Davis, 1993). Fragments at m/z 624, 422, and 288 suggested cleavage of multiple bonds, including a putative Ar-S−CH2 bond indicative of aromatic GSH substitution (Baillie and Davis, 1993). Ions of m/z 566 and 432 demonstrated lability of both the AMG 487/M2 amide bond and the C−C bond separating the 8-azaquinazolinone core from the trifluoromethoxyphenyl and pyridyl portions of the molecule. Loss of water was evident by m/z 879, 750, and 606 ions. Each diagnostic fragment ion detected in the M5 MS2 spectrum (Fig. 2) acquired at unit mass resolution was also characterized at high resolution by the LTQ Orbitrap analysis (Table 2), in which experimentally derived elemental compositions of the molecular ions ([M + 2H]2+ and [M + H]+) and fragment ions were consistent with the proposed structure. Absolute differences between observed and theoretical ion masses (Δ) ranged from 0.0 to 2.8 ppm. Overall, these data suggested that M5 was directly related to M4 (as opposed to M2) because it contained an additional oxygen atom. Mass spectrometry analysis helped exclude the trifluoromethoxyphenyl and pyridyl rings as sites of metabolism leading to M5; therefore, the site of addition of GSH and oxygen was proposed to be the phenol ring.
High-resolution full mass and MS2 fragment data acquired from a major M5 GSH conjugate
NMR Analysis of GSH Conjugates Resulting from Metabolism of M2.
Confirmation of the phenol ring as the site of oxygen atom incorporation and GSH conjugation was the primary goal of NMR analysis of M5 isolates. Figure 3 displays the aromatic region expansions of 1H NMR spectra from M2, GSH-A, and GSH-B (the two major M5 positional isomers resolved and isolated). Each spectrum consisted of a mixture of conformational isomers arising from the restricted rotation around the tertiary amide bond. For both GSH conjugates, proton signals H1, H2, and H3 in the 8-azaquinazolinone ring were unchanged, and the site of GSH addition was narrowed to the phenol ring. For GSH-A, the proton resonances for the major rotational isomer were at 6.93 (d, 2.5 Hz; δC 115.1 ppm) and 6.48 ppm (d, 2.5 Hz; δC 114.9 ppm), indicating meta-coupled protons in the phenol ring. For GSH-B, the proton resonances for the major rotational isomer were at 6.84 (d, 8.1 Hz; δC 107.5 ppm) and 6.26 ppm (d, 8.1 Hz; δC 118.4 ppm), indicating ortho-coupled protons in the phenol ring. Based on the NMR data, two positional isomers can be drawn for each isolated adduct as shown in Fig. 3; however, the exact nature of substitution could not be inferred.

1H NMR spectra for M2 (A), M5 GSH-A (B), and M5 GSH-B (C). In the three spectra, chemical shifts associated with protons at positions 1, 2, and 3 remain unchanged, confirming that M5 positional isomers are formed via oxidation and GSH conjugation of the phenol ring. Data for M5 GSH-A showed shifted resonances for protons 6/7 and 9/10, with coupling constants (2.5 Hz) indicating a meta relationship. Data for M5 GSH-B showed shifted resonances for protons 6 and 7, with coupling constants (8.1 Hz) consistent with an ortho relationship. Possible structures are shown for GSH A and GSH B.
18O Incorporation into M2 Metabolites from [18O]H2O.
With the site of oxidation and GSH conjugation identified by MS and confirmed by NMR, the mechanism of conjugate formation was subsequently probed using 18O-enriched water. Incubation of M2 in reaction media containing 86% [18O]H2O resulted in low-level 18O incorporation into M5 and M4, and no detectable incorporation into M3 (Fig. 4). In the case of M5, the (A + 2)/A molecular ion ratio (m/z 899/897) increased from 0.13 to 0.43 in the presence of [18O]H2O, an increase in relative abundance of 30%. Simulations were performed using MS-Isotope to give a more precise quantitative estimate of 18O incorporation, because the isotope profile of M5 was complex, given its relatively high molecular weight and its diverse elemental composition. As a form of validation, the simulator accurately predicted the M5 isotope profile in the absence of 18O incorporation (Supplemental Fig. S3A) compared with experimental data (Fig. 4). On the basis of iterative simulations varying the degree of 18O incorporation, the closest agreement between simulation (Supplemental Fig. S3B) and experiment (Fig. 4) in the presence of [18O]H2O was 20% 18O incorporation. For simulation purposes, incorporation was assumed to occur at a single position (e.g., site of metabolism). By applying a correction for incomplete enrichment of [18O]H2O in the reaction media (86%), it was estimated that 23% of oxygen incorporated into M5 during its formation was derived from water in the aqueous environment. The remaining 77% was from O2 and assumed to be derived directly from P450 oxidation. To rule out isotope exchange between the aqueous media and peptide bond or carboxylate oxygen atoms present in GSH, MS2 data were collected from the m/z 899 ion derived from [18O]H2O incubations. Results showed 18O atom incorporation tracked only with fragment ions containing the phenol moiety (data not shown).

Full-scan LTQ-Orbitrap data acquired for M5, M4, and M3 in the absence (top row) and presence (bottom row) of [18O]H2O (86% by volume). Some incorporation of oxygen from water is observed for M5 and M4 by virtue of small increases in m/z 899 and 594, respectively, in the presence of [18O]H2O. No change is detected in m/z 594 for M3 (N-oxide metabolite).
A similar analysis was performed for M4, for which the (A + 2)/A molecular ion ratio (m/z 594/592) increased from 0.06 to 0.19 in the presence of [18O]H2O, an increase in relative abundance of 13%. On the basis of iterative simulations in MS-Isotope varying the degree of 18O incorporation, the best agreement between simulation (not shown) and experiment (Fig. 4) in the presence of [18O]H2O was achieved with 11% 18O incorporation. By applying the same correction for incomplete enrichment of [18O]H2O, it was estimated that 13% of oxygen incorporated into M4 during its formation was derived from water in the incubation. Therefore, like M5, the clear majority of oxygen incorporated via metabolism was derived from O2 via P450-mediated oxidation. However, the minor extent of oxygen derived from water meant that a broader range of mechanistic possibilities should be considered to account for minority pathways.
Isotope data for M3 (N-oxide metabolite) were different from those for M4 and M5 in that 18O incorporation was not detected (Fig. 4). Molecular ion isotope ratios for (A + 2)/A (m/z 594/592) were similar in the presence of [18O]H2O (0.07) and in the absence of [18O]H2O (0.06). M3, therefore, served as a convenient negative control because P450-mediated N-oxide formation would not be expected to lead to 18O incorporation from water (Guengerich, 2001).
CYP3A4 Protein Labeling and Peptide Adduct Characterization.
Proteinase K digestion of CYP3A4 after incubation with M2 and NADPH (n = 3) yielded peptides covering 78 to 92% of the protein sequence, including a putative [M + 3H]3+ peptide adduct at m/z 522.9 Da corresponding to [M + H]+ = 1566.6 Da. MS2 experiments with m/z 522.9 serving as the precursor gave rise to singly charged b and y ions (Fig. 5) highlighted in red and blue, respectively. A prominent doubly charged y7 ion was also observed. The y ion series (m/z 304.2, 401.2, 548.3, 647.4, and 726.8) provided sufficient sequence coverage to identify the modified peptide as 237NICVFPRE244, located between the CYP3A4 G and G′ helices (SRS3) in a region forming the roof of the active site cavity (Williams et al., 2004; Yano et al., 2004). Addition of M4 to the theoretical molecular weight of the peptide was consistent with the experimentally derived molecular weight ([M + H]+ = 1566.6), differing by 23.9 ppm. The b ion series (m/z 228.1, 920.3, and 1019.3) covered the N-terminal portion of the peptide adduct, where the site of modification was determined to be the cysteine residue at position 239 (Cys239). In the case of modified peptides for which ionization efficiency is often different from that of native peptides, it is often the case that not all b and y ions are present in the tandem mass spectrum (Mann and Jensen, 2003). Subsequent MS3 analysis conducted using m/z 522.9 and 624.1 as precursors (522.9 → 624.1 → X) generated prominent product ions at m/z 288, 422, 504, and 606 (Fig. 6), many of which were identical to those associated with the GSH adduct, M5 (Fig. 2). Therefore, M4 served as the immediate precursor to a reactive electrophile that covalently bound Cys239 before exiting the enzyme active site. M5 was probably produced when reactive species evaded the protein thiol and reacted with GSH. Data were mined, looking for a peptide adduct more directly related to M2, but no such adduct was evident.
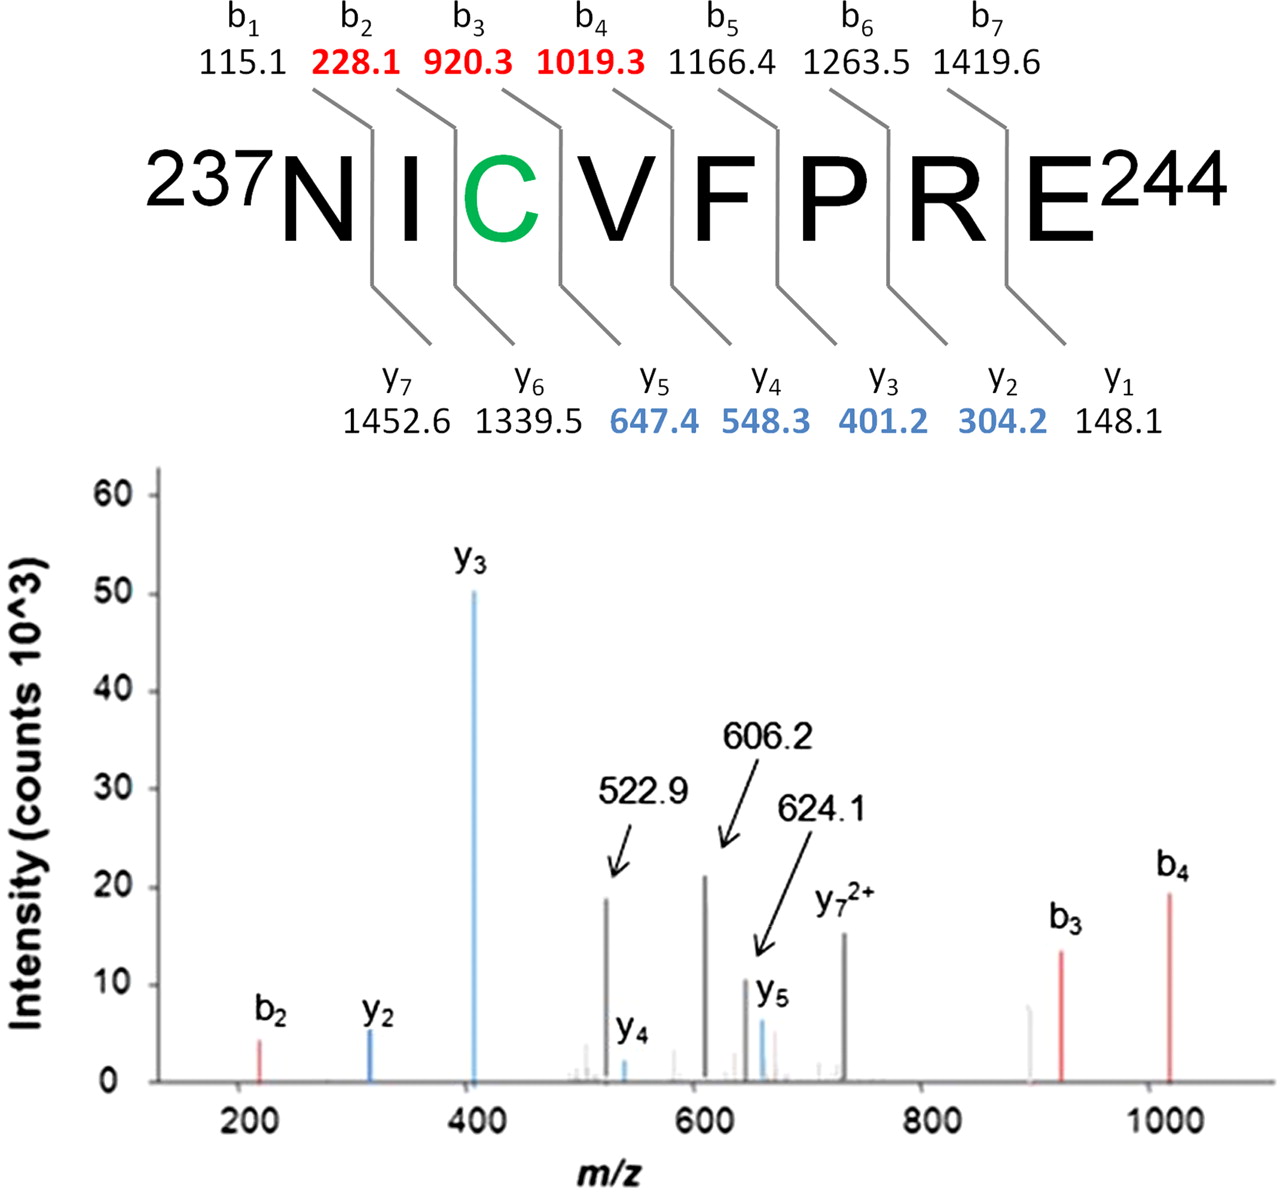
MS2 characterization of a modified CYP3A4 proteolytic peptide (522.9 → X). Theoretical b and y ions associated with an 237NIC(M4)VFPRE244 octapeptide adduct are presented; singly charged b and y ions observed in the MS2 spectrum derived from the peptide [M + 3H]3+ precursor ion (m/z 522.9) are displayed in red and blue, respectively. A doubly charged y72+ ion is also prominent. The fragment ions of m/z 624.1 and 606.2 are related to the M4 adduct (see Fig. 6).

MS3 characterization of a modified CYP3A4 proteolytic peptide (522.9 → 624.1 → X). CID of the peptide adduct [M + 3H]3+ ion (m/z 522.9) gives rise to a fragment ion of m/z 624.1 (see Fig. 5), which upon isolation and further CID generates fragment ions of m/z 288, 422, and 606 (also observed in the MS2 spectrum of M5; see Fig. 2). MS3 analysis confirms that M4 is the metabolite species bound covalently to the peptide.
Discussion
The investigations detailed here serve to better understand sequential metabolism of AMG 487 through a full characterization of M2 bioactivation and also to address the question of how P450 TDI attributable to metabolites can be understood earlier in the drug discovery process. Activity loss assays incorporating a 30-min preincubation step are a common in vitro method of rapidly determining TDI potential of a drug candidate (Grimm et al., 2009) and are sufficient to detect the most potent time-dependent inhibitors. In the case of AMG 487, however, this approach is not sufficient (Tonn et al., 2009). In contrast, when M2 is studied under standard screening conditions, TDI is readily evident and robust inactivation kinetics are obtained with midazolam or testosterone substrates (Supplemental Fig. S1). Consequently, to have concluded before phase 1 that AMG 487 carries TDI liability on the basis of activity loss methods, it would have been necessary to prospectively test a synthetic M2 standard.
Another approach to determine the TDI potential of a drug candidate is by IC50 shift (Berry and Zhao, 2008; Grimm et al., 2009), for which conditions can also be optimized to facilitate inhibitor characterization. For AMG 487, the often used 30-min preincubation offers a faint positive signal with midazolam as a probe substrate. Observed IC50 shifts fall in the range of 1.4 to 1.5 (Table 1), values at or below the recommended cutoff (1.5) for declaration of TDI (Grimm et al., 2009). Of interest, the testosterone probe gave an unambiguous negative result. Extending the preincubation time to 90 min generated IC50 shifts on the order of 2.9 to 3.2 for midazolam activity and signified a true positive result. One could speculate that the nature of the inhibitor and its mechanism of inhibition could result in differential degrees of TDI sensitivity for different activity probes, which may be expected for CYP3A4 given multiple substrate binding modes (Shou et al., 1994; Korzekwa et al., 1998). However, inactivation kinetics for M2 were the same for midazolam and testosterone, so this appears to be an unlikely explanation as long as M2 and AMG 487 act through a common inhibitory intermediate. IC50 shift data generated using the substrate addition approach (Ma et al., 2000) were generally comparable to those generated using the dilution method (Obach et al., 2007), suggesting no major differences in sensitivity to TDI detection. For diltiazem, dilution method IC50 shifts were higher in magnitude than those achieved via substrate addition, perhaps owing to higher inhibitor and protein concentrations in preincubation mixtures (Parkinson et al., 2011). Such results underscore the need for flexibility in screening practices and protocols in drug discovery as warranted by program or chemical series.
Partition ratios determined for M2 inactivation of recombinant CYP3A4 offer insight into difficulties associated with detecting AMG 487-mediated TDI/mechanism-based inhibition in vitro. Sufficient AMG 487 turnover is required to produce unbound M2 quantities approaching KI such that quantifiable inactivation occurs. If M2 acts efficiently (low partition ratio), the chances of observing inactivation with AMG 487 are conceivably more favorable relative to a scenario in which M2 is a less efficient inactivator (high partition ratio). The partition ratio of 36 reported here (Supplemental Fig. S2) is consistent with the hypothesis that CYP3A4 inactivation requires a high degree of turnover because the primary inhibitor may be an M2 metabolite. In comparison, the partition ratio reported for CYP3A4 inactivation by diltiazem ranged from 12 to 86 and was found to be concentration-dependent (Jones et al., 1999; Lim et al., 2005). M2 and diltiazem both exhibit relatively high partition ratios and share the requirement for sequential oxidation to produce enzyme inactivation. In contrast, raloxifene, mibefradil, and N-[2(R)-hydroxy-1(S)-indonyl]-5-[2(S)-(1,1-dimethyl ethylaminocarbonyl)-4-[(fluro[2,3-b]pyridin-5-yl)methyl]piperazin-1-yl]-4(S)-hydroxy-2-(R)-phenylmethylpentamide (L-754,394) each have far lower CYP3A4 partition ratios (∼1–4), possibly due to more direct bioactivation mechanisms (Chiba et al., 1995; Prueksaritanont et al., 1999; Lightning et al., 2000; Chen et al., 2002; Baer et al., 2007; Foti et al., 2011).
In vitro [3H]M2 metabolism experiments reveal a multistep, sequential biotransformation pathway by virtue of discovery of the M4 and M5 metabolites (Fig. 1). M4 generation via CYP3A4-mediated hydroxylation of the M2 phenol moiety forms what are probably catechol (ortho) and resorcinol (meta) isomers. CID fragmentation data (Fig. 2) support the conclusion that M5 metabolites are GSH conjugates derived from M4, with confirmation by high-resolution MS (Table 2). NMR analysis of the two major M5 isomers (GSH-A and GSH-B) shows that proton resonances in the 8-azaquinazolinone ring system are unchanged compared with that of M2, establishing the phenol ring as the site of oxidation and GSH conjugation (Fig. 3). Spectra of the GSH adducts were complex because duplicate resonances are observed for each proton because of rotational isomers in the NMR sample. Increasing sample temperature during data acquisition failed to collapse these signals into single resonances, and this complexity precluded definitive structure assignment of phenol ring substitution. However, coupling constants between the two remaining phenol ring protons present in M5 isomers allow for tentative structure proposals for GSH-A and GSH-B (Fig. 3).
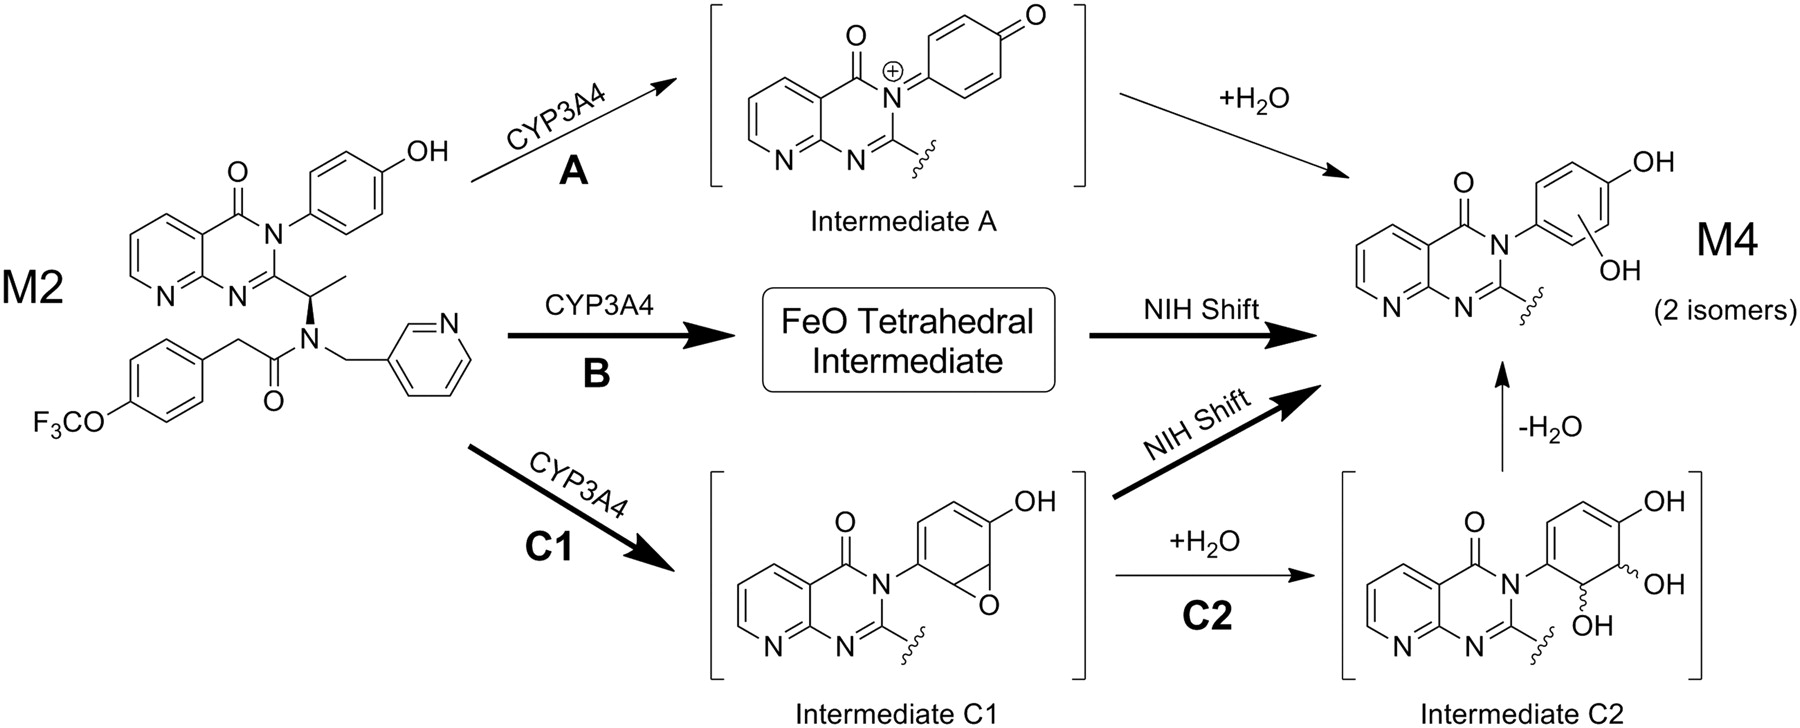
Results from 18O-incorporation experiments (Fig. 4), together with the MS and NMR results, provide sufficient data for hypotheses regarding pathways of M4 formation. Incubations containing [18O]H2O demonstrate that 11% of oxygen introduced into M4 via M2 oxidation is derived from water. As shown in Scheme 2, a minor pathway involving CYP3A4-mediated two-electron oxidation of the phenol to generate a putative quinone iminium species (intermediate A) can be envisioned along pathway A. Reaction between intermediate A and water produces M4. Although GSH adducts (m/z 881) arising from direct conjugation of intermediate A have not been observed, low levels of cyanide adduct (m/z 601) are detectable upon coincubation of unlabeled M2 and KCN in the presence of NADPH (data not shown). Another minor pathway involving water may include hydrolysis of a putative arene oxide intermediate C1 via pathway C2, in which subsequent dehydration would afford M4. Major routes in which oxygen is derived from O2 involve oxidation via the high-valent iron-oxo (FeO) species characteristic of P450 enzymes. A cationic tetrahedral intermediate (Vannelli and Hooper, 1995; Darbyshire et al., 1996) formed during aromatic ring oxidation undergoes an NIH shift rearrangement (Guroff et al., 1967; Meunier et al., 2004) to generate phenol (Scheme 2, pathway B). As an alternative, an arene oxide intermediate C1 derived from FeO may undergo an NIH shift to generate M4 directly, without proceeding through intermediate C2.

Possible routes of CYP3A4-mediated M2 biotransformation to M4. The major routes to M4 are proposed to proceed via oxidation of the phenol to form either an FeO cationic tetrahedral intermediate (pathway B) or epoxide intermediate C1 (pathway C1), where an “NIH shift” produces M4 without water involvement. Low-level 18O incorporation in the presence of [18O]H2O suggested minor routes to M4 formation involving water, potentially by pathways A and C2.
A mechanism by which M5 products are formed from M4 substrates involves additional two-electron oxidation by CYP3A4 (Scheme 3). It is proposed that this oxidation gives rise to ortho-quinone and/or para-quinone iminium intermediates generated from M4a and M4b. Similar ortho-quinone species have been proposed for bioactivation of eugenol, estradiol, hexestrol, and dopamine (Chae et al., 1998; Bolton et al., 2000; Cavalieri et al., 2002; Monks et al., 2004), whereas trazodone and nefazodone serve as examples of compounds proposed to form para-quinone iminium intermediates (Kalgutkar et al., 2005a,b). GSH addition to various nonequivalent carbons present in M4a reactive intermediates leads to formation of M5a–c. Likewise, further metabolism of M4b generates M5d–f. 1H NMR data characterizing the major isolated GSH-A adduct are consistent with proposed structures M5b or M5d. For the major isolated GSH-B adduct, either M5c or M5f is compatible. Isomers M5a and M5e represent potential minor products that cannot be excluded. GSH trapping of the proposed “quinoid” electrophiles may occur via reversible equilibrium processes in which water plays a role in generation of the final stable adducts. Water involvement in such an equilibrium process potentially explains the increase (from 11 to 23%) in oxygen derived from water during biotransformation of M4 to M5 (Fig. 4).

Sequential metabolism of M2 by CYP3A4 leads to formation of M5 GSH adducts via M4. The catechol and resorcinol isomers of M4, designated M4a and M4b, respectively, undergo further CYP3A4-mediated oxidation to form electrophilic quinone or quinone iminium intermediates. Adducts formed from M4a by means of GSH addition at positions a, b, or c give rise to isomers M5a–c. Likewise, adducts formed from M4b by means of GSH addition at positions d, e, or f give rise to isomers M5d–f. *, M5 structure consistent with NMR data for GSH-A; **, M5 structure consistent with NMR data for GSH-B (Fig. 3).
Identification and characterization of M5 confirm that M4 may be a more likely proximal CYP3A4 inactivator than M2; however, these data do not eliminate a direct role for M2 via intermediates A or C1 (Scheme 2). These minor pathways of M4 formation involving water potentially reflect a partitioning between reaction of A or C1 with active site water and enzyme. Fortunately, CYP3A4 proteolysis data can be leveraged to refute a direct role for M2 via these intermediates. Incubation of CYP3A4 with M2 and NADPH followed by proteolytic digestion generates a peptide adduct showing a modification of Cys239 based on MS2 analysis (Fig. 5). This cysteine has previously been identified as the target of raloxifene and N-(1-pyrene)-iodoacetamide covalent binding to CYP3A4 (Baer et al., 2007; Pearson et al., 2007). Subsequent MS3 characterization identifies M4 as the species covalently bound to Cys239 (Fig. 6), with no evidence of an M2 adduct to indicate it directly inactivates CYP3A4.
AMG 487 metabolism is more complex than initially recognized from in vitro screening in HLM, which may underestimate the formation of secondary and tertiary metabolites that are important in vivo. Recent reports of success predicting or modeling in vivo CYP3A4 inhibition by metabolites (Zhang et al., 2009; Quinney et al., 2010; Templeton et al., 2010) serve to provide a framework in which to further explore the potential in vivo impact of M2 and M4. After discontinuation of AMG 487, the pursuit of a mechanistic explanation for TDI liability ultimately led to replacement of the AMG 487 ethoxy substituent, which afforded an improved clinical candidate with increased potency (Chen et al., 2012).
Authorship Contributions
Participated in research design: Henne, Tran, VandenBrink, Rock, Subramanian, Stresser, S.G. Wong, and Tonn.
Conducted experiments: Henne, Tran, VandenBrink, Aidasani, Mason, Teffera, and Johnson.
Contributed new reagents or analytic tools: Johnson and Chen.
Performed data analysis: Henne, Tran, VandenBrink, Rock, Aidasani, Subramanian, Mason, Stresser, and Teffera.
Wrote or contributed to the writing of the manuscript: Henne, Tran, VandenBrink, Subramanian, Mason, Stresser, Teffera, and B.K. Wong.
Footnotes
Article, publication date, and citation information can be found at http://dmd.aspetjournals.org.
↵
 The online version of this article (available at http://dmd.aspetjournals.org) contains supplemental material.
ABBREVIATIONS:
- AMG 487
- (R)-N-(1-(3-(4-ethoxyphenyl)-4-oxo-3,4-dihydropyrido[2,3-d]pyrimidin-2-yl)ethyl)-N-(pyridin-3-ylmethyl)-2-(4-(trifluoromethoxy)phenyl)acetamide
- CXCR3
- chemokine (C-X-C motif) receptor 3
- AUC
- area under the plasma concentration-time curve
- Cmax
- maximum observed plasma concentration
- TDI
- time-dependent inhibition
- LC
- liquid chromatography
- MS/MS
- tandem mass spectrometry
- HLM
- human liver microsomes
- P450
- cytochrome P450
- ACN
- acetonitrile
- DMSO
- dimethyl sulfoxide
- MS
- mass spectrometry
- TFA
- trifluoroacetic acid
- CID
- collision-induced dissociation
- TIC
- total ion current
- L-754,394
- N-[2(R)-hydroxy-1(S)-indonyl]-5-[2(S)-(1,1-dimethyl ethylaminocarbonyl)-4-[(fluro[2,3-b]pyridin-5-yl)methyl]piperazin-1-yl]-4(S)-hydroxy-2-(R)-phenylmethylpentamide.

- Received March 14, 2012.
- Accepted April 19, 2012.
- Copyright © 2012 by The American Society for Pharmacology and Experimental Therapeutics


