


Abstract
Upon activation, brain microglial cells release proinflammatory mediators, such as nitric oxide (NO), which may play an important role in the central nervous system antibacterial, antiviral, and antitumor activities. However, excessive release of NO has been postulated to elicit immune-mediated neurodegenerative inflammatory processes and to cause brain injury. In the present study, the effect of cannabinoids on the release of NO from endotoxin/cytokine-activated rat cortical microglial cells was evaluated. A drug dose-dependent (0.1 μM–8 μM) inhibition of NO release from rat microglial cells was exerted by the cannabinoid receptor high-affinity binding enantiomer (−)-CP55940. In contrast, a minimal inhibitory effect was exerted by the lower affinity binding paired enantiomer (+)-CP56667. Pretreatment of microglial cells with the Gαi/Gαo protein inactivator pertussis toxin, cyclic AMP reconstitution with the cell-permeable analog dibutyryl-cAMP, or treatment of cells with the Gαsactivator cholera toxin, resulted in reversal of the (−)-CP55940-mediated inhibition of NO release. A similar reversal in (−)-CP55940-mediated inhibition of NO release was effected when microglial cells were pretreated with the central cannabinoid receptor (CB1) selective antagonist SR141716A. Mutagenic reverse transcription-polymerase chain reaction, Western immunoblot assay using a CB1 receptor amine terminal domain-specific antibody, and cellular colocalization of CB1 and the microglial marker Griffonia simplicifolia isolectin B4 confirmed the expression of the CB1 receptor in rat microglial cells. Collectively, these results indicate a functional linkage between the CB1 receptor and cannabinoid-mediated inhibition of NO production by rat microglial cells.
Brain microglial cells are a resident population of macrophages capable of migration, differentiation, and proliferation (Gordon et al., 1993). In the adult brain, these cells are relatively quiescent and ramified in appearance (Ling and Wong, 1993), whereas during early development and after brain injury, they become activated and ameboidal and phagocytose tissue debris (Leong and Ling, 1992), and produce cytokines such as interleukin 1β (Giulian et al., 1986), interleukin 6 (Woodroofe et al., 1991), and tumor necrosis factor α (TNF-α) (Sawada et al., 1989). Under basal conditions, the release of nitric oxide (NO) from microglial cells is negligible. However, upon stimulation with the Gram-negative bacterial endotoxin lipopolysaccharide (LPS) or cytokines such as TNF-α and γ-interferon (IFNγ), brain microglial cells release substantial amounts of the free radical NO (Chao et al., 1992).
In the immune system, NO acts as a proinflammatory mediator exerting microbiostatic, antiviral (Lowenstein et al., 1996), and antibacterial (Nathan and Hibbs, 1991) activities. In the central nervous system (CNS), NO acts as a neurotransmitter (Dawson and Snyder, 1994), controls dendritic formation and synaptic plasticity, and affects memory and learning (Chapman et al., 1992). Three distinct isozymes of nitric oxide synthase (NOS) have been identified: endothelial [NOSIII (Lamas et al., 1992)], neuronal [NOSI (Yun et al., 1996)], and macrophage [NOSII (Xie et al., 1992)]. The former two are constitutively expressed and are calcium (Ca2+)-calmodulin-dependent. The latter isozyme is inducible and Ca2+-independent, binds calmodulin tightly, and has been designated iNOS (Xie et al., 1992). Structural analysis of NOS has revealed that they share an amine terminal catalytic oxygenase domain that binds heme (iron protoporphyrin) and tetrahydrobiopterin (BH4), a carboxylic terminal catalytic reductase domain that binds flavin mononucleotide, flavin adenine dinucleotide, and reduced nicotinamide dinucleotide (β-NADPH), as well as a calmodulin-binding region that regulates electronic communication between the oxygenase and reductase domains (Nathan and Hibbs, 1991).
Activated microglial cells may play a key role in brain injury and in pathophysiological neurodegenerative disorders such as AIDS-encephalitis (Gehrmann and Kleihues, 1994). Indeed, it has been proposed that these disorders are due to the action of monokines and NO released from activated macrophages and microglial cells rather than the result of direct cytopathology induced by HIV-1 (Merril and Martinez-Maza, 1993). Reports that the psychoactive cannabinoid Δ9-tetrahydrocannabinol (THC) inhibits NO production by murine macrophages (Coffey et al., 1996) and RAW264.7 macrophage-like cells (Burnette-Curley et al., 1993; Jeon et al., 1996) suggest that cannabinoids could have a similar effect on microglial cells. Furthermore, it is recognized currently that many of the in vivo and in vitro activities attributed to cannabinoids are elicited through cannabinoid receptors (Bidaut-Russel et al., 1990; Stefano et al., 1996). Thus, the purpose of this study was to determine whether cannabinoids ablate NO production by rat microglial cells, and, if so, whether this effect is linked functionally to a cannabinoid receptor.
Materials and Methods
Reagents.
All reagents, unless otherwise indicated, were purchased from Sigma Chemical Co. (St. Louis, MO).
Cannabinoids.
The paired enantiomers (−)-CP55940 and (+)-CP56667 were obtained from Pfizer Inc. (Groton, CT) and the CB1 antagonist SR141716A was provided by Sanofi Recherche (Montpellier, France). Stock solutions (20 mg/ml) were kept at −80°C in absolute ethanol (ETOH) and were subjected immediately before use to two-step dilutions (to yield 0.05% ETOH) in warm medium containing either fatty acid-free BSA or heat-inactivated fetal bovine serum (HI-FBS; BioWhittaker Bioproducts, Walksville, MD).
Rat Microglial Cell Cultures.
Primary glial cell cultures were prepared from maximum barrier-maintained, viral antibody-free newborn Sprague-Dawley rats (Zivik-Miller Labs, Zelienople, PA) as described previously (Giulian et al., 1986) with modifications. Briefly, aseptically removed cerebral cortices (neopallium) were cleared from adhering meninges and blood vessels and washed at 4°C with Ca2+/Mg2+-free dissecting saline [33 mM glucose, 44 mM sucrose, 137 mM NaCl, 5.3 mM KCl, 0.17 mM Na2HPO4.7H2O, 0.22 mM KH2PO4, 10 mM HEPES, and 0.12 mg/liter phenol red (pH 7.3)]. Tissues were dissociated (10 min) in dissecting saline containing 0.125% porcine-derived trypsin and were dispersed mechanically by gentle pipetting and trituration with plastic and FBS-coated Pasteur pipettes. Cells were passed through a 70-μm nylon cell strainer (Falcon Labware, Lincoln Park, NJ), washed in Dulbecco’s modified essential medium (DMEM; Cellgro, Mediatech, Herndon, VA) supplemented with glucose (4.5 g/liter), 10% (v/v) HI-FBS, HEPES (50 mM), 0.1% (w/v) NaHCO3, l-glutamine (2 mM), penicillin (100 U/ml), streptomycin (100 μg/ml), 0.1 mM nonessential amino acids, and minimal essential vitamins (Gibco BRL, Gaithersburg, MD). Aliquots (1.5 × 10⁷ cells) of cerebral cortical cell suspension were seeded in T-75 flasks (Corning, Cambridge, MA), and cultures were incubated (37°C) in a 95/5% mixture of air and CO2, with 90% humidity. The culture medium was changed on days 1 and 4 after seeding to remove nonadherent cells and debris, yielding enriched mixed astrocyte-microglial cultures. For isolation of microglial cells, the flasks were agitated on days 7 to 14 of culture on a rotary shaker for 2 h at 37°C and 180 rpm. The detached cells were spun down [1000 rpm (500g), 10 min], resuspended in culture medium (5 × 10⁵/ml), and allowed to adhere to flat-bottomed well plastic plates (Corning) for 2 h at 37°C. Fresh medium was added to the flasks from which microglia were harvested and which contained adherent astrocytes to produce astrocyte-conditioned medium (Ast-CM). Ast-CM was added (50% v/v) to complete DMEM for maintenance of microglial cell cultures. The purity of microglial cell cultures was assessed by immunofluorescence using antiglial fibrillary acidic protein antibody (monoclonal mouse anti-rat GFAP; Boehringer Manheim, Indianapolis, IN) or Griffonia simplicifolia isolectin B4(GSA-I-B4) coupled to horseradish peroxidase to identify astrocytes (Shehab et al., 1990) or microglial cells (Streit and Kreutzberg, 1987), respectively. Enriched microglial cultures were assessed further for purity based on their ability to phagocytose bacteria. Escherichia coli (E. coli, 109 particles/106 cells) were added to enriched microglial cultures and cells were examined for ingested bacteria following a 1-h incubation at 37°C.
Microglial Cell Activation and Drug Exposure.
Endotoxin (LPS, E. coli serotype: 055-B5) at a concentration of 20 μg/ml in concert with 10 U/ml recombinant rat IFN-γ (Genzyme Diagnostics, Cambridge, MA) was used for activation of rat microglial cells. These concentrations of LPS and IFN-γ were shown to be optimal for induction of NO in preliminary dose-response experiments. Microglial cells were preincubated with medium containing cannabinoid or vehicle (0.05% ETOH in DMEM containing 5% HI-FBS) for 8 h before treatment with LPS/IFN-γ. This drug preincubation regimen was selected based on preliminary experiments to define the optimal exposure period that effected maximal inhibition of NO production. In all treatments groups, medium containing diluted cannabinoids was adjusted to contain 0.05% ETOH. Cells were maintained in the corresponding diluted cannabinoid or vehicle-supplemented media for the duration of the experimental period. Cells were monitored for viability throughout the experimental period by either trypan blue dye (0.25% w/v in PBS) exclusion or by crystal violet (2% w/v in 20% aqueous ethanol) staining. Vehicle- and cannabinoid-treated cultures exhibited more than 94% viability at 24 h postactivation.
Nitrite Quantitation.
Generation of NO was determined by measuring accumulation of the stable end product nitrite (NO2−) in culture supernatants as described previously (Green et al., 1982). Briefly, supernatants from microglial cultures (5 × 10⁵ cells/ml in flat-bottomed 24-well plates) were incubated (10 min, 25°C) with an equal volume (100 μl) of Greiss reagent (1% sulfanilamide, 0.1%N-naphthlethylene diamine dihydrochloride, and 0.1% phosphoric acid). The absorbance was measured at 550 nm using a Spectramax 250 enzyme-linked immunosorbent assay reader interfaced to a 486 WIN computer using SoftMaxPro program software (Molecular Devices Corp., Sunnyvale, CA). A standard curve was obtained by dissolving a concentration range of sodium nitrite (0.1–100 μM) in culture medium.
Quantitation of Cellular NOS Activity by the NADPH-Diaphorase Colorimetric Assay.
To quantitate cellular NOS activity, a colorimetric NADPH-diaphorase assay was used. Microglial cells (105/well in 0.2 ml, 96-well flat-bottomed plates) were pretreated with cannabinoids or vehicle for 8 h and activated by LPS/IFN-γ. After 24 or 48 h, monolayers were washed twice with warm PBS (pH 7.4), and 100 μl of a solution containing Tris-HCl (50 mM, pH 7.6) buffer (TB), nitroblue tetrazolium (NBT) (0.5 mM), and β-NADPH (1 mM) were added to each well. After incubation at 37°C (30–60 min), the reaction process reached a plateau and was terminated by the addition of 2× stop solution (50 μl/well) consisting of EDTA (4 mM),l-citrulline (2 mM), and the irreversible NOS inhibitor Nω-l-arginine methyl ester (NAME) (2 mM) in TB. The absorbance was determined at 580 nm using a Spectramax 250 enzyme-linked immunosorbent assay reader. A standard curve was obtained with serial dilutions of rat whole-brain extract [0.01–1 μg/ml protein; bicinchoninic acid (BCA) assay (Pierce, St. Louis, MO)] containing the appropriate cofactors (flavin adenine dinucleotide, 2 μM; flavin mononucleotide, 2 μM; BH4, 6 μM; and Ca2+-calmodulin, 5 U/ml) in TB. One unit of NADPH-diaphorase activity, equivalent to 1 μg of protein/ml of rat brain lysate, was defined as the enzyme level that yielded an absorbance of 0.2 at 580 nm. NADPH-diaphorase activity in triplicate wells was extrapolated accordingly and was expressed in (arbitrary) units per 106 cells.
Western Immunoblotting.
For detection of CB1 receptor protein, microglial cells were solubilized at 4°C in 2 mM Tris-HCl, pH 8.0, containing 140 mM NaCl, 0.025% NaN3, 2% Triton X-100, 5 mM iodoacetamide, 0.2 U/ml aprotinin, and 1 mM phenylmethylsulfonyl fluoride on an orbital shaker. After 1 h, a 0.2 volume of 5% sodium deoxycholate was added, and the mixture was incubated on ice for 10 min. The lysate was centrifuged (2800g, 10 min, 4°C), and the supernatant was collected, aliquoted, assayed for protein (BCA), and stored at −80°C until used. Protein samples were solubilized in sample buffer (0.05 M Tris, pH 6.8, 1% SDS, 1% 2-β-mercaptoethanol, 10% glycerol, 0.05 bromophenol blue) and heated (100°C, 5 min) before loading (15 μg of protein/lane) onto a 1.5-mm-thick 10% T, 2.7% C polyacrylamide gel. After electrophoresis at 30 mA/gel constant current in a cooled (10°C) chamber, proteins were transferred overnight at room temperature onto a polyvinylidene difluoride (PVDP)-plus membrane (Separation, Inc., Westborough, MA) with transfer buffer (25 mM Tris, 190 mM glycine, 20% methanol, and 0.05% SDS) at 90 mA, using a Bio-Rad Blot Cell apparatus (Bio-Rad, Hercules, CA). The membrane was blocked (overnight, 25°C) by casein in TBS (10 mM Tris, 0.9% NaCl, pH 7.4; Pierce), supplemented with 10% Tween 20, and then incubated with affinity-purified rabbit antibody (anti-CB1.83–98, diluted 1:100 in blocker casein), which recognizes an extracellular amine terminal domain (amino acids 83–98) of the rat CB1 receptor (Dove-Pettit et al., 1998). After incubation with goat anti-rabbit IgG-horseradish peroxidase (HRPO) (diluted 1:50,000) as the secondary antibody, enhanced chemiluminescence was performed using the SuperSignal CL-HRP Substrate System (Pierce), and the blots were exposed on Kodak XAR imaging film (Eastman Kodak Co., Rochester, N.Y). Molecular weight standards (Bio-Rad) were included in each electrophoretic run to allow for extrapolation of relative molecular weights of separated proteins.
Mutagenic Reverse Transcription-Polymerase Chain Reaction (MRT-PCR).
A MRT-PCR assay, which discriminates between amplified residual contaminating genomic DNA (gDNA) and complementary DNA (cDNA) from mRNA (Taniguchi et al., 1994), was modified for the identification of cannabinoid receptor mRNA. Oligonucleotide sequences were designed using the GAP and BESTFIT programs on the Genetics Computer Group software (University of Wisconsin, Madison, WI). The following reverse-transcription primer was synthesized and used to transcribe CB1: 5′-GGCCTGTG AA TGGATATGTACCTGTCGATGGCTGTGAGGAAC C GGCTGCCCAC-3′, corresponding to bases 613 to 665 of rat CB1 (where +1 is the start of the open reading frame). The C is a single-base mismatch that introduces a unique MspI site into the cDNA. For PCR amplification of CB1, 5′-ATGAAGTCGATCCTAGATGG (forward, bases +1 to +20) and 5′-GGCCTTGAATGGATTGTA (reverse, bases 646–665) were used. The reverse (3′ antisense) primer is identical with the first 20 bases of the RT primer, allowing for the amplification of the point mutation generated during RT. The 665-bp amplification product (amplicon) can be digested with MspI to generate two products (623 bp and 42 bp), whereas the product generated from gDNA remains undigested.
Because the total rat CB2 sequence is not yet defined in the GenBank database, the CB2 oligonucleotide primers were designed by aligning available CB2 sequences (mouse and human) to define conserved domains. In the case of the human/mouse CB2 sequence mismatch, the mouse sequence was used. The CB2 RT primer was 5′-GCAGCAGGCTGCCCCACAGAGGCTGTGAAGGTCATGGTCACACTGC A GATCTTCAGCAGG-3′, (bases 318–376 of mouse CB2), and the A is a single-base mismatch that introduces a unique BglII site into the cDNA. For PCR amplification, 5′-AGCGAATTCATGGAGGGATGCCGGGAGACAG-3′ [forward (5′ sense), bases −9 to +22] and 5′-GCAGCAGGCTGCCCACAGAGGC (reverse, bases 354–376, identical with the 5′ portion of the RT primer) were used. The 385-bp amplicon can be digested withBglII to generate two products (343 bp and 42 bp), whereas the product from gDNA remains undigested.
The RT step was performed by mixing 10 fmol of the RT primer with 3 μg of total RNA [isolated from cultured microglial cells using Trizol reagent (Gibco, Grand Island, NY)] in buffer (1 mM Tris-HCl pH 8.3, 50 mM KCl, 4 mM MgCl2, 1 mM dithiothreitol, 1 mM each dNTP) in a 10-μl volume. The reaction mixture was heated to 75°C (5 min), cooled to 42°C and MuLV RTase (10 U in 0.5 μl) plus RNase inhibitor (5 U in 0.5 μl) were added, and the reaction was incubated at 42°C for 1 h. For PCR amplification, 100 ng of each of the appropriate PCR primers was added (with 31 μl of MilliQ water, 4 μl of 25 mM MgCl2, and 4 μl of 10× PCR buffer), and the reaction mixture was heated to 94°C for 1 min, during which 2.5 U of AmpliTaq DNA polymerase was added. The reaction mixture was subjected to 35 cycles of denaturation at 94°C for 1 min, annealing (1.5 min) at 50°C for CB1 or at 72°C for CB2, and extension at 72°C (2 min). Eight microliters of PCR product was digested at 37°C (12 h) with 20 U of MspI orBglII for CB1 or CB2, respectively. The specificity of the amplicon was confirmed by Southern blot analysis. Briefly, the digestion products were separated by electrophoresis through a 1.5% agarose gel and were transferred by capillary action onto Qiabrane Nylon-Plus membrane (Qiagen, Chatsworth, CA) with transfer buffer (0.4 M NaOH). The blots were hybridized with a32P-labeled (dCTP, 3000 Ci/mM; DuPont NEN, Boston, MA), random-primed (Rediprime; Amersham Life Science, Arlington Heights, IL), CB1 or CB2 fragment (specific activity, 109 dpm/μg in 0.5 M phosphate buffer, pH 7.0, 7% SDS), and 1 mM EDTA for 4 h at 65°C. The CB1 and CB2 fragments were generated by amplification from a pCD-SKR6 template (Matsuda et al., 1990) and a murine CB2 cDNA (provided by Dr. T. I. Bonner, National Institute of Mental Health, Bethesda, MD) with the respective forward and reverse primers. Finally, blots were washed 4 times with 40 mM phosphate buffer, 0.5% SDS, and 1 mM EDTA (15 min each at 65°C), air dried, and exposed to Kodak XAR film.
Double Staining of Rat Microglial Cells With GSA-I-B4and CB1 Antibody.
A cytochemical technique was used for double-staining rat microglial cells for CB1 receptor protein and for a microglial cell marker using GSA-I-B4. Enriched acetone-fixed (10 min) microglial cell cultures on glass coverslips were rehydrated (20 min, room temperature) in 0.1 M Tris-HCl, pH 7.4, containing 0.1mM each of CaCl2, MgCl2, and MnCl2. The monolayers were treated (1 h, room temperature) with blocker casein in TBS (Pierce, Rockford, IL) containing 10% fetal bovine serum, incubated (15 min) with ImmunoPure Peroxidase Inhibitor (Pierce), and washed (2 times, 10 min each) in Tris-HCl containing the above cations. Monolayers then were incubated (2 h, room temperature) with horseradish peroxidase-conjugated GSA-I-B4 (Sigma; 20 μg/ml), washed in 0.1 M Tris-HCl containing cations, and treated with Histomark Orange reagent (Kirkegaard and Perry Laboratories, Gaithersburg, MD) for 10 min at room temperature. Next, the monolayers were washed (2 times, 10 min each) in 0.1 M Tris-HCl without cations, incubated (1 h, RT) with affinity-purified rabbit anti-CB1.83-98 antibody (diluted 1:10 in blocker casein), washed in 0.1 M Tris-HCl without cations (2 times, 10 min, RT), and incubated with alkaline phosphatase-conjugated goat anti-rabbit IgG (Kirkegaard and Perry Laboratories; 1:32 in Tris-HCl, 1 h, RT). Monolayers then were treated with Histomark Blue reagent (Kirkegaard and Perry Laboratories) for 1 h, washed (2 times, 10 min each) in 0.1 M Tris-HCl, rinsed in distilled water (10 min), mounted in Aquamount (Lerner Laboratories, Pittsburgh, PA), and examined with a Nikon Labophot 2A light microscope with a Microflex HFX-IIA photomicrographic attachment (Nikon Corporation, Tokyo, Japan). Using this immunocytochemical approach, orange staining identified cells as microglia, while blue staining indicated the presence of the CB1 receptor. Colocalization of the microglial cell marker and of the CB1 receptor within the same cell was recognized by the purplish color.
Statistical Analysis.
All treatment groups were performed in triplicate, and each experiment was reproduced a minimum of three times. Data were expressed as the mean ± S.E.M. and analyzed by Student’s t test or Bartlett’s test for homogeneity in conjunction with ANOVA and Dunnett’s multiple range/two-tailed comparison test to assess significance. Dose-dependence was assessed for significance by linear regression analysis. A value ofP < .05 was considered significant.
Results
Purification and Characterization of Enriched Rat Microglial Cultures.
Enriched microglial cultures contained less than 4% contaminating astrocytes based on immunofluorescence staining using mouse anti-rat monoclonal antibody to the astrocyte marker GFAP (Fig.1, A and B). Microglial cell cultures were greater than 96% pure based on positive staining with GSA-I-B4 (a lectin that binds the terminal sugar in the oligosaccharide side chain of a glycoprotein embedded in microglial plasma membranes; Fig. 1C). Furthermore, more than 96% of cells in the enriched microglial cultures (Fig. 1D) exhibited a high phagocytic index (i.e., greater than 25 intracellular E. coli per cell). The phagocytic uptake by these cells was a feature consistent with their identification as macrophage-like and occurred within 1 h of incubation at 37°C of 106cells with 109 bacteria. Collectively, these observations indicate that the purified cultures used in this study consisted of more than 96% microglial cells.

Purity of neonatal rat microglial cell cultures. A, immunofluorescence staining of an enriched astrocyte culture for the astrocyte marker GFAP (arrow). Note the fibrillar pattern of the GFAP staining. B, enriched microglial cell cultures showing absence of immunofluorescence staining for contaminating GFAP-positive cells. C, histochemical staining of microglial cells with horseradish peroxidase-conjugated GSA-I-B4. More than 96% of cells were positive (arrow) for isolectin binding consistent with their identification as microglia. D, enriched microglial cell cultures incubated with E. coli (109/106cells). Numerous (i.e., >25) intracytoplasmic bacteria can be seen within each cell consistent with their exhibition of macrophage phagocytic properties. Original magnification, 370×).
Differential Inhibition of NO Release from Rat Microglial Cells by (−)-CP55940 versus Its Paired Enantiomer (+)-CP56667.
Preliminary experiments were performed to define the temporal conditions and concentrations of LPS and/or IFN-γ required for optimal production of NO by rat microglial cells. Maximal levels of NO were measured from culture supernatants when microglial cells were maintained in DMEM supplemented with Ast-CM and containing LPS (20 μg/ml) plus IFN-γ (10 U/ml) (i.e., LPS/IFN-γ). NO was released into the culture medium in a linear fashion from 6 to 48 h after exposure to LPS/IFN-γ and reached a plateau at 72 h postactivation. A 24-h time period postactivation was selected for assessment of the effect of cannabinoids on NO release because that time period represented the approximate midpoint in the linear phase of the plotted curve for NO release and because it coincided with maximal cannabinoid-induced inhibition of NO production in other macrophage-like cells (Burnette-Curley et al., 1993).
Enriched cultures of rat microglial cells (5 × 10⁵ cells/ml) were preincubated for 8 h with either vehicle, the synthetic cannabinoid (−)-CP55940, or its paired enantiomer (+)-CP56667. The analog (−)-CP55940 exhibited high affinity binding for the CB1 cannabinoid receptor (Ki = 0.9 nM) (Compton et al., 1993). In contrast, its paired enantiomer (+)-CP56667 exhibited a less binding affinity (Ki = 62 nM) of approximately 60-fold for the CB1 receptor. Thus, these paired enantiomers were stereoselective in terms of their specific interaction with the CB1 receptor. Furthermore, these paired enantiomers have been shown to exert activities that are correlative to their structural relationships as related to receptor binding (Compton et al., 1993). After incubation with cannabinoid or vehicle, cultures were subjected to LPS/IFN-γ activation. NO release (at 24-h postactivation) was represented as percentage of inhibition compared with the LPS/IFN-γ-activated vehicle control (Fig. 2). The cannabinoid analog (−)-CP55940 exerted a dose-dependent inhibition of NO release when compared with the activated vehicle control. Maximal inhibition of NO production, approximately 40% when compared with activated vehicle-treated cells, was measured for cells treated with 8 μM (−)-CP55940. The drug dose-dependent inhibition exerted by (−)-CP55940 on NO release was found to be significantly greater (P < .05, Student’s t-test) than that exerted by the less active paired enantiomer (+)-CP56667 at each comparable concentration tested. Thus, (−)-CP55940 exerted an enantiomeric stereoselective inhibition of NO release by rat microglial cells. In addition, cells pretreated with 5 μM (−)-CP55940 and activated with LPS/IFN-γ exhibited a level of NO release approximately 2-fold less at 48 and 72 h postactivation when compared with cells pretreated with (+)-CP56667 (data not shown). Collectively, these results indicate that (−)-CP55940 selectively inhibits the production of NO rather than causing a delay in its release.

Differential inhibition of NO release by the cannabinoid agonist (−)-CP55940 versus its paired enantiomer (+)-CP56667. Microglial cells were pretreated with drug or vehicle for 8 h, treated with 20 μg/ml LPS plus 10 U/ml IFN-γ, and culture supernatants were assayed for nitrite 24 h later. Nitrite release from vehicle-treated cultures was 25.4 ± 3.3 (μM/106 cells/ml). Results are expressed as percentage of inhibition versus vehicle and are the mean ± S.E.M of triplicate wells from five replicate experiments. Similar results were obtained in three identical experiments. The high-affinity cannabinoid (−)-CP55940 exerted a dose-dependent inhibition of NO release from rat microglial cells. The drug dose-dependent inhibition was significantly greater (*P < .05, Student’s t test) than that exerted by its paired enantiomer (+)-CP56667 at each comparable concentration.
Differential Inhibition of NADPH-Diaphorase Activity in Rat Microglial Cells by (−)-CP55940 versus Its Paired enantiomer (+)-CP56667.
The proportional intracellular activity of NADPH-diaphorase, assayed by NBT reduction, has been shown to correlate with that of nitric oxide synthase (NOS) in neuronal cells (Hope et al., 1991). Thus, experiments were performed to confirm the NO release data as measured using the Greiss reagent. Quantitation of cellular NOS activity using an NADPH/NBT colorimetric assay demonstrated that (−)-CP55940 exerted an enantiomeric-selective dose-dependent inhibition of NADPH-diaphorase activity (Fig.3), which paralleled that observed for NO (Fig. 2). Maximal inhibition, approximately 45% compared with the LPS/IFN-γ-activated vehicle control, was elicited in microglial cultures pretreated with 5 μM (−)-CP55940. Approximately 20% inhibition was measured for cultures pretreated with 0.1 μM (−)-CP55940. In contrast, (+)-CP56667 pretreatment had a minimal effect on NADPH-diaphorase activity at drug concentrations comparable to those of (−)-CP55940.

Differential inhibition of NADPH-diaphorase activity exerted by (−)-CP55940 versus its paired enantiomer (+)-CP56667. Microglial cells were pretreated with vehicle or drug for 8 h, activated with 20 μg/ml LPS plus 10 U/ml IFN-γ, and maintained in the corresponding vehicle or drug concentration for 48 h. Cultures then were assayed for enzyme activity using a β-NADPH/NBT colorimetric assay. NADPH-diaphorase activity in vehicle-treated cultures was 29 ± 0.3 (U/106 cells). Data are expressed as mean ± S.E.M. of triplicate wells. Similar results were obtained in three identical experiments. The (−)-CP55940 dose-dependent inhibition of NADPH-diaphorase activity was greater (*P < .05, Student’s t test) than that exerted by (+)-CP56667 at each comparable concentration.
Reversal of (−)CP55940-Mediated Inhibition of NO Release by Treatment of Microglial Cells with Pertussis Toxin (PTX), βt2-cAMP, or Cholera Toxin.
The data indicating a drug dose-dependent differential effect of (−)CP55940 versus that of (+)CP56667 on NO production were consistent with a cellular action mediated through a cannabinoid receptor. To provide additional evidence for a role of a cannabinoid receptor in the mediation of NO and to obtain insight concerning the down-stream signal transduction pathways involved in this process, the effect of pretreatment of microglial cells with the Gαi/Gαoinactivator PTX on NO release (Fig. 4A) was investigated. Treatment of microglial cells for 18 h with 50 ng/ml PTX before exposure to (−)-CP55940 and LPS/IFN-γ activation resulted in a reversal of NO levels to approximately those of vehicle-treated LPS/IFN-γ-activated cells. In addition, rat microglial cells were pretreated for 12 h with the cell-permeable, hydrolysis-resistant cAMP analog βt2-cAMP (100 μM) to determine whether the inhibition of NO release by (−)-CP55940 was mediated through a signal transduction cascade for which cAMP served as the second messenger. Treatment of microglial cells with the cAMP analog resulted in a partial reversal of the inhibitory effect of (−)-CP55940 (Fig. 4B). A similar reversal of (−)-CP55940-mediated inhibition of NO production was observed for cells pretreated for 18 h with 50 ng/ml of the Gαs activator cholera toxin (CTX) before exposure to (−)-CP55940 and LPS/IFN-γ activation (Fig. 4C). PTX, βt2-cAMP, or CTX treatment alone did not elicit induction of NO. PTX, βt2-cAMP, or CTX treatment did not decrease LPS/IFN-γ-stimulated NO levels. However, administration of βt2-cAMP in concert with LPS/IFN-γ stimulation resulted in a slight augmentation of NO production when compared with cells pretreated with vehicle and stimulated with LPS/IFN-γ (data not shown).

Reversal of (−)-CP55940-mediated inhibition of NO release by PTX, dibutyryl cAMP (Bt2-cAMP), and CTX. A, pretreatment of rat microglial cells (5 × 10⁵/ml) with PTX (50 ng/ml) before exposure to 0.5 μM (−)-CP55940 and LPS/IFN-γ activation resulted in a reversal of the inhibition of NO release exerted. A similar reversal of inhibition of NO release was effected by reconstitution of microglial cell intracellular cAMP with Bt2-cAMP (100 μM); or B, pretreatment of cells with CTX (50 ng/ml). C, results (mean ± S.E.M. of triplicate wells) are shown as percentage of inhibition versus vehicle control. Nitrite released from LPS/IFN-γ-treated vehicle controls for the respective PTX, Bt2-cAMP, and CTX experiments was 27.2 ± 0.8, 32.3 ± 0.6, and 25.1± 0.7 (μM/106 cells), respectively. Similar levels of NO were elicited from LPS/IFN-γ-treated cultures pretreated with PTX, Bt2-cAMP, or CTX and medium. (**P < .01 versus the corresponding untreated sample). Similar results were obtained in three identical experiments.
Reversal of (−)-CP55940-Mediated Inhibition of NO Release by the CB1-Selective Antagonist SR141716A.
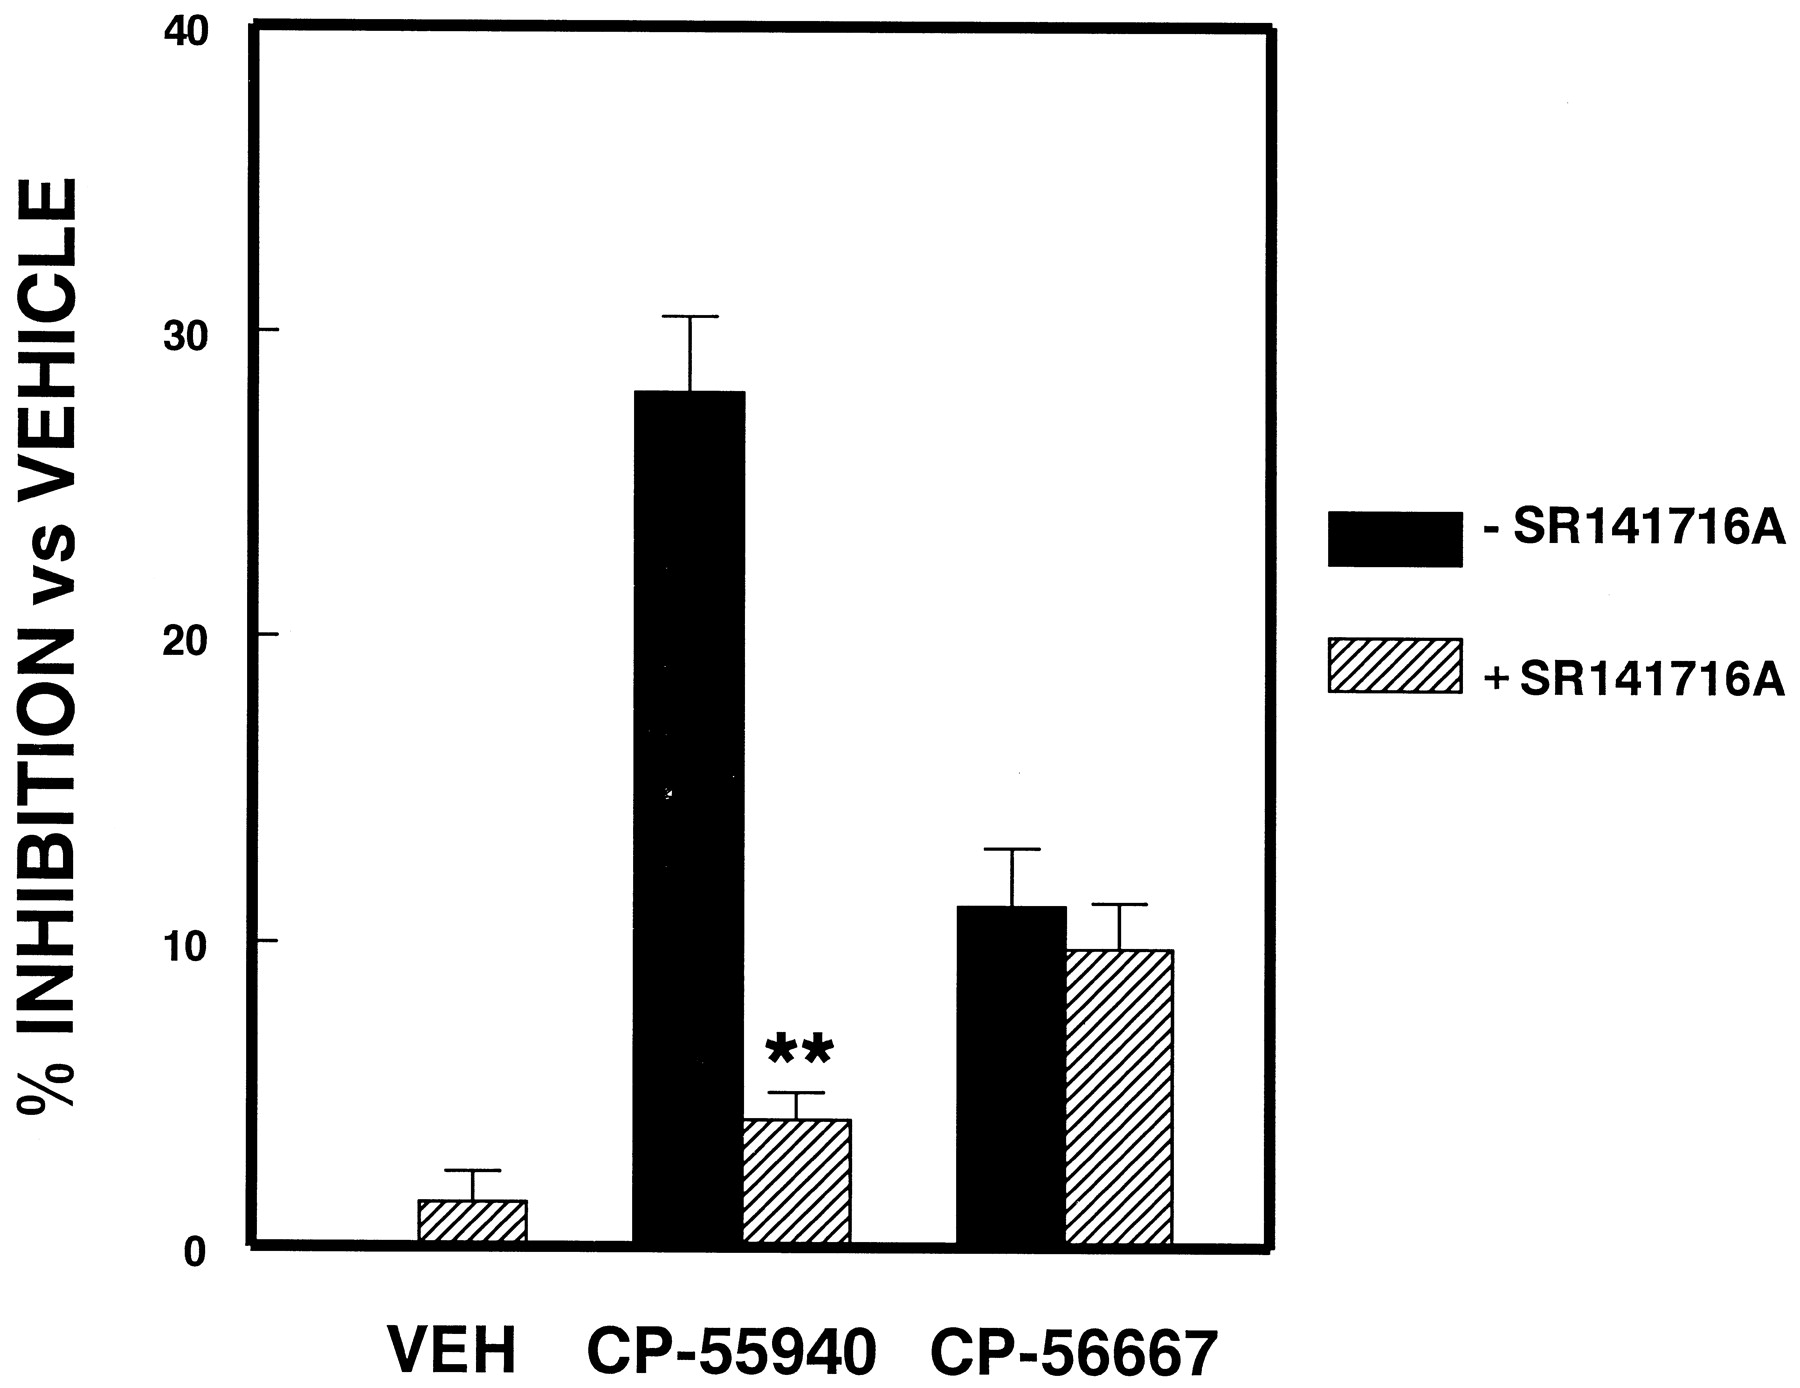
SR141716A has been shown to act as a CB1 receptor-selective antagonist in various experimental systems in vivo and in vitro (Rinaldi-Carmona et al., 1994). Therefore, the effect on NO release of pretreatment (2 h) of microglial cells with the CB1 antagonist before exposure to (−)-CP55940 was examined (Fig.5). Pretreatment of cells with SR141716A (5 × 10⁻⁷M) resulted in a reversal of the inhibitory effects exerted by (−)-CP55940 (5 μM). SR141716A (0.5 μM) administered alone had no effect on the release of NO by microglial cells.

Reversal of (−)-CP55940-mediated inhibition of NO release by SR141716A. Microglial cells were pretreated with 0.5 μM SR141716A or vehicle before exposure to vehicle, 5 μM (−)-CP55940, or (+)-CP56667 and LPS/IFN-γ activation. Results (mean ± S. E.M. of triplicate wells) are expressed as percentage of inhibition versus vehicle control (**P < .01 versus −SR141716A). Nitrite accumulation in vehicle-treated LPS/IFN-γ-activated cultures was 29.3 ± 3.5 (μM/106 cells). Similar results were obtained in three replicate experiments.
Molecular and Immunocytochemical Identification of CB1 in Rat Microglial Cells.
To confirm the presence of CB1 in rat microglial cells, MRT-PCR, Western immunoblotting, and double-staining immunocytochemistry analyses were performed. MRT-PCR, using total RNA extracted from highly purified rat microglial cells, revealed the presence of CB1 mRNA (Fig. 6). Identification of PCR-amplified cDNA from CB1 mRNA was accomplished by Southern blot analysis using a radiolabeled fragment of rat CB1 cDNA and subsequent visualization of a cleavage product of 623 bp generated after digestion with MspI. Total RNA from whole mouse brain or from purified rat astrocytes (not shown) served as a positive control. Total RNA from murine RAW 264.7 macrophage-like cells, which express only CB2 receptors (Jeon et al. 1996), served as a negative control. MRT-PCR, using CB2 oligonucleotide primers designed as described in Materials and Methods, failed to detect amplified gene product indicative of the expression of CB2 mRNA in rat microglial cells.
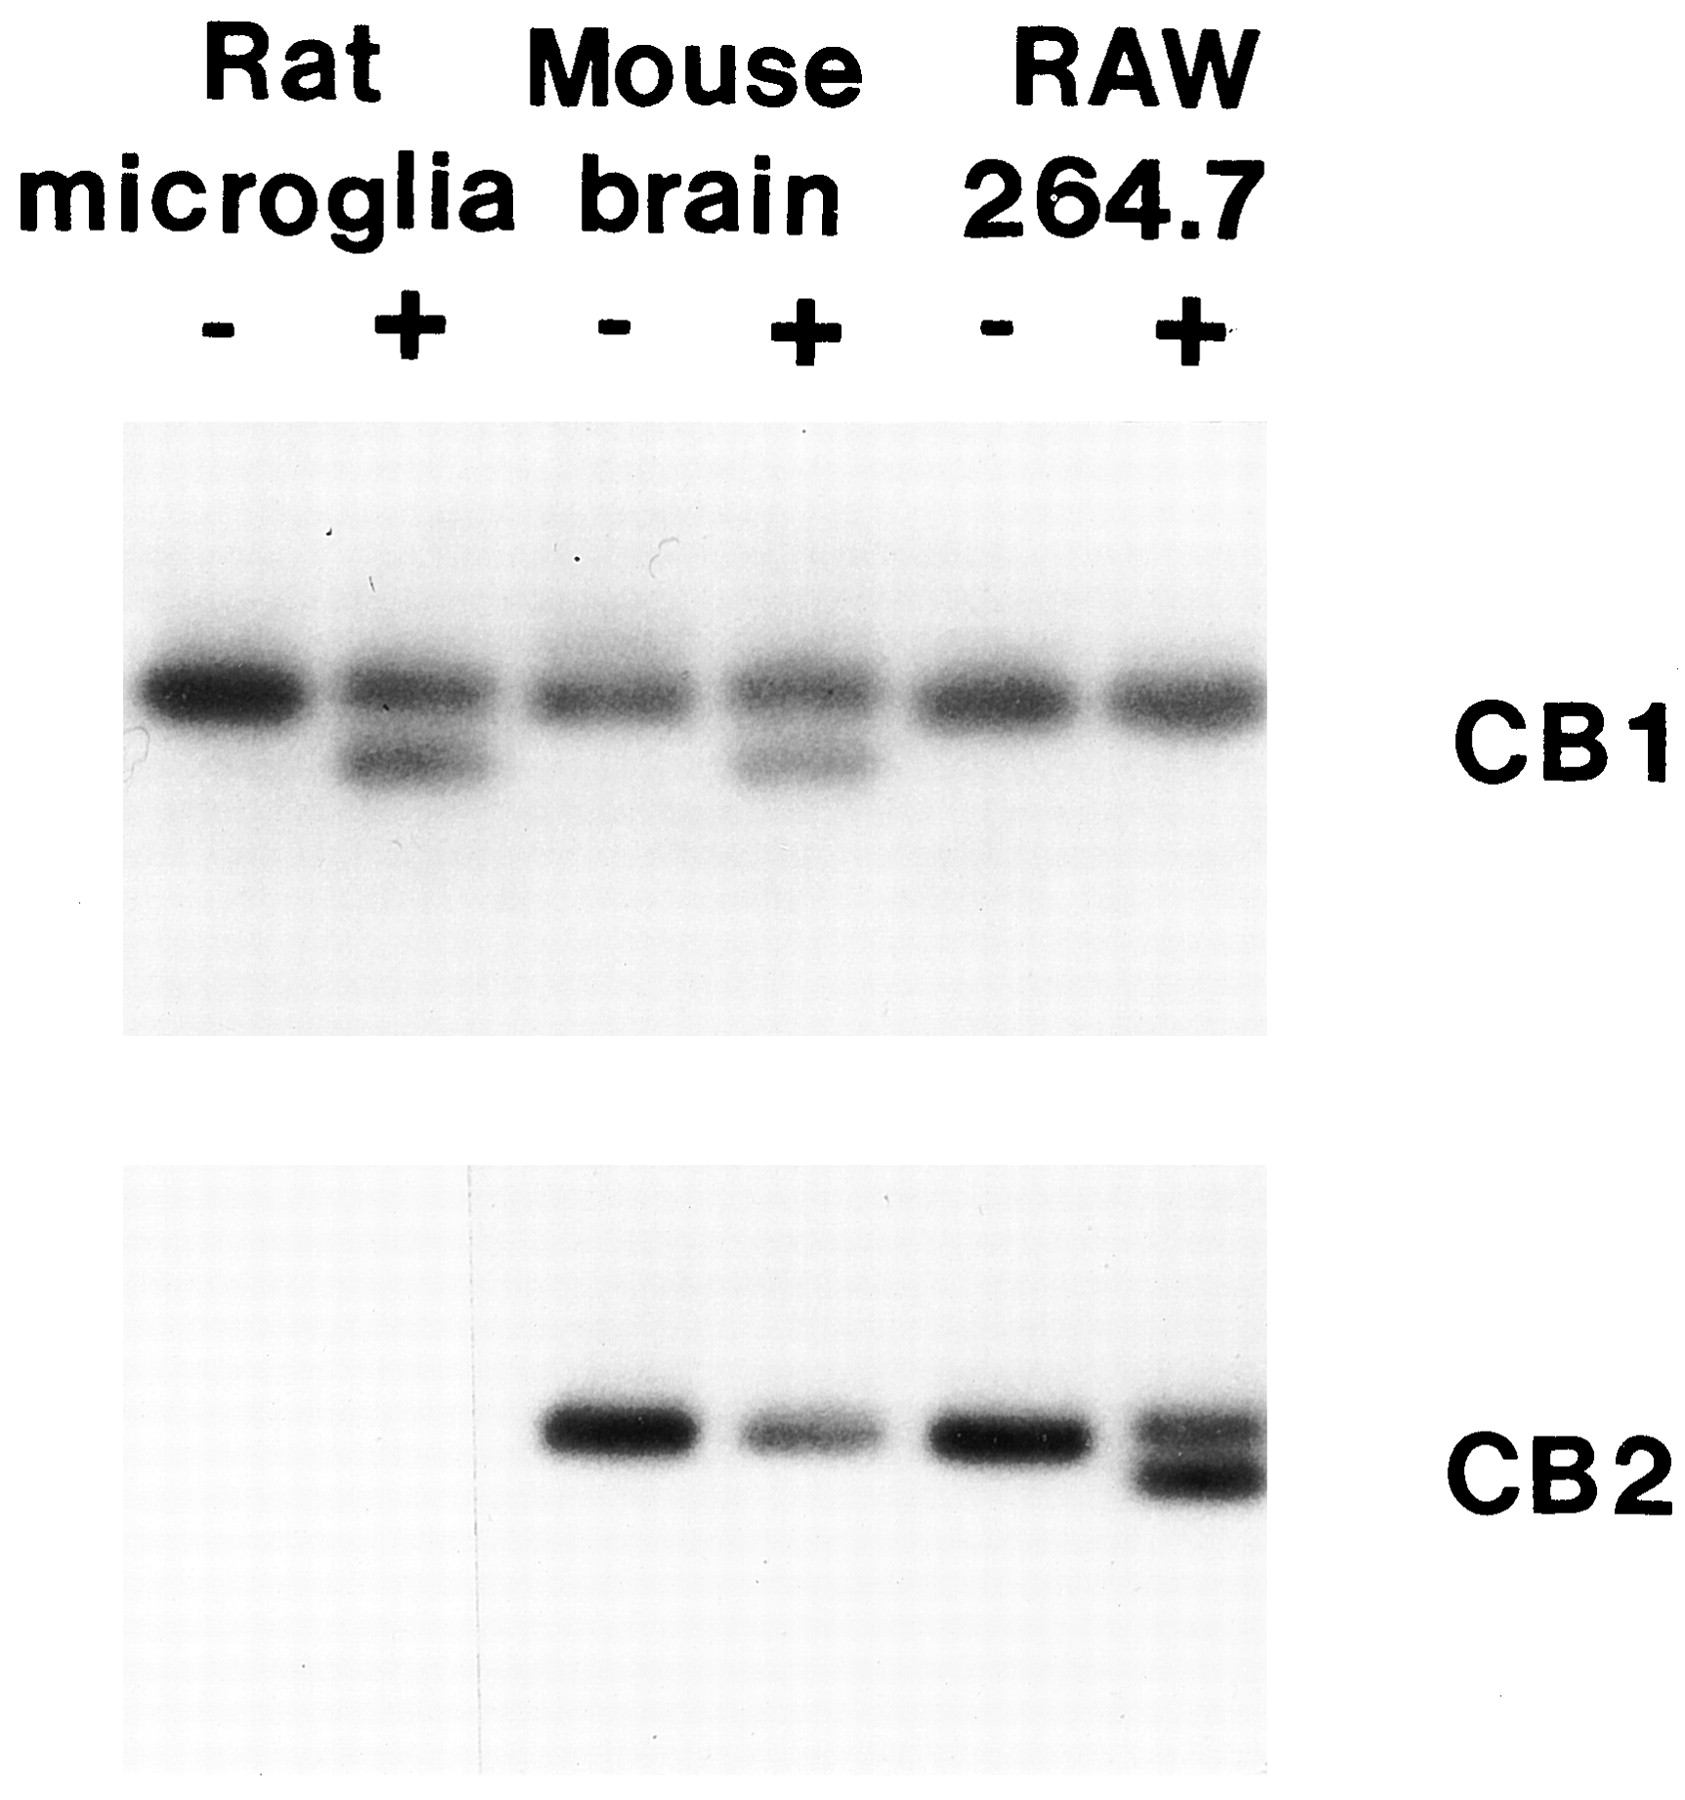
Identification of CB1 mRNA in rat microglial cells. Southern blot analysis of MRT-PCR products amplified from total RNA from rat microglial cells, mouse brain, and a RAW264.7 murine macrophage-like cell line. The − and + designations indicate whether the amplicons were undigested (−) or digested (+) withMspI or BglII for CB1 or CB2, respectively. CB1 mRNA (top) was detected in rat microglial cells and mouse brain as demonstrated by the presence of two products following digestion with MspI. CB2 mRNA (bottom) was detected only in RAW264.7 cells. No amplicon was detected from rat microglial cells.
To determine whether CB1 receptor protein also was expressed in rat microglial cells, Western immunoblot analysis using an affinity-purified antibody to an amine terminal domain of the rat CB1 was performed. The predicted molecular mass for the unmodified unglycosylated rat CB1 receptor protein, after appropriate extrapolation of its coding sequence from cDNA, is 53 kDa. Western immunoblotting of whole-cell homogenates of purified microglial cells subjected to SDS-polyacrylamide gel electrophoresis revealed the presence of immunoreactive species of approximately 43, 64, 83, and 123 kDa relative molecular mass (Fig. 7). CB1-immunoreactive product also was detected in homogenates of LPS/IFN-γ-activated cells, although at lower levels. No signal was obtained in the lanes containing homogenates of HL-60 human macrophage-like cells, which have been shown to express CB2 but not CB1. Homogenates from THP-1 cells, another human macrophage-like cell line that has been shown to express only CB1, served as a positive control.

Western immunoblot of whole-cell homogenates indicating the presence of CB1 protein in rat microglial cells. Protein (15 μg/lane) was incubated with affinity-purified rabbit antibody to a rat CB1 amine terminal domain (anti-CB1.83-98) followed by horseradish peroxidase-conjugated goat anti-rabbit IgG. Immunoreactive complexes were identified by means of enhanced chemiluminescence. Homogenates of THP-1 and HL-60 human macrophage-like cells served as CB1-expressing and CB2-expressing controls, respectively. Microglial cells were either untreated (−) or treated (+) with LPS/IFN-γ before analysis.
To confirm that the MRT-PCR and Western immunoblotting data were indicative of CB1 receptor expression within microglial cells rather than of expression within residual contaminating astrocytes, a double-staining immunocytochemistry approach using isolectin GSA-I-B4 conjugated to horseradish peroxidase and rabbit anti-CB1.83-96 affinity-purified antibody in concert with goat anti-rabbit IgG conjugated to alkaline phosphatase was used. Cells binding GSA-I-B4 exhibited an orange reaction product, characteristic of their identification as microglial cells (Fig. 8A). Cells exhibiting intense blue staining were indicative of the presence of the CB1 receptor (Fig. 8B). Staining for CB1 receptor protein was discerned throughout the cytoplasm but was most intense in the perinuclear region. This perinuclear distribution was observed often as having a “signet ring” pattern consistent with localization in the Golgi apparatus. In addition, staining for CB1 protein was observed in concentrations at distal ends of cytoplasmic extensions of microglial cells. These distal accumulations of immunoreactive product were generally observed adjacent to, or adjoining, other microglial cells. Double staining for the microglial cell marker and for the CB1 receptor was denoted by the purplish color indicative of colocalization (Fig. 8, C and D). The double-staining experiments confirmed that CB1 receptor protein was expressed in rat microglial cells.

Detection of CB1 in microglial cells by immunocytochemistry. Purified rat microglia were subjected to immunocytochemical staining using GSA-I-B4 to identify microglia and anti-CB1.83-98 to identify CB1. A, identification of microglial cells using GSA-I-B4 conjugated to horseradish peroxidase is denoted by the orange color (solid arrows). Original magnification, 220×. B, identification of CB1 in purified microglia using anti-CB1.83-98 followed by an alkaline phosphatase-conjugated secondary antibody is denoted by the blue color. Note the presence of reactive product in the cytoplasmic perinucleus (open arrow) and at distal cellular extensions (solid arrow). Original magnification 1100×. C, double staining of enriched microglial cultures demonstrating colocalization of CB1 and the microglial cell marker GSA-I-B4 as denoted by the purplish color of cells (arrows). The majority of cells in enriched microglial cultures coexpressed CB1 and the GSA-I-B4 binding marker. Original magnification, 350×. D, double staining of enriched microglial cultures. Note the perinuclear cytoplasmic blue staining (open arrow) indicative of CB1 localization in the perinucleus. Original magnification, 1100×.
Discussion
Exogenous and endogenous cannabinoids have been shown to alter the functional capabilities of immune cells in vivo and in vitro (Arata et al., 1991; Kaminski et al., 1994), including the elicitation of NO (Coffey et al., 1996; Jeon et al., 1996). In addition, Burnette-Curley et al. (1993) have demonstrated that psychotropic cannabinoids inhibit NO production by murine RAW264.7 macrophage-like cells. However, to date it has not been established whether mammalian microglial cells exhibit the same sensitivity to cannabinoids. Definition of an ablative effect of cannabinoids on production of proinflammatory mediators, especially in the context of a functional linkage to a cannabinoid receptor, would provide insight relevant to the application of select cannabinoids as therapeutic agents. Thus, in the present study the stereoselective enantiomeric pairs (−)-CP55940 and (+)-CP56667, in concert with the CB1 receptor-selective antagonist SR141716A, were used to address this issue.
Microglial cells were subjected in vitro to multistep activation with LPS plus IFN-γ (i.e., LPS/IFN-γ) because the combined action of these two agents resulted in a robust production of NO (Xie et al., 1992; Lowenstein et al. 1996). Production of NO was assessed by determining the accumulation of nitrite using the Greiss reagent. Experiments using the paired enantiomers (−)-CP55940 and (+)-CP56667 indicated a stereoselective differential effect on NO production. The high affinity cannabinoid receptor agonist (−)-CP55940 exerted a differential dose-dependent inhibition of NO production when compared with that exerted by the lower affinity enantiomer (+)-CP56667. At each comparable cannabinoid concentration, inhibition of NO exerted by (−)-CP55940 exceeded that exerted by (+)-CP56667 by more than 4-fold. This differential outcome was confirmed by time course experiments, which indicated that (−)-CP55940 inhibited NO production at 24, 48, and 72 h after LPS/IFN-γ stimulation, whereas (+)-CP56667 had a minimal inhibitory effect at these time points. These results are consistent with previous reports indicating that (−)-CP55940 exhibits high-affinity binding (Ki = 0.9 nM) for the CB1 receptor when compared with its stereoisomer (+)-CP56667 (Ki = 62 nM) and that these differential binding affinities correlate with pharmacological activities (Compton et al., 1993). Thus, these data implicate a cannabinoid receptor in the mediation of NO production by microglial cells because enantiomeric stereoselectivity is a characteristic feature of receptor-mediated cellular activity.
To confirm and extend the differential cannabinoid inhibition data as related to NO production as measured using the Greiss reagent, the paired enantiomers were used in experiments to assess their effect on intracellular NADPH-diaphorase activity. Assessment of NADPH-diaphorase activity has been shown to serve as a correlate measure of intracellular NOS activity (Hope et al., 1991). Using a colorimetric assay, a similar drug dose-dependent differential effect of (−)-CP55940 versus (+)-CP56667 was observed in the inhibition of NADPH-diaphorase activity of LPS/IFN-γ-treated microglial cells. Furthermore, the differential inhibitory effect exerted by (−)-CP55940 at all concentrations tested paralleled closely that obtained for NO release using the Greiss reagent. Collectively, these results indicate that (−)-CP55940 inhibits NO production and that it does so at the level of iNOS expression and/or activity.
The data indicating a dose-dependent differential inhibition of NO production and NADPH-diaphorase activity by (−)-CP55940, when compared with its paired enantiomer (+)-CP56667, are consistent with a role of a cannabinoid receptor in the mediation of these actions. To date, two cannabinoid receptor types have been identified (Matsuda et al., 1990;Munro et al., 1993). CB1 has been localized primarily in neural tissues while CB2 has been identified in cells of the immune system (Galiègue et al., 1995). These receptors have been shown to be negatively coupled to adenylate cyclase through a Gαi protein (Bidaut-Russel et al., 1990). Signal transduction through the cannabinoid receptor results in decreased levels of the second messenger cAMP. Thus, to provide additional evidence for a role of a cannabinoid receptor in the inhibition of NO production and NADPH-diaphorase activity, functional implication studies were conducted. Experiments included 1) pretreatment of microglial cells with the Gαi/Gαo receptor uncoupling agent PTX, 2) cellular reconstitution of cAMP using the cell-permeable analog Bt2-cAMP, and 3) treatment of microglial cells with the Gαs activator CTX to increase intracellular cAMP levels. Treatment of microglial cells with PTX before exposure to (−)-CP55940 and LPS/IFN-γ activation resulted in restoration of NO levels to approximately those of vehicle-treated LPS/IFN-γ-activated cultures. A similar restoration of NO levels was obtained after reconstitution of intracellular cAMP using Bt2-cAMP or activation of Gαs using CTX. Coffey et al. (1996) have reported that LPS and IFN-γ elicit a large increase of cAMP synthesis in murine peritoneal macrophages and that this increase is inhibited by (−)-THC. These investigators found also that the inactive stereoisomer (+)-Δ9-THC was only weakly inhibitory of NO release. In addition, Jeon et al. (1996) reported that (−)-THC attenuated the activation of the nuclear transcription factor NFκB as a result of adenylate cyclase inhibition in murine RAW 264.7 macrophage-like cells. This pleiotropic transcription factor is found in cells of the immune system and the CNS and controls the expression of a variety of genes involved in inflammatory processes and neuronal development and plasticity (O’Neill and Kaltschmidt, 1997). A reduction in intracellular cAMP levels inhibits NFκB binding to a 10-bp consensus sequence in the enhancer region of the iNOS gene resulting in an inhibition of its expression. Thus, the data obtained from the implication studies are supportive of a functional role of a cannabinoid receptor in the inhibition of NO production by microglial cells and indicate that this action is mediated, at least in part, through an adenylate cyclase/cAMP second messenger pathway.
To identify the specific cannabinoid receptor subtype involved in the inhibition of NO production by microglial cells, studies were performed using the CB1-selective antagonist SR141716A, MRT-PCR, Western immunoblotting, and immunocytochemistry. Pretreatment of microglial cells with SR141716A resulted in a reversal of the (−)-CP55940-mediated inhibition of NO production by LPS/IFN-γ-activated cells, implicating functionally the CB1 receptor in this action. MRT-PCR confirmed the presence of CB1 receptor message in total RNA extracted from highly purified neonatal rat microglial cells. However, no evidence was obtained for the presence or absence of CB2 mRNA, as the full rat CB2 sequence has not yet been defined in the GenBank database, and the primer design applied to the MRT-PCR was based on sequence conserved for human and mouse CB2.
Western immunoblot analysis, using affinity-purified anti-CB1 antibody, confirmed the presence of the CB1 receptor in rat microglial cells at the protein level. Major immunoreactive species of approximately 43, 64, 83, and 123 kDa relative molecular mass were observed. The sizes of the 64- and 83-kDa immunoreactive products were consistent with those predicted for the rat CB1 based on extrapolation from its cDNA-coding sequence and taking into consideration post-translational modifications such as glycosylation. The 43-kDa species may represent truncated or incompletely translated gene product. The 123-kDa species may represent aggregated protein or, alternatively, a cross-reacting species unrelated to the CB1. The relative molecular mass sizes of these immunoreactive species are in agreement with those observed previously in CB1-expressing cells and rat brain (Dove-Pettit et al., 1998). To establish that CB1-immunoreactive protein represented receptor expression within microglial cells and not expression within potential residual contaminating cells such as astrocytes, double-staining immunocytochemical experiments were performed. Isolectin GSA-I-B4 conjugated to horseradish peroxidase was used to detect an oligosaccharide side chain of a glycoprotein expressed in microglial plasma membranes (Streit and Kreutzberg, 1987). Indirect immunostaining using alkaline phosphatase-conjugated goat anti-rabbit IgG as the secondary antibody and affinity-purified rabbit anti-CB1.83-98 as the primary antibody was used to demonstrate the presence of CB1. Colocalization of GSA-I-B4isolectin binding and CB1 was denoted by orange and blue precipitation products, respectively, within the same cell. More than 90% of cells in the enriched microglial cultures were shown to express both markers. These cytochemical studies confirmed the expression of CB1 within microglial cells and are in agreement with those of Sinha et al. (1998)who reported recently the expression of CB1 receptors in macrophage-like cells in brain tissue.
In summary, this study reports on CB1 receptor expression in a primary immune cell type in the context of functional relevance. That is, the data support a linkage between the CB1 receptor as expressed in brain microglial cells and the inhibition of NO. These results expand on our current knowledge concerning the role of cannabinoid receptors in the modulation of immune cell function as, to date, the CB2 receptor has been the only cannabinoid receptor subtype implicated in cannabinoid-mediated immune modulation. These data suggest also that select cannabinoid agonists have the potential to ablate the elicitation of proinflammatory mediators especially under conditions of chronic neuropathological disease. However, because the CB1 receptor is expressed on multiple cell types in the brain, the application of cannabinoid receptor agonists as therapeutic agents could also elicit a variety of undesirable pharmacological effects.
Acknowledgments
We thank Dr. Billy R. Martin for providing (−)-CP55940, (+)-CP56667, and SR141716A, and we thank C. Boothe for excellent technical assistance.
Footnotes
-
Send reprint requests to: Dr. Guy A. Cabral, Department of Microbiology and Immunology, MCV Station, Box 980678, Virginia Commonwealth University, Richmond, VA 23298-0678. E-mail:gacabral{at}gems.vcu.edu
-
↵1 This research was supported by National Institutes of Health awards: DA 05832, DA 05247, and DA 09158. Dr. Carlisle and John M. Olson were supported, in part, by T32DA07027 and T32AI07407, respectively.
- Abbreviations:
- TNF-α
- tumor necrosis factor α
- IFN-γ
- γ-interferon
- LPS
- lipopolysaccharide
- Ast-CM
- astrocyte-conditioned medium
- CB1
- central cannabinoid receptor
- CNS
- central nervous system
- (−)-CP55940/(+)-CP56667
- −/+cis-3-[2-hydroxy-4-(1,1-dimethylheptyl)-trans-4-(3-hydroxypropyl)-cyclohexanol]
- FBS
- fetal bovine serum
- iNOS
- inducible nitric oxide synthase
- MRT-PCR
- mutagenic reverse transcription-polymerase chain reaction
- NO
- nitric oxide
- NBT
- nitroblue tetrazolium
- SR141716A
- (N-(piperidin-1-yl)-5-(4-chlorophenyl)-1-(2,4-dichlorophenyl)-4-methyl-H-pyrazole-3-carboxamide hydrochloride
- GSA-I-B4
- Griffonia simplicifolia isolectin B4
- GFAP
- glial fibrillary acidic protein
- Received May 28, 1998.
- Accepted October 13, 1998.
- The American Society for Pharmacology and Experimental Therapeutics


