


Abstract
We developed novel methods for analyzing the concentration-response curve of an agonist to estimate the product of observed affinity and intrinsic efficacy, expressed relative to that of a standard agonist. This parameter, termed intrinsic relative activity (RAi), is most applicable for the analysis of responses at G protein-coupled receptors. RAi is equivalent to the potency ratios that agonists would exhibit in a hypothetical, highly sensitive assay in which all agonists behave as full agonists, even those with little intrinsic efficacy. We investigated muscarinic responses at the M2 receptor, including stimulation of phosphoinositide hydrolysis through Gα15 in HEK 293T cells, inhibition of cAMP accumulation through Gi in Chinese hamster ovary (CHO) cells, and stimulation of cAMP accumulation through Gs in CHO cells treated with pertussis toxin. The RAi values of carbachol, oxotremorine-M, and the enantiomers of aceclidine were approximately the same in the three assay systems. In contrast, the activity of 4-[[N-[3-chlorophenyl]carbamoy]oxy-2-butynyl]trimethylammonium chloride (McN-A-343) was ∼10-fold greater at M2 receptors coupled to Gα15 in HEK 293T cells compared with M2 receptors coupled to Gi in the same cells or in CHO cells. Our results show that the RAi estimate is a useful measure for quantifying agonist activity across different assay systems and for detecting agonist directed signaling.
Drug discovery often involves testing compounds in isolated tissues and high throughput assays to determine activity at target receptors. In the case of agonists, the measured parameters are usually EC50 and Emax, whereas the parameters of greater relevance to drug design are observed affinity and intrinsic efficacy.1 If the receptor is a ligand-gated ion channel, then receptor activation can be measured directly as whole cell current, and the EC50 and Emax are reasonable estimates of observed affinity and intrinsic efficacy provided that desensitization is not excessive. It would seem that, in most instances, the observed affinity and intrinsic efficacy of an agonist for a ligand-gated ion channel would be constant, regardless of the tissue or cell in which the receptor is expressed.
The situation is more complex for a G protein-coupled receptor (GPCR). First, GPCRs are inactive in isolation and must interact with a G protein to elicit a response. It is possible that the G protein with which the receptor interacts selects for a receptor conformation having a unique agonist profile and that the observed affinity and intrinsic efficacy of the agonist-receptor complex may be G protein-specific or influenced by other proteins interacting with the receptor (Leff et al., 1997; Berg et al., 1998). Second, because it is difficult to measure receptor activation directly, most assays involve measuring a downstream response, and the corresponding EC50 and Emax values may vary, depending on the point in the signaling cascade at which the experimenter measures the response. Therefore, the magnitude of the response elicited by a GPCR is usually not proportional to receptor activation, and EC50 and Emax are not equivalent to observed affinity and intrinsic efficacy. Rather, EC50 and Emax depend on the receptor, proteins interacting with the receptor, and a long list of downstream elements that affect the sensitivity of the response. Because the number of nonreceptor entities that affect observed affinity and intrinsic efficacy is small compared with the long list of cellular components affecting EC50 and Emax, it would seem that observed affinity and intrinsic efficacy would be useful parameters for the characterization of the agonist-GPCR complex across different assays. The estimation of these parameters, however, requires additional data not obtained in high throughput screens. Fortunately, it is possible to estimate the product of observed affinity and intrinsic efficacy of an agonist relative to that of a standard agonist just through analysis of the concentration-response curves (Ehlert et al., 1999; Ehlert and Griffin, 2001). This product is equivalent to the potency ratio that an agonist would exhibit relative to a standard agonist in a hypothetical, highly sensitive assay in which both agonists behave as full agonists, even if one or both have very little observed intrinsic efficacy. When viewed from this perspective, estimation of the product of observed affinity and efficacy provides a means of converting potential differences in both the EC50 and Emax values of agonists into a single, relative measurement, analogous to the potency ratio. Therefore, the product of observed affinity and intrinsic efficacy should be a useful, receptor-dependent parameter for measuring agonist activity at GPCRs.
Here we describe methods for analyzing agonist concentration-response curves to estimate the product of observed affinity and intrinsic efficacy expressed relative to that of a standard agonist. We refer to this product as intrinsic relative activity (RAi). The calculations are the same as those used in the analysis of allosterism in which the control agonist concentration-response curve is compared with one whose properties of affinity and efficacy have been modified allosterically (Ehlert, 1988, 2005). This situation is analogous to comparing the concentration-response curves of two different agonists with differing affinities and efficacies. We have estimated the RAi values of a group of agonists for eliciting responses through the human M2 receptor coupled to Gi,Gα15, and Gs to determine whether the G protein with which the M2 receptor interacts influences the activity of the selected agonists. Although most of the agonists investigated exhibited similar RAi values for triggering M2 muscarinic responses through the different G proteins, compound McN-A-343 exhibited ∼10-fold greater activity when stimulating M2-Gα15 responses compared with M2-Gi responses. Our results show that RAi is a useful parameter for the estimation of agonist activity across different assays.
Materials and Methods
Cell Culture
Chinese hamster ovary (CHO) cells stably expressing the human M2 muscarinic receptor (CHO M2 cells) were obtained from Acadia Pharmaceuticals (San Diego, CA) and cultured in Dulbecco's modified Eagle's medium with high glucose plus l-glutamine (DMEM) supplemented with 10% fetal calf serum, penicillin-streptomycin (100 units/ml) and G 418 (0.3 mg/ml) at 37°C in a humidified atmosphere with 5% CO2. HEK 293T cells stably expressing Gα15 (HEK Gα15) were kindly provided by Dr. Olivier Civelli (University of California, Irvine, Irvine, CA) and were grown in DMEM containing 10% fetal calf serum, penicillin-streptomycin (100 units/ml), G 418 (0.4 mg/ml), and puromycin (0.625 μg/ml). A plasmid containing the human M2 receptor (hM2 pCD clone) was kindly provided by Dr. Tom Bonner (National Institutes of Health, Bethesda, MD) and subcloned into a hygro(-)pcDNA3.1 vector as described previously (Griffin et al., 2003). HEK Gα15 cells were transiently transfected with the human M2 receptor (HEK Gα15 M2 cells) using Lipofectamine 2000 and 15 μg of the M2 vector. HEK 293T cells were stably transfected with the human M2 receptor in the same manner, and clones of stably transfected cells (HEK M2) were isolated in DMEM containing 10% fetal calf serum, penicillin-streptomycin (100 units/ml), hygromycin (0.2 mg/ml), and G 418 (0.4 mg/ml).
cAMP Accumulation
The effects of muscarinic agonists on forskolin- or isoproterenol-stimulated cAMP accumulation was measured in CHO M2 and HEK M2 cells using a modification of the [3H]adenine prelabeling method of Schultz et al. (1972) and the chromatography procedure of Salomon et al. (1974). Confluent cell monolayers grown in T75 flasks were washed with DMEM media and then incubated in 9 ml of DMEM containing [3H]adenine (60 μCi) and adenine (3 μM) for 1 h at 37°C in 5% CO2. Cells were washed twice with DMEM and harvested using trypsin. The resulting cell suspensions were centrifuged for 10 min at 350g, suspended in Krebs-Ringer bicarbonate (KRB) buffer (124 mM NaCl, 5 mM KCl, 1.3 mM MgCl2, 26 mM NaHCO3, 1.2 mM KH2PO4, 1.8 mM CaCl2, and 10 mM glucose) at pH 7.4 and centrifuged a second time. Ultimately, cells were suspended in KRB buffer (12 ml) containing isobutylmethylxanthine (0.5 mM) and incubated for an additional 10 min at 37°C before use in the cAMP assay. Muscarinic agonist-mediated inhibition of cAMP accumulation was carried out in plastic tubes containing intact cells, forskolin (10 μM), isobutylmethylxanthine (0.5 mM), and various concentrations of a muscarinic agonist in a final volume of 0.35 ml of KRB buffer. The reaction was started by the addition of an aliquot (300 μl) of cells and was stopped by addition of an aliquot (200 μl) of ice-cold 30% (w/v) trichloroacetic acid. After at least 30 min on ice, the tubes were centrifuged for 10 min at 3000g, and an aliquot (0.5 ml) from each tube was applied to a Dowex 1.5-ml column (AG-50W-X4, 200–400 mesh) and washed with two aliquots of water (1.25 ml each) to remove [3H]ATP. The [3H]cAMP was eluted onto a column of neutral alumina (0.6 g) with 4 ml of water and then eluted into scintillation vials with 4 ml of 0.1 M imidazole HCl (pH 7.5). The samples were counted by liquid scintillation spectroscopy. In experiments in which muscarinic agonist-mediated stimulation in cAMP accumulation was measured, cells were first treated overnight (16–18 h) with pertussis toxin (0.1 μg/ml; final concentration) before labeling with [3H]adenine.
Phosphoinositide Hydrolysis
Muscarinic agonist-mediated stimulation of phosphoinositide hydrolysis was measured in suspensions of HEK Gα15 and HEK Gα15 M2 cells using a modification of the [3H]inositol prelabeling method of Berridge et al. (1982) and the extraction method of Kendall and Hill (1990). Confluent cell monolayers grown in T75 flasks were washed with DMEM and then incubated in 9 ml of DMEM containing [3H]inositol (45 μCi) for 16 to 18 h at 37°C in 5% CO2. Cells were washed twice with DMEM and harvested using trypsin as described above. Ultimately, the cell pellet was suspended in KRB buffer (15 ml) containing LiCl (10 mM) and incubated at 37°C for 15 min. Muscarinic agonist-mediated stimulation of [3H]-inositol phosphate accumulation was performed in plastic tubes containing intact cells, LiCl (10 mM), and various concentrations of muscarinic agonist in a final volume of 333 μl of KRB buffer. The reaction was started with the addition of an aliquot (300 μl) of cell suspension, and the mixture was gassed with O2-CO2, capped with a rubber stopper, and incubated at 37°C for 15 min. The reaction was stopped with 5% perchloric acid (200 μl), and the tubes were placed on ice. [3H]Inositol phosphates were isolated as described previously (Tran et al., 2006).
In some experiments, cells were treated with pertussis toxin (0.1 μg/ml final concentration) overnight during the incubation with [3H]inositol. In experiments using 4-DAMP mustard, AF-DX 116 was added to cells after labeling with [3H]inositol to give a final concentration of 4 μM. After a 10-min incubation (37°C and 5% CO2), a small volume of 4-DAMP mustard was added (final concentration 40 nM), and the cells were allowed to incubate for 1 h at 37°C and 5% CO2. Immediately before use, 0.4 mM 4-DAMP mustard was cyclized to the aziridinium ion by a 30-min incubation at 37°C in 10 mM NaKPO4, pH 7.4 (Thomas and Ehlert, 1992). After 4-DAMP mustard treatment, cell monolayers were washed 3 times with DMEM to remove AF-DX 116 and unreacted 4-DAMP mustard and its transformation products.
Preliminary Analysis of Agonist Concentration-Response Curves
The maximal response (Emax), concentration of agonist eliciting a half-maximal response (EC50), and the Hill slope (n) were estimated from the agonist concentration-response curve by nonlinear regression analysis using Prism (GraphPad Software, Inc., San Diego, CA). The data for agonist-mediated inhibition of cAMP accumulation were fitted to the following equation:  in which P denotes cAMP accumulation elicited by forskolin or isoproterenol in the absence of muscarinic agonist and Emax denotes the maximal percent inhibition of cAMP accumulation. The agonist concentration-response curve for stimulation of phosphoinositide hydrolysis and enhancement of forskolin-stimulated cAMP accumulation in pertussis toxin treated cells was fitted to the following equation:
  In this equation, P denotes the basal value of phosphoinositide hydrolysis measured in the absence of agonist. The dissociation constant of an antagonist (KI) was estimated on the basis of its ability to antagonize the response to an agonist competitively. The following equation was used to estimate KI:
  In this equation, I denotes the concentration of the antagonist used in the assay, and CR denotes the EC50 value of the agonist measured in the presence of the antagonist divided by that measured in its absence.
Estimation of RAi
To reduce error in the estimation of RAi, we always tested the standard agonist carbachol together with the test agonist in the same experiment. In most instances, all five agonists were tested simultaneously. Our methods for the estimation of RAi represent a further refinement in our previously published methods (Ehlert et al., 1999; Ehlert and Griffin, 2001). We define the RAi value of test agonist B relative to standard agonist A as the product of the observed intrinsic efficacy and affinity of agonist B divided by that for agonist A:  In this equation, ϵA and ϵB denote the observed intrinsic efficacies, and KA and KB denote the observed dissociation constants of agonists A and B, respectively. In the first step of this analysis, the concentration-response curves of the test agonist B and the standard agonist A are analyzed by nonlinear regression analysis according to eqs. 1 or 2 to estimate the EC50, Emax, and Hill slope values. If the Emax values of the two agonists are the same, then the RAi value of agonist B expressed relative to A can be calculated as (Ehlert et al., 1999):
  In this equation, subscripts are used to denote the EC50 values of A and B. When the Emax value of the test agonist is different from that of the standard agonist, the analysis is more complicated, and three different methods have been developed to estimate RAi in this situation, each with its own advantages and disadvantages. These are 1) a null method, which is independent of the relationship between occupancy and response, 2) a method based on the operational model, assuming a logistic relationship between occupancy and response, and 3) a special case of the operational model in which the Hill slope of the agonist concentration-response curve is equivalent to 1.
Null Method. The null method involves comparing equiactive concentrations of the test agonist B and the standard agonist A.In our description of the method, we designate the standard agonist as the agonist with the larger Emax. An advantage of this method is that it is suitable for the analysis of any shape of concentration-response curve as long as the curve is a continuous, increasing function of the agonist concentration. The method involve three steps: 1) estimation of pairs of equiactive concentrations of agonist A and B, 2) nonlinear regression analysis of these equiactive concentrations according to eq. 8, and 3) calculation of the RAi value using eq. 9, which requires parameter estimates from step 2.
Pairs of equiactive agonist concentrations (Ai and Bi) are estimated as follows. The values of Bi are simply those of the concentration-response curve of test agonist B, with the subscript i denoting the different concentrations. Each corresponding Ai value is estimated from the concentration-response curve of agonist A by interpolating an Ai value that yields a response equivalent to that elicited by Bi. This interpolation is shown graphically in Fig. 3. Different methods of interpolation can be used, depending upon the shape of the concentration-response curve of A. In our experiments, the responses to all of the agonists were consistent with eqs. 1 and 2. Consequently, we rearranged these equations to solve for the agonist concentration (X) as a function of the response (R). Thus, eq. 1 was rearranged into the following form to interpolate Ai values from the concentration-response curve for inhibition of cAMP accumulation:  In this equation, Ri-B denotes the response elicited by the ith concentration of B (Bi), and EC50-A, Emax-A, and nA denote the best-fitting parameter estimates of the concentration-response curve of the standard agonist A. For agonist-stimulated phosphoinositide hydrolysis in HEKGα15 cells and agonist-mediated enhancement of forskolin-stimulated cAMP accumulation in pertussis toxin-treated CHO M2 cells, eq. 2 was rearranged to the following to enable an interpolation of AI values:
  Thus, by substituting in the response values of the concentration-response curve to B into the corresponding eqs. 6 and 7, it was possible to estimate a set of Ai values equiactive to those of Bi. The resulting pairs of equiactive agonist concentrations were fitted to the following equation by nonlinear regression analysis:
  The derivation of this equation is given under Appendix, and it represents the log form of eq. 19. The parameters p and q are defined under Appendix (see eqs. 20 and 21) and are equivalent to the observed affinity and efficacy of B relative to A, respectively. As described under Results, there are an infinite number of parameter estimates that yield the least-squares fit; however, the solution set is unique in that the ratio q/p is constant. Thus, it was possible to estimate q/p by fixing the parameter KA to an arbitrarily high value and determining the values of q and p that minimized the residual sum of squares. Additional details of the regression analysis are given under Results, and a method for obtaining initial parameter estimates for the iterative procedure is given in the last section under Appendix. The RAi value can be calculated as
  Substitution of eqs. 20 and 21 for p and q shows that eq. 9 reduces to eq. 4. It is possible to estimate the dissociation constant of the test agonist (KB)as
  in which KA denotes the constant to which KA was fixed during regression analysis.
Operational Model. When the agonist concentration-response curve is consistent with a logistic equation (eq. 1 or 2), it is possible to estimate the RAi value of a partial agonist B relative to a more efficacious agonist A by first fitting the concentration-response curves of A and B to the operational model of Black and Leff (1983) by nonlinear regression analysis:  in which R denotes the response to the agonist, X denotes the concentration of A or B, and τ is defined in eq. 25 under Appendix. For the experiments involving agonist stimulation of phosphoinositide hydrolysis and stimulation of cAMP accumulation in CHO M2 cells treated with pertussis toxin, the response denotes the measurement minus the basal value observed in the absence of agonist. For the experiments involving agonist-mediated inhibition of forskolin- or isoproterenol-stimulated cAMP accumulation, the response represents the percentage inhibition of cAMP accumulation. Equation 11 is essentially equivalent to eq. 24 under Appendix. The subscript j is used to denote different agonists. Thus, Kj denotes the dissociation constants of A and B (KA and KB), whereas τj denotes the τ values of A and B (τA and τB), respectively. The concentration-response curves to the standard agonist A and the test agonist B are analyzed simultaneously by global nonlinear regression analysis, sharing the estimates of Msys and m between the curves and allowing for individual estimation of τj and Kj for the standard agonist (τA and KA) and the test agonist (τB and KB). If the standard agonist is a full agonist with a receptor reserve, then an infinite number of parameter estimates will yield a least-squares fit as described under Results. However, the solution set does yield the best estimates of m, Msys, τB, KB, and the ratio τA/KA. Thus, it may be necessary to fix KA to an arbitrarily high value and determine the values of the other parameters that yield a least-squares fit as described under Results. Additional details of the regression analysis are given under Results, and a method for obtaining initial parameter estimates for the iterative procedure is given in the last section under Appendix. The RAi value of B relative to A is calculated as
  By making the appropriate substitutions for τ (eq. 25 under Appendix), it can be shown that eq. 12 reduces to eq. 4.
Hill Slope Equals 1. When the Hill slope of the agonist concentration-response curve is equal to 1, the RAi value of agonist B relative to standard agonist A is calculated as  If the definition of τ (eq. 25) is substituted into eqs. 27 and 28, and these latter equations are then substituted for the Emax and EC50 values into eq. 13, then it can be shown that eq. 13 reduces to eq. 4.
Drug and Chemicals
Drugs and chemicals were obtained from the following sources: [3H]adenine and [3H]inositol, PerkinElmer Life and Analytical Sciences (Boston, MA); DMEM and trypsin-EDTA (Invitrogen, Carlsbad, CA); carbachol, McN-A-343, and oxotremorine-M (Sigma-Aldrich, St. Louis, MO); and AF-DX 116 (Boehringer Ingelheim Pharmaceutical, Ridgefield, CT). 4-DAMP mustard was synthesized as described previously (Thomas et al., 1992). The enantiomers of aceclidine were synthesized and resolved as described by Ringdahl et al. (1979).
Results
Phosphoinositide Hydrolysis. We investigated the ability of muscarinic agonists to elicit phosphoinositide hydrolysis through the M2 muscarinic receptor in HEK Gα15 cells. The highly efficacious muscarinic agonist, oxotremorine-M, elicited a small phosphoinositide response in HEK Gα15 cells, presumably through activation of an endogenous muscarinic receptor. When the latter cells were transiently transfected with the human M2 muscarinic receptor, the resulting cells (HEK Gα15 M2) exhibited a robust phosphoinositide response to oxotremorine-M (Fig. 1a). The response was resistant to treatment with pertussis toxin (0.1 μg/ml, overnight incubation; data not shown). To identify the endogenous receptor mediating phosphoinositide hydrolysis in HEK Gα15 cells, we characterized the antagonism of the response by subtype-selective muscarinic antagonists. When measured in the presence of either AF-DX 116 (10 μM) or pirenzepine (1.58 μM), the concentration-response curve to oxotremorine-M shifted to the right 17- and 14-fold, respectively. These antagonist-induced shifts correspond to calculated pKI values of 6.20 ± 0.095 and 6.89 ± 0.19 for AF-DX 116 and pirenzepine, respectively (see eq. 3). Collectively, these pKI values agree with the corresponding binding affinities (pKD values) of AF-DX 116 and pirenzepine at the human M3 muscarinic receptor (6.10 ± 0.06 and 6.59 ± 0.03) but not those of the M1 (6.24 ± 0.03 and 7.77 ± 0.03), M2 (7.27 ± 0.05 and 5.96 ± 0.05), M4 (6.96 ± 0.12 and 7.23 ± 0.02), or M5 muscarinic receptor (5.29 ± 0.11 and 6.55 ± 0.06). Consequently, we conclude that the M3 subtype mediates phosphoinositide hydrolysis in HEK Gα15 cells.
To eliminate this M3 response, we treated cells with the irreversible muscarinic antagonist 4-DAMP mustard in combination with the competitive M2 selective antagonist AF-DX 116 for 60 min followed by washing. This treatment has been shown to cause 93% inactivation of M3 receptors while only inactivating M2 by 22% (Griffin et al., 2003). As shown in Fig. 1b, 4-DAMP mustard treatment completely eliminated the response to the endogenous M3 receptor in HEK Gα15 cells while having little inhibitory effect on that measured in HEK Gα15 M2 cells.
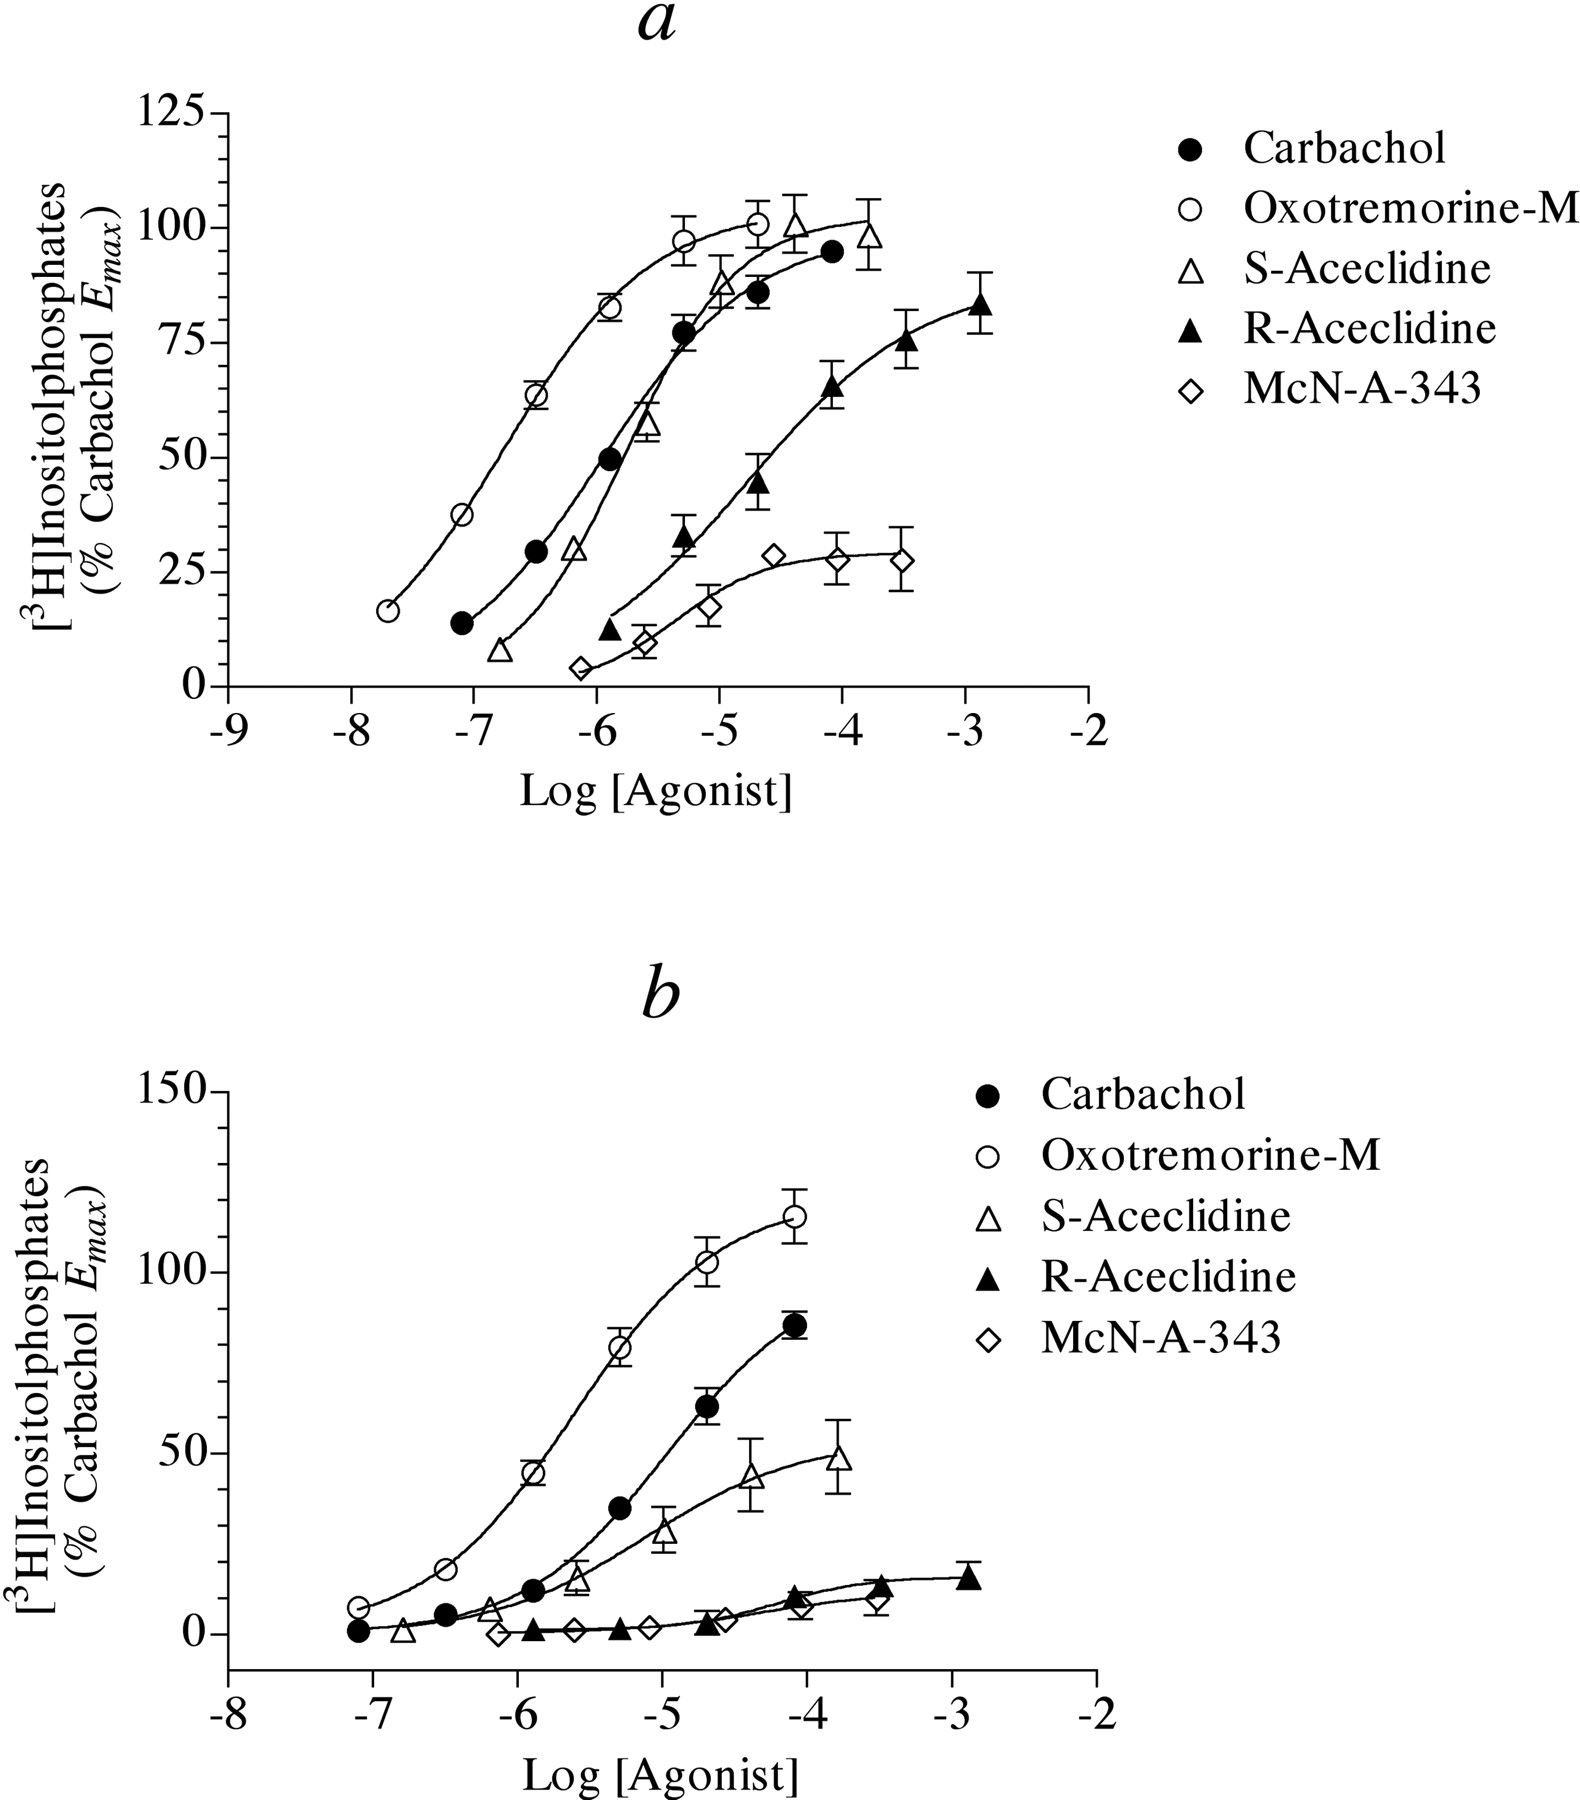
Having developed a simple method for investigating the signaling of the M2 receptor through Gα15, we measured the ability of a group of agonists with varying potencies and intrinsic efficacies to stimulate phosphoinositide hydrolysis in HEK Gα15 M2 cells, which had been previously treated with 4-DAMP mustard. We also treated these cells with pertussis toxin (0.1 μg/ml) overnight to prevent M2 receptor signaling through Gi/o. Figure 2a shows the results of these experiments. Oxotremorine-M, carbachol, and S-aceclidine all elicited potent responses with similar Emax values, whereas R-aceclidine and McN-A-343 behaved as partial agonists. Table 1 lists the EC50, Emax, and Hill slope values for these experiments. We also investigated the ability of the same group of agonists to stimulate phosphoinositide hydrolysis in HEK Gα15 cells that had not been transfected with the M2 receptor nor treated with 4-DAMP mustard (Fig. 2b). Under these conditions, the agonists were less potent and R-aceclidine and McN-A-343 produced barely detectable responses. Table 2 summarizes the results of these experiments.
Activity of muscarinic agonists for stimulating phosphoinositide hydrolysis in HEK Gα15 M2 cells The data are from Fig. 2a. The data represent the mean estimates ± S.E.M. The values in parentheses beside some of the estimates are the log means ± S.E.M.
Agonist activity for stimulating phosphoinositide hydrolysis in HEK Gα15 cells The data are from Fig. 2b. The data represent the mean estimates ± S.E.M. The values in parentheses beside some of the estimates are the log means ± S.E.M.
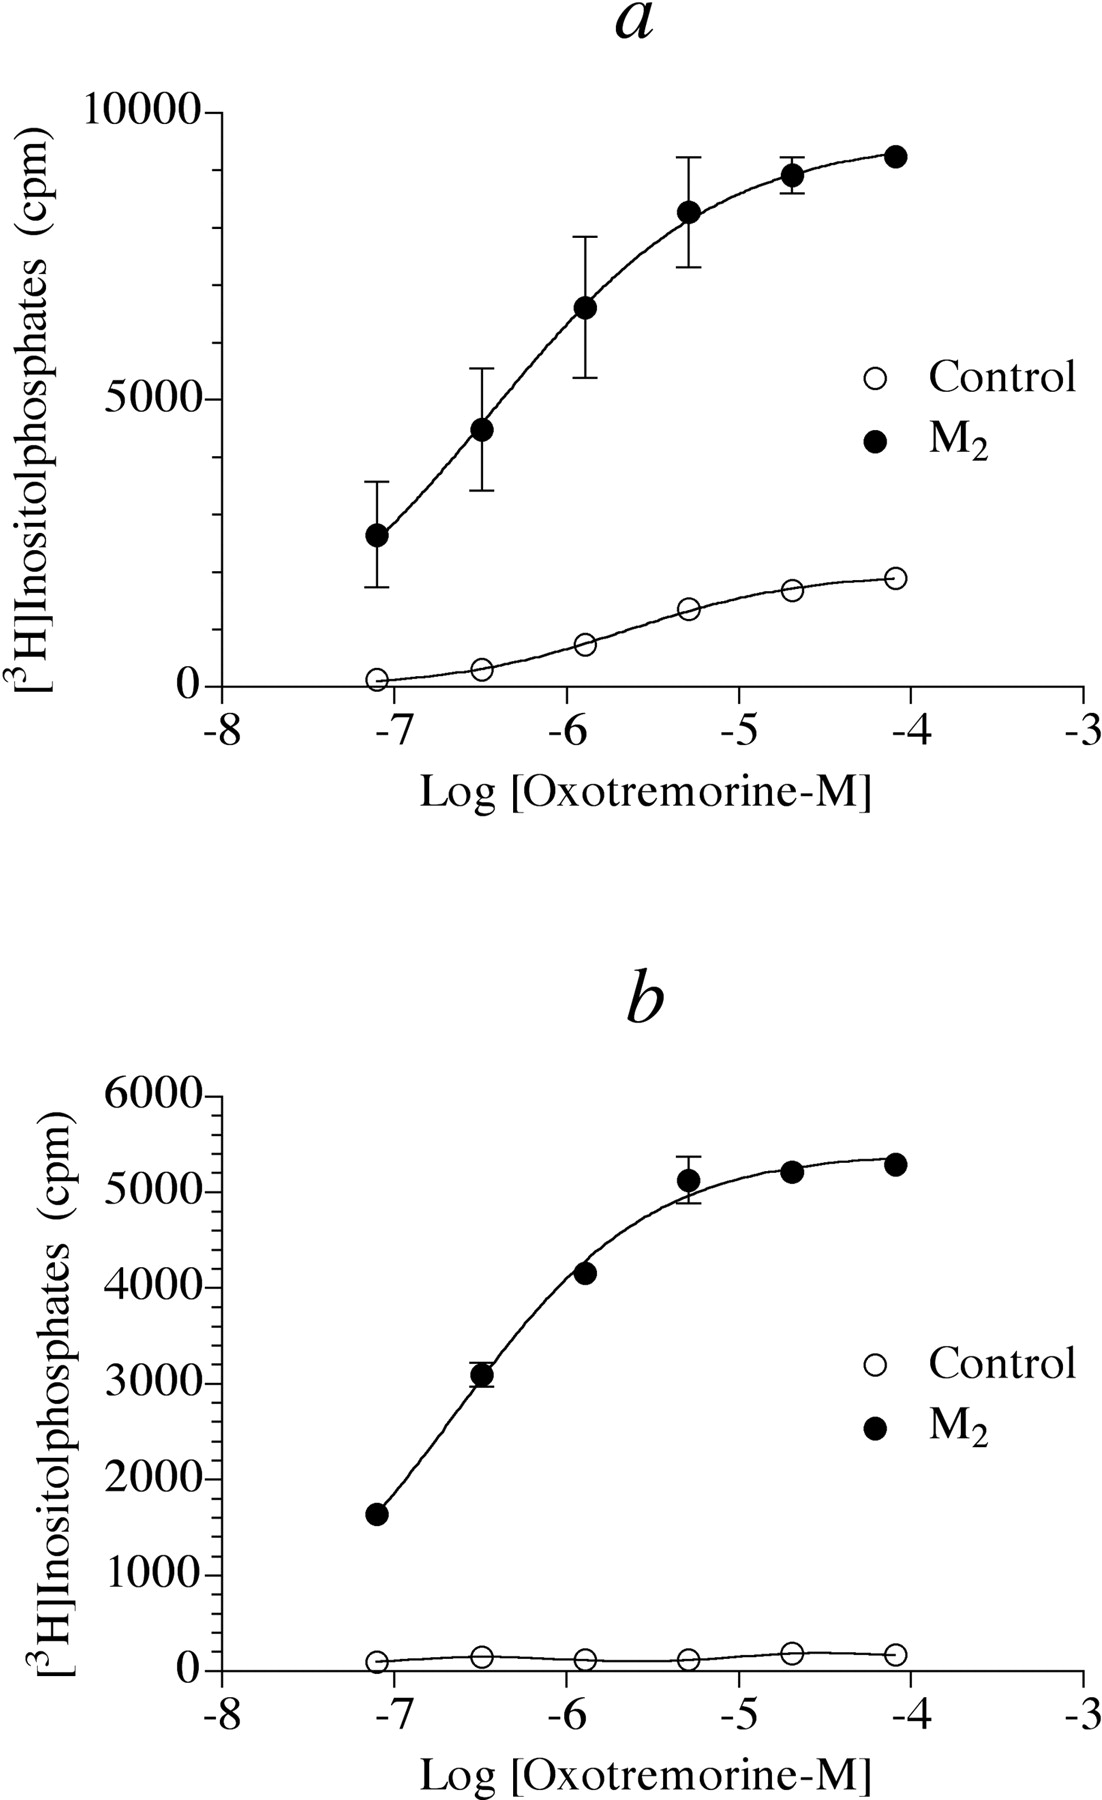
Influence of 4-DAMP mustard treatment on muscarinic agonist-mediated phosphoinositide hydrolysis in HEK Gα15 cells. a, oxotremorine-M-mediated phosphoinositide was measured in control HEK Gα15 cells and those that had been transiently transfected with the human M2 receptor. The data represent the mean values ± S.E.M. of two representative experiments, each done in triplicate. b, the experiment described in a was repeated in cells that had been treated with 4-DAMP mustard (40 nM) in combination with AF-DX 116 (4 μM) for 1 h and washed three times. The data represent the mean values ± S.E.M. of six experiments each done in triplicate.
Estimation of Agonist RAi Values for Phosphoinositide Hydrolysis in HEK Cells. We estimated the RAi values of agonists from the data shown in Fig. 2a using the procedures described under Materials and Methods. Figure 3 illustrates our use of the null method to estimate the RAi value of McN-A-343 relative to carbachol. First, predicted concentrations of carbachol that elicit responses equivalent to those of the concentration-response curve to McN-A-343 were interpolated as shown in Fig. 3a using eq. 7. These interpolated concentrations are plotted against the corresponding equiactive concentrations of McN-A-343 in Fig. 3b. Equation 8 was fitted to the data by nonlinear regression analysis to estimate p, q, and KA; however, an infinite number of parameter values yield the same least-squares fit. Consequently, it is impossible to find a solution set consisting of single values of these parameters. When the value of KA was fixed as a constant; however, it was possible to obtain a least-squares fit corresponding to unique values of p and q and the constant KA. As the value of log KA was set at various values between -7.5 and an arbitrarily high value of -1, the best-fitting values of p and q decreased proportionately so that their ratio remained constant as well as the residual sum of squares (RSS). Thus, it was possible to estimate the ratio p/q even though it was impossible to estimate unique values of KA, p, and q. The RAi of McN-A-343, expressed relative to carbachol is simply calculated as the ratio q/p (see eq. 9). The RAi values of S- and R-aceclidine were estimated using a similar strategy. Because the Emax value of carbachol was less than those of oxotremorine-M and S-aceclidine, we first calculated the RAi values of carbachol and S-aceclidine relative to oxotremorine-M and then expressed the resulting RAi values relative to carbachol. A summary of these estimates is given in Table 1. We estimated the dissociation constants of the partial agonists R-aceclidine (pK = 3.81 ± 0.37) and McN-A343 (pK = 4.63 ± 0.15) using eq. 10. We also used the operational model to estimate the RAi values of the agonists. First, we fitted the concentration-response curves shown in Fig. 2a to eq. 11 using global nonlinear regression analysis, sharing the estimates of Msys and m among the curves and estimating unique values of τ and K for each curve. It was possible to obtain unique estimates of all of the parameters using this method; however, the estimates of τ and K for the full agonists were poorly defined and exhibited huge standard errors as well as the estimate of Msys. This limitation arises with full agonists or, in other words, whenever the Emax value is approximately equal to the maximum response of the system (Msys). Nevertheless, the ratio of τ/K for each agonist was well defined. Thus, it was possible to estimate the RAi value of each agonist by taking the ratio of the τ/K of each agonist relative to that of carbachol as shown by eq. 12. The RAi estimate of each agonist is listed in Table 1 together with the values estimated by the null method. It can be seen that there is close agreement between the two methods. It was also possible to estimate the dissociation constants of the partial agonists, R-aceclidine (pK = 3.64 ± 0.46) and McN-A-343 (pK = 4.93 ± 0.12).
To illustrate the unique relationship among parameter estimates in the operational model, we fixed the log KA value of the standard agonist carbachol (Kcarb) at various values between -6 and -1 and used nonlinear regression analysis to estimate the best-fitting values of the other parameters. Figure 4b shows the results of this regression analysis for the estimation of the RAi value of McN-A-343 relative to carbachol. It can be seen that once the log Kcarb value is ∼≥–5, the RSS drops to a minimum and remains at this low value no matter how large the increase in Kcarb. Over this range of Kcarb values, the estimates of m, Msys, τMcN, and KMcN are constant. As log Kcarb increases from -5 to -1, there is a proportional increase in τcarb such that the ratio of τcarb/Kcarb is constant (Fig. 4c). Figure 4c illustrates that the ratio of τMcN/KMcN is also constant over the domain log Kcarb >-5 as well as the estimate of RAi. In summary, the results in Fig. 4 illustrate that it is possible to estimate the RAi value of a partial agonist relative to a full agonist by setting the KA value of the full agonist to an arbitrarily high value and using nonlinear regression analysis to estimate the other parameters in the operational model (eq. 11). The RAi value can then be calculated from these parameters using eq. 12. This analysis for the agonists in Fig. 2 also yielded estimates of m (0.721 ± 0.044), Msys (104 ± 4.7), and the dissociation constants of the partial agonists as listed in the previous paragraph. Figure 4a shows the best fit of the operational model to the concentration-response curves of carbachol and McN-A-343 using this method.

Muscarinic agonist-mediated phosphoinositide hydrolysis in HEK Gα15 cells. a, agonist-mediated phosphoinositide hydrolysis was measured in HEK Gα15 cells transiently transfected with the human M2 receptor and treated with pertussis toxin (0.1 μg/ml, overnight incubation). The cells were subsequently treated with 4-DAMP mustard (40 nM) and AF-DX 116 (4 μM) for 1 h followed by washing before measuring phosphoinositide hydrolysis. The data represent the mean values ± S.E.M. of four to six experiments, each done in triplicate. The data are expressed relative to the Emax for carbachol. b, agonist-mediated phosphoinositide hydrolysis was measured in HEK Gα15 cells treated with pertussis toxin (0.1 μg/ml, overnight incubation). The data represent the mean values ± S.E.M. of four to six experiments, each done in triplicate.
We also estimated the RAi values of the agonists for stimulation of phosphoinositide hydrolysis in HEK Gα15 M2 cells using the simple calculation given in eq. 13, which is valid provided that the Hill slopes are similar to 1. The calculation is also reasonably accurate if the Hill slopes differ from 1, and the Emax values of the agonists are not less than 50% that of a full agonist. Table 1 lists these estimates. It can be seen that there is close agreement between the estimates using eq. 13 and those estimated with the null method and operational model for all of the agonists exhibiting similar Emax values (i.e., oxotremorine-M, carbachol, S-aceclidine, and R-aceclidine). However, the simple estimate of the RAi for McN-A-343 is ∼3-fold greater than those estimated using the other two methods, which illustrates the flaw in using the simple method when the Hill slopes differ from 1 and there is a large difference in Emax between the standard and test agonist.
We also estimated the RAi values of carbachol, oxotremorine-M, S-aceclidine, R-aceclidine, and McN-A-343 for their effects on phosphoinositide hydrolysis in HEK Gα15 cells that had not been transfected with the M2 receptor, and these results are summarized in Table 2.
Agonist-Mediated Inhibition of cAMP Accumulation in CHO M2 Cells. To determine whether the RAi values of agonist varied depending upon the G protein with which the M2 receptor interacts, we measured agonist-mediated inhibition of forskolin-stimulated cAMP accumulation in CHO cells stably transfected with the human M2 muscarinic receptor (Fig. 5a). Carbachol, oxotremorine–M, and the enantiomers of aceclidine behaved as full agonists and caused a maximal inhibition of cAMP accumulation of ∼73%, whereas that of McN-A-343 was only 32%. There was a tendency for the maximal effect of R-aceclidine to exceed that of the other full agonists. As described below, R-aceclidine exhibited a nonspecific inhibition of cAMP accumulation at high concentrations (i.e., 1.0 mM). Consequently, we shared the estimate of the Emax among the full agonists to prevent an overestimation in the Emax of R-aceclidine. The Emax,EC50, and Hill slope values of these data are summarized in Table 3. The RAi values of the full agonists were calculated according to eq. 13 and are also listed in Table 3. Note that when the standard agonist and the test agonist exhibit the same Emax, eqs. 5 and 13 yield the same result. The RAi value of McN-A-343 was estimated using eq. 13 as well as the null method and operational model, and these estimates are also shown in Table 3. In this instance, eq. 13 gave results similar to those for the other two methods, probably because the Hill slopes of carbachol and McN-A-343 were close to 1. The estimates of the negative logarithm of the dissociation constant of McN-A343 using the null method (pK = 4.16 ± 0.24) and the operational model (pK = 4.07 ± 0.16) were approximately the same.
Agonist activity for inhibiting forskolin stimulated cAMP accumulation in CHO M2 cells The data are from Fig. 2b. The data represent the mean estimates ± S.E.M. The values in parentheses beside some of the estimates are the log means ± S.E.M.

Use of the null method to estimate the RAi value of McN-A-343 relative to carbachol in experiments on HEK Gα15 M2 cells. a, pairs of equiactive concentrations of carbachol and McN-A-343 (Ai and Bi) are estimated from their respective concentration-response curves. The data are taken from Fig. 2a. b, a plot of the log of the equiactive agonist concentrations. The theoretical curve represents the least-squares fit of eq. 8 to the data. c, summary of nonlinear regression analysis of the plot in b. The value of KA was constrained as a constant over the range of values shown on the abscissa, and the values of p and q that yielded the least-squares fit to the data were estimated by regression analysis. It can be seen that the estimates of p and q are proportional to one another such that their ratio (q/p or RAi) is constant over the range of KA values shown.
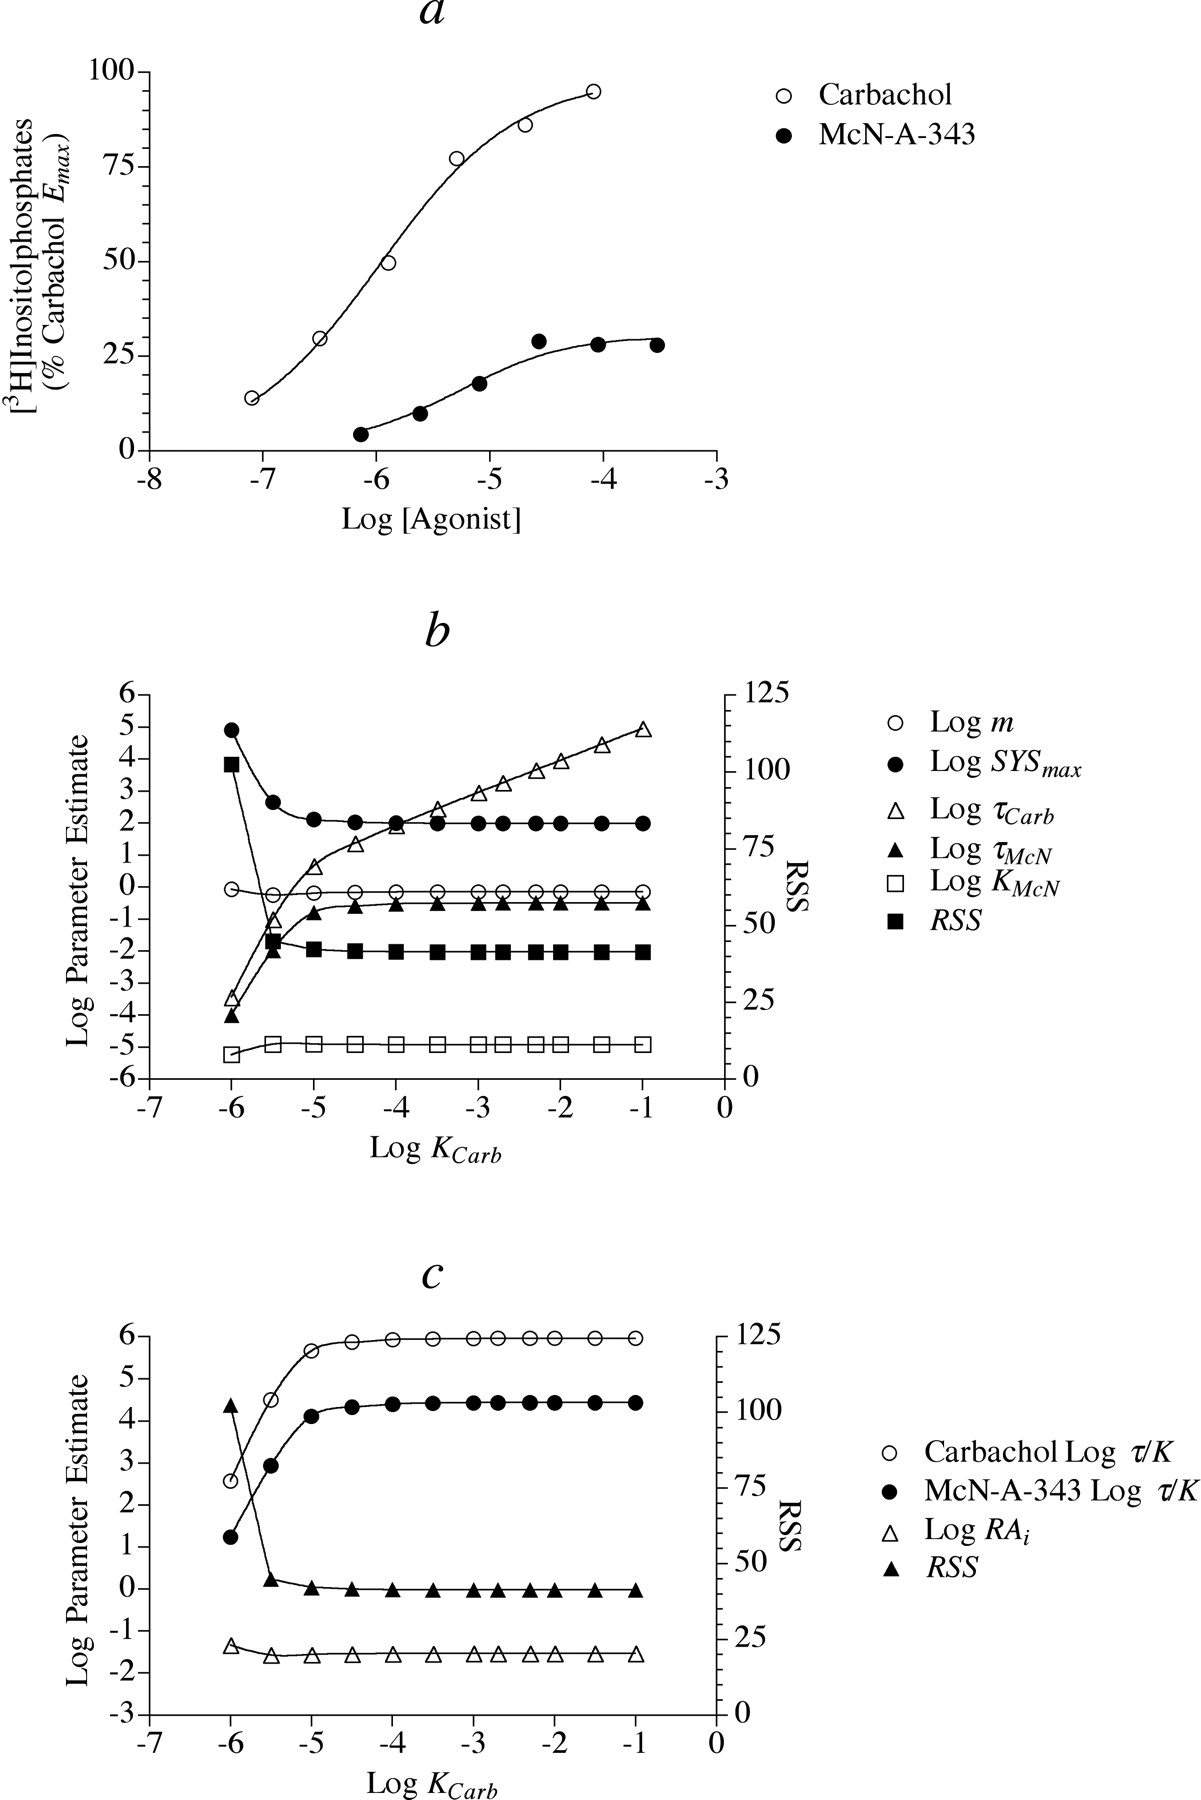
Use of the operational model to estimate the RAi value of McN-A-343 relative to carbachol in experiments on HEK Gα15 M2 cells. a, the average concentration-response curves to carbachol and McN-A-343 are shown. The theoretical curve represents the best fit of eq. 11 to the data. b, summary of nonlinear regression analysis for the plot in a. The value of KA was constrained as a constant over the range of values shown on the abscissa, and the values of m, Msys, τcarb, τMcN, and KMcN that yielded the least-squares fit to the data were estimated by regression analysis. The ordinate for RSS is on the right. c, same as b except that the ratio of τ/K and the estimate of RAi are plotted against the constant Kcarb.
Comparison of the data in Tables 1 and 3 shows that whereas the RAi values of oxotremorine-M, carbachol, S-aceclidine, and R-aceclidine are similar, the value for McN-A-343 is ∼10-fold greater in HEK Gα15 M2 cells relative to that measured in CHO M2 cells. This increase in the RAi value of McN-A-343 was associated with an average 4.5-fold increase in observed affinity (decrease in dissociation constant), indicating a small increase in observed intrinsic efficacy (∼2-fold) as well. To verify that this difference can be attributed to different G proteins and not to the cells in which the M2 receptor was expressed, we investigated M2 receptor-mediated inhibition of isoproterenol-stimulated cAMP accumulation in HEK T cells stably expressing the human M2 muscarinic receptor (HEK T M2). Figure 5b shows the results of these experiments using carbachol and McN-A-343 as agonists. The results of these experiments are summarized in Table 4 where it can be seen that the RAi value of McN-A-343 is similar to that measured in CHO M2 cells but only ∼1/10 that measured in HEK Gα15 M2 cells. These results suggest that McN-A-343 preferentially directs signaling of the M2 receptor through Gα15 relative to Gi.
Agonist activity for inhibiting isoproterenol-stimulated cAMP accumulation in HEK T M2 cells The data are from Fig. 2a. The data represent the mean estimates ± S.E.M. The values in parentheses beside some of the estimates are the log means ± S.E.M.

Muscarinic agonist mediated inhibition of forskolin (10 μM) stimulated cAMP accumulation in CHO M2 (a) and isoproterenol (1 μM) stimulated cAMP accumulation in HEK M2 (b) cells. The data represent the means ± S.E.M. of four to six experiments.
Agonist-Mediated Enhancement of Forskolin-Stimulated cAMP Accumulation. Michal et al. (2001) have shown that the M2 receptor has biphasic effects on cAMP accumulation in CHO cells when forskolin is present. At low concentrations, muscarinic agonists cause a potent inhibition of cAMP accumulation, whereas at high concentrations, an enhancement of cAMP accumulation occurs. The inhibitory effect is mediated via Gi and is prevented by pertussis toxin treatment, whereas the stimulatory effect is mediated by Gs (Michal et al., 2001, 2007). After pertussis toxin treatment, only the less potent stimulatory phase is observed. Consequently we measured agonist concentration-response curves for stimulating cAMP accumulation in the presence of forskolin (10 μM) in CHO M2 cells that had been previously treated with pertussis toxin to prevent Gi-mediated inhibition of adenylyl cyclase (Fig. 6a). Carbachol, oxotremorine-M, and S-aceclidine all exhibited a similar shaped sigmoid concentration-response curves with similar Emax values, whereas R-aceclidine exhibited a bell-shaped curve with a lower maximum. McN-A-343 actually caused a concentration-dependent inhibition of cAMP accumulation. Because both McN-A-343 and R-aceclidine inhibited cAMP accumulation at high concentrations, we measured their effects on forskolin-stimulated cAMP accumulation in CHO cells that had not been transfected with the M2 muscarinic receptor (Fig. 6b). Both agonists caused a concentration-dependent inhibition of forskolin-stimulated cAMP accumulation in untransfected CHO cells, suggesting that the compounds interfere with adenylyl cyclase through a nonmuscarinic receptor mechanism at high concentrations. In contrast, carbachol had no such effect. Thus, in analyzing the concentration-response curve to R-aceclidine, we only used the data over the log molar concentration range of -5 to -3.5 R-aceclidine. The estimates of the RAi values of carbachol, oxotremorine-M, S-aceclidine, and R-aceclidine for stimulation of cAMP accumulation were calculated using the three different methods, and these estimates are listed in Table 4. There is agreement among the three different estimates for a given agonist. Also the RAi values estimated for stimulation of cAMP accumulation agree generally with those estimated in the other assays.

Effects of muscarinic agonists on forskolin (10 μM) stimulated cAMP accumulation in CHO M2 (a) and CHO (b) cells treated with pertussis toxin. The data represent the means ± S.E.M. of four to six experiments.
Analysis of the Loss of Activity of McN-A-343 in Stimulating cAMP Accumulation. The lack of effect of McN-A-343 in enhancing forskolin-stimulated cAMP accumulation in CHO M2 cells treated with pertussis toxin may indicate that the RAi value of McN-A-343 in this assay is less than that observed in the two other assays. Alternatively, it may be that this response is so insensitive that the relatively weak activity of McN-A-343 at the M2 receptor simply does not register in this assay even though its RAi value may be similar to those observed in the other assays. To discriminate between these two possibilities we determined the loss in sensitivity to carbachol that occurs when stimulation of cAMP accumulation (CHO M2 Gs assay) is measured instead of inhibition of cAMP accumulation (CHO M2 Gi assay), and determined whether an equivalent loss in sensitivity could eliminate the response to McN-A-343 in the CHO M2 Gs assay, assuming no change in its RAi value. Figure 7a shows that the concentration-response curve of carbachol in the CHO M2 Gs assay is shifted to the right 26-fold compared with that for the CHO M2 Gi assay. From the perspective of the operational model, this loss in sensitivity can be attributed to a reduction in τ to a value only 3.9% of that measured in the CHO M2 Gi assay. If we apply the same loss in sensitivity to the concentration-response curve of McN-A-343 in the CHO M2 Gi assay, the resulting curve only reaches an Emax of 1.7% as shown in Fig. 8a by the theoretical curve for McN-A-343 in the CHO M2 Gs assay. This level of stimulation would have been impossible to detect, given the nonspecific inhibitory effect of McN-A-343 on cAMP accumulation. The apparent reduction in the τ value of carbachol between the two assays can be estimated in the same manner that one estimates RAi, except that in this instance, we are estimating the activity of carbachol in the CHO M2 Gs assay relative to its activity in the CHO M2 Gi assay. Because carbachol behaves as a full agonist in both assays, its τ value in the CHO M2 Gs assay relative to that of the CHO M2 Gi assay is simply equivalent to the ratio of its EC50 value in the Gi assay expressed relative to that for the Gs assay. We also carried out a similar type of analysis for the loss in sensitivity to carbachol in the CHO M2 Gs assay compared with the HEK Gα15 M2 assay (Fig. 8b). In the latter case, the loss in sensitivity to carbachol corresponded to a reduction in τ of 77%, and this change nearly, but not completely, eliminated the theoretical response to McN-A343 in the CHO M2 Gs assay, assuming no change in RAi between the two assays. The Emax of the theoretical response was 7%, and this level of stimulation would have been difficult to detect given the small nonspecific inhibitory effects of McN-A-343 over the same concentration range. Thus, we conclude that the decreased sensitivity of the CHO M2 Gs assay can account for the loss in the response to McN-A-343, and it is impossible to tell from the data whether the actual RAi value of McN-A-343 in the CHO M2 Gs assay is any less than those observed in the HEK Gα15 M2 and CHO M2 Gi assays.
Discussion
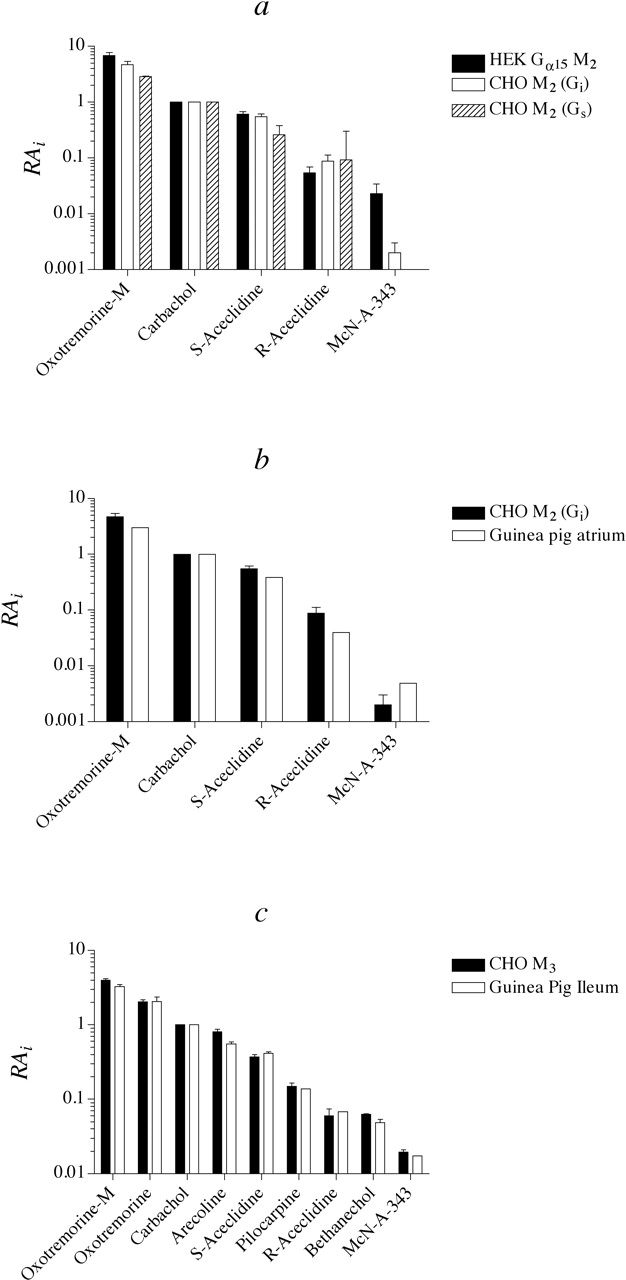
We have described a method for estimating the product of observed affinity and intrinsic efficacy of an agonist for a receptor expressed relative to that of another using only a single concentration-response curve for each agonist. This measure (RAi) provides a means of converting EC50 and Emax values into a single estimate, enabling one to compare the activity of an agonist across different assays, regardless of whether the agonist behaves as a full or partial agonist. Our results show that carbachol, oxotremorine-M, and the enantiomers of aceclidine have similar activity across the different M2 assays, whereas McN-A-343 exhibits ∼10-fold greater activity at the M2 receptor signaling through Gα15 compared with Gi (Fig. 8a). This ability of McN-A-343 to select for M2-Gα15 responses is important in drug screening because Gα15 is often used to transduce signals through GPCRs.
If an agonist induces or selects a receptor conformation that preferentially interacts with G15, then the agonist should exhibit a larger RAi value for eliciting G15 responses relative to a standard agonist that lacks this selectivity. Presumably, this phenomenon explains the selectivity of McN-A-343 for G15 responses relative to Gi responses. This selectivity for G15 responses should be manifest when the agonist is assayed in different cells, each expressing a single G protein (e.g., G15 or Gi). If both G proteins are expressed within the same cell and the receptor is in a dynamic equilibrium with both, then the RAi value of an agonist for responses mediated through either G protein should be the same and equal to a weighted average of those observed in different cells (Leff et al., 1997). Bearing this hypothesis in mind, we treated HEK Gα15 M2 cells with pertussis toxin to prevent M2 receptor signaling through Gi when Gα15 responses in HEK Gα15 M2 cells were measured so that our RAi estimate would reflect only the M2-Gα15 interaction. Nevertheless we also performed the same experiments without pertussis toxin treatment and observed essentially the same results for McN-A-343 and the other agonists (data not shown). Perhaps the selectivity of the McN-A-343-M2 receptor complex for G15 is so great that Gi does not compete effectively and causes little perturbation of the M2 receptor-G15 interaction. Alternatively, these findings may suggest that different pools of M2 receptors are dedicated to either G15 or Gi and that the M2 receptor is not in equilibrium with both G proteins at the same time in HEK Gα15 M2 cells. We speculate that this compartmentalization might be maintained by scaffolding or accessory proteins as established for other systems (Ostrom et al., 2000).

Estimation of the theoretical concentration-response curve to McN-A-343 for enhancement of forskolin stimulated cAMP accumulation in pertussis toxin treated CHO M2 cells. The theoretical curves were generated assuming that the observed affinity and intrinsic efficacy of McN-A-343 were that same as that for inhibition of cAMP accumulation (a) or stimulation of phosphoinositide hydrolysis (b). a, the theoretical concentration-response curve to McN-A-343 for enhancement of cAMP accumulation was estimated, assuming that its reduced sensitivity for stimulating relative to inhibiting cAMP accumulation was the same as that observed for carbachol. b: The theoretical concentration-response curve to McN-A-343 for enhancement of cAMP accumulation was estimated, assuming that its reduced sensitivity for stimulating cAMP accumulation relative to stimulating inositol phosphate accumulation was the same as that observed for carbachol. Further details are given under Results. The experimental data for McN-A-343 and carbachol are from Figs. 2, 5, and 6.

Comparison of the RAi values of muscarinic agonists for eliciting different responses through M2 (a and b) and M3 (c) muscarinic receptors. a, the RAi values of muscarinic agonists for eliciting responses through the M2 receptor coupled to Gα15,Gi, and Gs are shown. The data are from Tables 1, 3, and 5 and represent the mean values calculated using the null method and the operational model, except for the values of the full agonists in Table 3, which were calculated using eq. 13. b, the RAi values of muscarinic agonists for inhibiting cAMP accumulation in CHO M2 cells and for inhibiting the electrically driven guinea pig left atrium are shown. The values for carbachol, the enantiomers of aceclidine and McN-A-343 were calculated using eq. 13 and the EC50 and Emax values published by Eltze et al. (1993) for the isolated atrium. Another estimate for McN-A-343 in the atrium was calculated from the data of Christopolous and Mitchelson (1997) by regression analysis using eq. 11, and this estimate was averaged with that from Eltze et al. (1993). The RAi value for oxotremorine-M was estimated from the data of Barocelli et al. (2000) and was first calculated relative to oxotremorine using eq. 13 and then expressed relative to carbachol using the data of Eltze et al. (1993). c, the RAi values of muscarinic agonists for eliciting phosphoinositide hydrolysis in CHO M3 cells and contraction of the guinea pig ileum are shown. The latter data are from Ehlert et al. (1999).
Agonist activity for enhancing forskolin-stimulated cAMP accumulation in pertussis toxin-treated CHO M2 cells The data are from Fig. 2a. The data represent the mean estimates ± S.E.M. The values in parentheses beside some of the estimates are the log means ± S.E.M.
It is possible that the M2 receptor-mediated enhancement in forskolin-stimulated cAMP accumulation has little physiological relevance. We found that muscarinic agonists cause little or no increase in cAMP accumulation in pertussis toxin-treated CHO cells unless forskolin is present. Presumably, forskolin enhances the weak activation of Gs by muscarinic agonists in CHO cells so that a substantial activation of adenylyl cyclase can be measured in cells treated with pertussis toxin. It has been shown that type VI adenylyl cyclase is abundantly expressed in CHO cells (Varga et al., 1998) and that this isozyme exhibits synergistic interactions between forskolin and Gs (Sutkowski et al., 1994). Thus, although the M2 receptor-Gs interaction may be too weak to subserve a physiological role, it nonetheless provides an interesting opportunity to test whether the nature of the G protein with which the receptor interacts influences agonist activity.
The RAi values that we reported for muscarinic agonists in the CHO M2 Gi assay are consistent with the activity of these agonists reported in the electrically driven guinea pig left atrium (Fig. 8b). This preparation is a standard assay for the M2 muscarinic receptor signaling through a Gi mechanism. We estimated the RAi values of the agonists in this preparation from published reports of the EC50 and Emax values (Eltze et al., 1993; Barocelli et al., 2000) using eq. 13 and also using regression analysis (eq. 11) of the concentration-response curves for carbachol and McN-A-343 published by Christopolous and Mitchelson, 1997). The good agreement between the two sets of data illustrate the usefulness of the RAi estimate in predicting agonist activity at the same receptor-G protein signaling mechanisms across different assays.
One way to appreciate the significance of RAi is to consider a series of agonists in a hypothetical, highly sensitive assay in which the agonists would behave as full agonists, even those with little intrinsic efficacy. In this situation, the RAi values would be equivalent to the ratio of EC50 values of the agonists expressed relative to a standard agonist. To illustrate this point, we show a comparison of the RAi values of muscarinic agonists for stimulating contractions in the guinea pig ileum with those for stimulating phosphoinositide hydrolysis in CHO cells transfected with the human M3 receptor (Fig. 8c). In the former assay, most of the agonists behave as full agonists, whereas in the latter, most behaved as partial agonists (Ehlert et al., 1999). There is exceptional agreement in the RAi values of agonists across these two M3 receptor-Gq responses.
An interesting property of RAi is related to the initial slope of the agonist concentration-response curve. By taking the first derivative (dy/dX) of the operational model (eq. 11) with respect to the agonist concentration (X) and evaluating its limit as the agonist concentration approaches 0, it is possible to estimate the initial slope of an agonist concentration-response curve. If the initial slope for agonist B is divided by that of a standard agonist A, the result is RA mi, where which m denotes the transducer slope factor in the operational model:  in which
  In these equations, X denotes the concentration of agonist with subscripts for test agonist (B) and standard agonist (A). Thus, when considered from this perspective, the RA mi is a relative measure of the sensitivity of receptor-G protein complexes for different agonists. The initial slope of the plot of output against signal intensity is a common means of expressing the sensitivity of a transducer in electronics and engineering.
GPCRs are unique in that observed affinity is influenced by the concentration of guanine nucleotide in the cytosol, particularly for Gi and Gs linked receptors. As the concentration of GTP and GDP increases, observed affinity decreases. This change in affinity occurs with a corresponding opposite change in intrinsic efficacy such that the product of observed affinity and intrinsic efficacy remains constant (Ehlert and Rathbun, 1990; Ehlert, 2000). Consequently the RAi estimate is unperturbed by changes in the guanine nucleotide concentration, making it an ideal measurement of activity in cells with different concentrations of GTP or in broken cell assays in which the guanine nucleotide concentration is manipulated [e.g., agonist stimulated guanosine 5′-O-(3-[35S]thio)triphosphate binding].
Although the regression methods that we used for estimating RAi values using the null method (eq. 8) and the operational model (eq. 11) may seem complicated, a computer algorithm can be written to make these calculations automatic, like the estimation of EC50 and Emax. We think that the RAi estimate has widespread application in comparing agonist activity across different assay systems and in detecting agonist-directed signaling. Analogous types of calculations can be used to analyze allosterism (Ehlert, 2005), site-directed mutagenesis (Ehlert, 2000) and the loss of function in knockout mice when more than one receptor contributes to the function (Tran et al., 2006).
APPENDIX
Theoretical Basis for the Estimation of RAi. This section describes the theoretical basis for the equations used to estimate the RAi values of agonists. Our method for the estimation of RAi is based on a further development of our previous methods (Ehlert et al., 1999; Ehlert and Griffin, 2001). In our analysis we assume that the amount of receptor activation to agonist X is proportional to the stimulus as defined by Furchgott (1966):  in which ϵX denotes the intrinsic efficacy of X, RT denotes the concentration of functional receptors, and KX denotes the equilibrium constant. The response to agonist X can be represented as a function (f) of the stimulus:
  Below, three different approaches for estimating the RAi value of an agonist relative to a standard agonist are described. The first involves eliminating the stimulus-response function from the analysis through the use of a null method. The second involves the use of the operational model to describe the stimulus-response function, and the third involves a special case of the operational model in which the Hill slope of the concentration-response curve equals 1.
Null Method. One approach to estimation of RAi is to compare equivalent tissue responses to the two agonists so that the unknown relationship between the stimulus and response (f) is eliminated. By using this approach, the relationship describing equivalent tissue responses to agonist B and standard agonist A is given by  in which Ai and Bi denote the equiactive concentrations of agonists A and B, respectively. This equation simplifies to
  in which
 As described under Materials and Methods (eq. 13), the RAi value can be estimated from the ratio q/p.
Operational Model. Although the null method just described has the advantage of being applicable for any type of stimulus-response function (i.e., any shape of concentration-response curve), it is widely observed that agonists usually exhibit logistic concentration-response curves. Indeed, a curve-fitting procedure based on the following logistic equation is the most common computational method that investigators use to estimate the Emax and EC50:  in which n denotes the Hill slope. Several investigators have shown that if the input to the stimulus-response function (f) is the stimulus (i.e., product of receptor occupancy and intrinsic efficacy) and the output obeys the logistic function just described, then the stimulus-response function must be the following (Furchgott, 1966; Mackay, 1981; Kenakin and Beek, 1982; Black and Leff, 1983):
  in which Msys denotes the maximum response of the system, KE denotes the sensitivity of the stimulus-response function, and m denotes the transducer slope factor. This exponent is related to, but not identical to, the Hill slope of the agonist concentration-response curve. Substitution of eq. 16 for S in eq. 23 above followed by simplification yields
  in which
  As described under Materials and Methods, the RAi value of an agonist can be estimated from the KX and τX values of the agonist (see eq. 12).
In situations in which the transducer slope factor m in eq. 24 equals 1, the Hill slope of eq. 22 is also equal to 1 (n = 1), and eq. 24 reduces to  in which
 If eq. 25 is substituted into eqs. eq. 27 and eq. 28 for τX and then the resulting equations are substituted in for the Emax and EC50 values in eq. 13 under Materials and Methods, it can be shown that eq. 13 equals eq. 4. Thus, if the Hill slopes are equal to 1, it is possible to estimate the RAi value of agonists from the Emax and EC50 values.
Initial Parameter Estimates for Nonlinear Regression Analysis. We used the Solver function in Excel (Microsoft Office, 2004) to obtain the least-squares fit to eqs. 8 and 11 when RAi was estimated by the null method and operational model, respectively. The approach is analogous to that described by Christopoulos and Mitchelson (1998), but the regression equations are changed appropriately for our analysis. This regression analysis requires initial parameter estimates, and below we describe a means to calculate these when analyzing a partial agonist (B) with a standard full agonist (A). For the null method, the value of KA is fixed to an arbitrarily high value (e.g., log molar KA = -1) and the initial estimates of p and q (p′ and q′, respectively) are estimated as follows: 
 In eqs. 29 and 30, KA denotes the arbitrarily high value to which KA is set as a constant for the regression analysis. For the operational model, the following initial parameter estimates for τA, τB, KB, m, and Msys (τA′, τB′, KB′, m′ and Msys′, respectively) are used in situations in which the standard agonist was a full agonist:


 In eq. 31, KA denotes the arbitrarily high value to which KA is set as a constant for the regression analysis.
Acknowledgments
We thank Drs. Olivier Civelli and Hans-Peter Nothacker, Department of Pharmacology, University of California, Irvine, for providing us with HEK 293T cells stably transfected with Gα15.
Footnotes
-
↵1 Here and throughout the article, we use the term “observed intrinsic efficacy” to refer to Furchgott's definition of “intrinsic efficacy” (Furchgott, 1966), which denotes the amount of activated receptors. As described previously (Ehlert, 2000), it is useful to discriminate between the latter definition of observed intrinsic efficacy and the ratio of agonist affinity constants for ground and active conformations of the receptor (intrinsic efficacy).
-
This work was supported by National Institutes of Health Grant GM 69829 (to F.J.E.).
-
Article, publication date, and citation information can be found at http://jpet.aspetjournals.org.
-
doi:10.1124/jpet.107.120857.
-
ABBREVIATIONS: GPCR, G protein-coupled receptor; McN-A-343, 4-[[N-[3-chlorophenyl]carbamoy]oxy-2-butynyl]trimethylammonium chloride; CHO, Chinese hamster ovary; DMEM, Dulbecco's modified Eagle's medium with high glucose and l-glutamine; KRB, Krebs-Ringer bicarbonate; 4-DAMP mustard, N-2-chloroethyl-4-piperidinyldiphenylacetate; AF-DX 116, 11-[[2-[(diethylamino)methyl]-1-piperidinyl]acetyl]-5,11-dihydro-6H-pyrido[2,3-b][1,4]benzodiazepine-6-one; RSS, residual sum of squares.
- Received January 31, 2007.
- Accepted March 26, 2007.
- The American Society for Pharmacology and Experimental Therapeutics


