

Abstract
Presynaptic action potential-independent transmitter release is a potential means of information transfer across synapses. We show that in the hippocampal mossy fiber boutons, activation of the α7-subtype of nicotinic acetylcholine receptors (α7-nAChRs) results in a large increase in the amplitude of spontaneous events, resulting from concerted release of multiple quanta from the mossy fiber boutons. This amplitude increase is abolished at low temperatures. Activation of α7-nAChRs causes a rise in intraterminal calcium at mossy fiber boutons, involving ryanodine receptors. Regulation of concerted release requires the subsequent activation of presynaptic calcium/calmodulin-dependent protein kinase II (CaMKII). Activation of CaMKII is required to drive presynaptic action potential-independent transmission at the mossy fiber–CA3 pyramidal cell synapse. The effects of α7-nAChR activation are mediated by biologically relevant doses of nicotine. Our results demonstrate a novel form of synaptic plasticity mediated by presynaptic α7-nAChRs and store calcium that is temporally different and might respond to a different history of synaptic activity than that mediated by incoming action potentials.
- nicotine
- addiction
- synaptic plasticity
- synaptic vesicle release
- acetylcholine receptor
- synaptic communication
- multivesicular
- mEPSCs
Introduction
Most studies on synaptic plasticity describe events triggered by incoming presynaptic action potentials (APs). The random nature of spontaneously occurring miniature excitatory and inhibitory currents (mEPSCs and mIPSCs) has resulted in the assumption that these events might be inconsequential. However, studies demonstrating that neurotransmitters alter postsynaptic excitability (Sharma and Vijayaraghavan, 2003; Shigetomi and Kato, 2004) and potentially shape neuronal development (Murphy et al., 1994; Saitoe et al., 2001; Sutton et al., 2004) have justified a re-examination of the role of mEPSCs in modulating synaptic strength.
Previous studies suggest that small, subthreshold depolarizations can travel large distances down axons, and can serve as analog modulators of AP-driven transmitter release (Alle and Geiger, 2006). In addition, local modulation of release at synaptic terminals can result in postsynaptic firing both in small (Shigetomi and Kato, 2004) as well as complex (Sharma and Vijayaraghavan, 2003) terminals.
Several interesting features of spontaneous transmitter release have been reported. mEPSC and mIPSC amplitudes are modulated by store calcium (Llano et al., 2000; Sharma and Vijayaraghavan, 2003; Collin et al., 2005; Gordon and Bains, 2005). These studies suggest that calcium sources, other than voltage-gated calcium channels (VGCCs), might have an important role in regulating synaptic strength.
Activation of nicotinic acetylcholine receptors (nAChRs) containing the α7 subunit (α7-nAChRs) causes calcium-induced calcium release from endoplasmic reticulum (ER) stores, leading to increased release of glutamate from hippocampal mossy fiber boutons (MFBs). This modulation involves the generation of large-amplitude mEPSCs, and is sufficient to drive the postsynaptic neuron above threshold (Sharma and Vijayaraghavan, 2003). Thus, mEPSC-mediated modulation, might represent a form of plasticity distinct from AP-driven mechanisms in the CNS (Sharma and Vijayaraghavan, 2003).
One way of increasing synaptic strength and the fidelity of transmission is by the release of multiple quanta closely spaced in time. Multivesicular release (MVR; the synchronized release of multiple quanta from a single active zone) and concerted univesicular release across active zones are potential means of altering synaptic strength. MVR has been demonstrated in a number of systems (Tong and Jahr, 1994; Wall and Usowicz, 1998; Wadiche and Jahr, 2001; Christie and Jahr, 2006; Foster et al., 2005), suggesting that many synapses might employ this process to alter synaptic strength.
Mechanisms underlying concerted release of multiple quanta, however, remain unknown. In their simplest forms, MVR can be thought of as resulting from increased probability of release (PR). The findings that MVR occurs at both high-PR and low-PR sites (Auger et al., 1998; Wadiche and Jahr, 2001; Oertner et al., 2002; Christie and Jahr, 2006), as well as the existence of only univesicular release at other CNS synapses (Silver et al., 2003), raise the possibility that concerted release of multiple quanta might require the activation of specific signaling pathways.
A number of questions remain unanswered regarding the mechanisms and biological relevance of nAChR-mediated concerted release of multiple quanta. In this study we show that the large-amplitude mEPSCs arise from presynaptic summation of smaller release events caused by increases in intracellular calcium concentration ([Ca]i) after activation of α7-nAChRs on MFBs. This synchrony arises downstream of ER calcium release and requires the activation of calcium/calmodulin-dependent protein kinase II (CaMKII). Concerted release of glutamate can be mediated by biologically relevant doses of nicotine at these synapses suggesting that the mechanism might play a significant role in synaptic plasticity during drug addiction.
Our data indicate a presynaptic AP-independent form of short-term plasticity at the mossy fiber synapses driven by nAChRs.
Materials and Methods
Transverse hippocampal slices (300 μm thick) were prepared from 12- to 16-d-old Sprague Dawley rats using a Leica (Nussloch, Germany) VT1000S Vibratome, or DTK-zero 1 (Dosaka, Kyoto, Japan), in accordance with institutional guidelines (Sharma and Vijayaraghavan, 2003). Slices were then incubated in a bicarbonate based medium [artificial CSF (ACSF)] containing (in mm) 120 NaCl, 3.5 KCl, 26 NaHCO3, 1.25 NaH2PO4, 10 glucose, 2.5 MgCl2, and 1 CaCl2, for at least an hour before the experiment.
Electrophysiological recordings.
Recording conditions were the same as described previously (Sharma and Vijayaraghavan, 2003). Briefly, all recordings were performed at room-temperature (21–23°C), except where noted, using a Zeiss (Oberkochen, Germany)Axioskop FS microscope. Slices were continuously perfused with bubbled ACSF containing 2.5 mm CaCl2, 1 mm MgCl2, 1 μm tetrodotoxin (TTX), and 50 μm picrotoxin or 10 μm gabazine. Signals were recorded with an Axopatch 200B patch amplifier (Molecular Devices, Sunnyvale, CA) using pClamp 9. Whole-cell voltage-clamp and current-clamp recordings were performed on pyramidal cells in the CA3 region of the hippocampus, using patch pipettes with a resistance of 3–6 MΩ. Internal solution, pH 7.2 (290 mOsm), contained (in mm) 130 K-gluconate, 5 KCl, 10 EGTA (or 10 BAPTA), 10 HEPES, 2 ATP (magnesium salt), and 0.2 GTP (sodium salt). Data were filtered at 2 kHz and collected every 100 μs for a stretch of 2 min at a time. Access resistance was monitored at the beginning and end of each 2 min period. Data were discarded if it varied >20% over the course of the experiment. Holding potential was −60 mV. Current-clamp experiments were done in I = 0 mode using an Axopatch 200B amplifier (Molecular Devices). For these experiments, neither TTX nor GABAR blockers were included in the ACSF.
Data analyses.
Events were detected using MiniAnalysis 6.0 software (Synaptosoft, Decatur, GA). The average baseline noise (IRMS) was 1.94 ± 0.07 pA (n = 6 cells). Events were detected and accepted for analyses using criteria based on threshold amplitude, area under the curve, and time to peak (Sharma and Vijayaraghavan, 2003). A detected mEPSC had to meet all three criteria to be taken for analyses. When the rise of an event occurred during the falling phase of a previous event (as during a burst), the baseline was estimated by the software by extrapolating the decay of the first peak using a first order exponential function. Each event was visually examined to protect against software errors. Further analysis was done using Origin software (Microcal, Northampton, MA).
All amplitudes were binned at 4 pA and frequency at 1 s or as described in the text. Average data are presented as mean ± SEM. Kinetics of the AMPA and kainate (KA) components were determined from 10–30 digitally averaged traces. All rise times were calculated over 10–90% of peak and expressed as such. The decay times listed in this study are decay time constants (τ), obtained from a single exponential fit using the Origin software. Charge transfer was calculated by measuring the area under the averaged traces.
All distributions were compared for statistical significance using the nonparametric Kolmogorov–Smirnov test. Means were compared using paired or unpaired Student's t test. All significance values provided are two-tailed p values.
Calcium imaging.
Slices were loaded with Fura 2-AM using one of two protocols. The first protocol was modified from a previously published protocol (Regehr and Atluri, 1995). Briefly, a 1 mm solution of Fura 2-AM was made in DMSO containing 20% pluronic acid. This was then diluted 100-fold in ACSF. The dye was filled in a patch pipette. The pipette was lowered till it touched the stratum lucidum, perpendicular to the orientation of mossy fibers. The dye was then pressure injected for 30–45 min. The slices were allowed to recover for 1–2 h during which time the dye diffused down the axons. Imaging sites were selected 100–200 μm away from the injection site. In the second protocol, slices were incubated in 20 μm Fura 2-AM in 0.2% pluronic acid for an hour at RT and allowed to recover a further hour. Both protocols gave adequate labeling of MFBs. In a few experiments, the tip of a patch pipette was smeared with Dye I paste (NeuroTrace; Invitrogen, Carlsbad, CA) and placed at the granule cell layer. The slices were then incubated for 1–2 h at 35°C, followed by Fura 2-AM loading at room temperature. Terminals that were double labeled were positively identified as MFBs.
Imaging was performed using a Zeiss Axioskop-2 upright microscope using a water-immersion 40× lens (numerical aperture, 0.8). Images were acquired using a cooled CCD camera (Cooke Sensicam; PCO, Kelheim, Germany). Excitation was achieved using a Sutter Instruments (Novato, CA) DG-4 fast wavelength switcher and standard Fura 2 excitation and emission filters were used (Chroma Technology, Brattleboro, VT). Images were acquired and processed using the SlideBook software (Intelligent Imaging Innovations, Denver, CO). Ratiometric data were acquired at 0.1–1 Hz. Analyzed data were graphed using the Microcal Origin software. Calcium signals were expressed as changes in the 340/380 ratio.
Agonist was applied using pressure application via a patch pipette placed ∼20 μm above the slice. Unless otherwise stated, agonist was applied for 30 s.
Materials.
N-[2-[[[3-(4-chlorophenyl)-2-propenyl]methylamino]methyl]phenyl]-N-(2-hydroxyethyl)-4-methoxybenzenesulfonamide (KN-93) and 2-[N-(4′-methoxybenzenesulfonyl)]amino-N-(4′-chlorophenyl)-2-propenyl-N-methylbenzylamine phosphate (KN-92), and TTX were from EMD Biosciences (San Diego, CA). All other chemicals were obtained from either Sigma (St. Louis, MO) or Tocris Bioscience (Ellisville, MO). Dye I and Fura-2 AM were from Invitrogen.
Results
We have shown previously (Sharma and Vijayaraghavan, 2003) that application of 20 μm nicotine causes a burst of high-frequency mEPSCs recorded from CA3 pyramidal cells from 11- to 16-d-old rat hippocampal slices. In addition, there is a significant rightward shift in mEPSC amplitude distribution as shown in Figure 1A. The amplitude increase is coincident with the onset of the mEPSC frequency change (Fig. 1B).

nAChR activation mediates burst of mEPSCs. A, Left, Current trace showing mEPSCs. A 120 s application of 20 μm nicotine (at the red arrow) causes a delayed burst of mEPSCs. Right, The amplitude distribution shows a pronounced rightward shift of the entire distribution (green bars; p < 0.0001) compared with control (red bars). B, The onset of the amplitude shift coincides with the onset of the high-frequency burst. Left, Cumulative probability distribution under control conditions (black trace), in the intervening period between nicotine application and the onset of the burst (red trace), and during the burst (green traces). Right, Mean amplitudes from six cells. The mean amplitudes during the preburst period were not significantly different from that of controls (p = 0.98), whereas during the burst, the mean amplitudes were significantly larger compared with the preburst period (**p < 0.01). C, Amplitude increase outlasts the frequency change. Left, Frequency response to the application of 20 μm nicotine (period given by the red trace) followed by two periods of drug washout (blue and green). Nicotine causes a burst of high frequency that returns close to baseline after washout of the drug. Right, Cumulative probability distribution of amplitudes showing a distinct rightward shift (color codes same as for the left panel). The amplitude distribution is still shifted during the second wash period (green; p < 0.0001 compared with control). D, The same experiment using 100 μm ACh/At. Left, Frequency change before (black trace), during (red trace), and after wash (blue and green traces). Right, Cumulative probability distribution of amplitudes (same color code) showing the long-lasting rightward shift in distribution after a prolonged washout of the drug (p < 0.0001 compared with controls).
nAChR activation results in a long-lasting change in mEPSC amplitudes
A key feature of the nAChR effects on mossy fiber mEPSCs is that the amplitude increases outlast the increase in frequency (Fig. 1C,D). In the cell shown in Figure 1C, whereas the frequency of the mEPSCs, after application of 20 μm nicotine, returned close to baseline frequencies, the cumulative probability distribution of amplitudes remains significantly shifted to the right even 2–4 min after cessation of agonist application (p < 0.0001, compared with control) (Fig. 1C). This effect is mimicked by 100 μm ACh in the presence of 0.5 μm atropine (ACh/At) (Fig. 1D). At 4–6 min after washout of the agonist, the amplitude distribution was still shifted to the right (p < 0.0001 compared with controls). During the wash period, the mean amplitude of the mEPSCs, from a number of experiments, was still elevated compared with the control (44 ± 6.6 pA vs 21.4 ± 2.6 pA; n = 12 cells; p < 0.005, paired t test), although, on average, it was 79% of that seen during the mEPSC burst after agonist application (p < 0.01, paired t test). The duration of the high-frequency burst, defined as the period from onset to where the frequency falls below twice the peak control frequency, was 52 ± 10 s (Sharma and Vijayaraghavan, 2003). The amplitudes remained significantly elevated over control at p < 0.05 for 7.4 ± 1 min (from12 cells; range 4–10 min) after cessation of agonist application. The minimum concentrations of ACh/At required to elicit the mEPSC burst lay between 10 and 100 μm (data not shown). As both nicotine and ACh/At had the same effects on mEPSC frequencies and amplitudes, the two agonists were used interchangeably in this study.
The dissociation of amplitude and frequency motivated a further examination of the underlying mechanisms for regulating mEPSC amplitudes.
nAChR-mediated amplitude changes involve both AMPA and kainate receptors
In the presence of 10 μm CNQX and 50 μm APV no events were seen confirming their glutamatergic nature (Sharma and Vijayaraghavan, 2003). nAChR-induced burst of mEPSCs were not elicited when the agonist was applied outside stratum lucidum, in the stratum radiatum consistent with the events being mossy fiber in origin (data not shown).
As inhibition of release by the mGluR type II agonist (2S,2′R,3′R)-2-(2′,3′ dicarboxycyclopropyl)glycine (DCG-IV) has been used to determine mossy fiber origins of evoked responses, we tested its effects on the α7-nAChR mediated mEPSC bursts. Slices were preincubated with 10 μm DCG IV for 10–15 min before agonist application. mEPSC bursts were still elicited with ACh/At application. The mean burst frequencies in the absence and presence of the nAChR agonist were 0.5 ± 0.18 Hz and 14.5 ± 1.4 Hz, respectively (n = 4; p < 0.002). The average peak frequency of the burst was 60 ± 11 Hz. The average mEPSC amplitude was 20 ± 1 pA in controls and 36 ± 0.37 pA with nAChR activation (p < 0.001). These data are consistent with our previous finding that VGCC blockers do not significantly affect the nAChR-induced burst (Sharma and Vijayaraghavan, 2003). DCG-IV has been shown to have a small (∼25% reduction) effect on mEPSC frequencies but not amplitudes (Kamiya and Ozawa, 1999). Such changes would not be apparent because of the inherent variation in the nAChR-induced bursts. What can be inferred from these experiments is that the DCG-IV sensitivity might not be a good indicator for the mossy fiber origin of mEPSCs.
In the absence of mGluR inhibition as a definitive criterion for determining mossy fiber origin, we took a different approach. We made use of the fact that spontaneous mossy fiber events, in addition to the AMPA component, have a significant contribution from kainate receptors (Cossart et al., 2002).
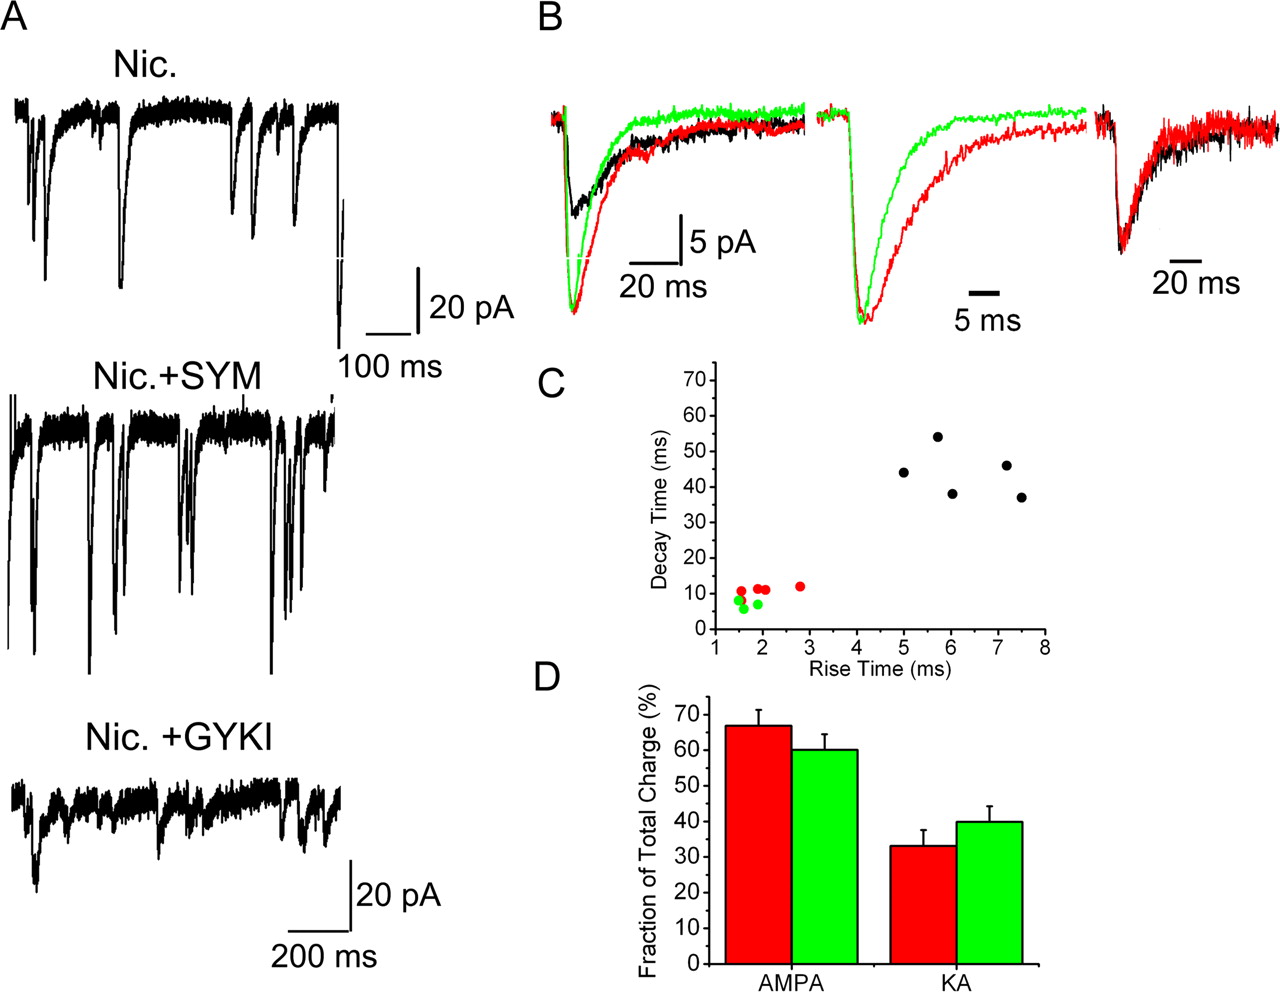
We first examined mEPSCs generated by nAChR activation in the presence of 100 μm APV plus 10 μm SYM2081 [(2S,4R)-4-methyl glutamic acid; SYM] to isolate the AMPA component. This resulted in a fast current with a rise time of 1.66 ± 0.12 ms and a mean decay time constant of 6.4 ± 0.42 ms (Fig. 2A,B) (n = 6), significantly faster than currents recorded in the presence of APV alone (Fig. 2B) (p < 0.05).

Large-amplitude mEPSCs are mossy fiber in origin. A, mEPSC burst elicited by 20 μm nicotine in the presence of 100 μm APV (Nic.; top trace), nicotine in the presence of 100 μm APV plus 10 μm SYM 2081 (Nic. + SYM; middle trace) to isolate the AMPA components, or nicotine in the presence 100 μm APV plus 50 μm GYKI 53655 to isolate the KA component (Nic. + GYKI; bottom trace). In all cases, nicotine elicited a burst of mEPSCs. B, Left, Averaged trace of mEPSCs in the presence of APV (red), in the presence of APV plus SYM (green trace), and in the presence of APV plus GYKI (black trace). In the presence of GYKI, the mEPSCs have slow rise and decay times. The slow decay overlaps with the slow component of the current in the presence of APV alone and outlasts that in the presence of APV plus SYM. Middle trace, An averaged and normalized trace from APV-treated cells in the absence (red) and the presence (green) of 10 μm SYM. The AMPA component shows a faster decay than the AMPA plus KA component. Right trace, Normalized average KA component in the presence of GYKI 53655 (black trace) or obtained by subtracting the AMPA component (current in the presence of APV plus SYM) from mEPSCs in the presence of APV alone from the same cell (red trace). The two traces had similar kinetics (Decay time constant 39 and 32 ms for the black and red traces). C, Decay time–rise time plots for three to five averaged traces for mEPSCs, in the presence of APV alone (red), APV plus SYM (green), or APV plus GYKI (black). All events were fitted with a single exponential. The KA component showed a distinct cluster toward the right corner of the graph. D, Fractional contributions of the AMPA and KA components. The KA component was derived by subtracting the current in the presence of APV plus SYM from that in the presence of APV alone obtained from the same cell. The data are from averaged traces and are grouped into small events (<25 pA; green columns) or large events (>25 pA; red columns). Traces were averaged from 30–40 individual mEPSCs/condition and the mean ± SEM from six independent measurements is plotted in the graph. The KA component makes a significant contribution to the total current. There were no significant differences in the two components between large and small mEPSCs (p = 0.3; for both groups).
Application of ACh/At in the presence of 100 μm APV plus 50 μm GYKI 53655 (GYKI), to isolate the KA component, also resulted in a pronounced increase in the frequency of slow mEPSCs with rise times of 5.97 ± 0.49 ms and decay time constants of 46 ± 5 ms (Fig. 2A,B) (n = 6).
Rise time versus decay plots showed a close clustering of the AMPA and the fast component of AMPA+KA currents. The KA component, however, formed a separate and distinct cluster, with no overlap, at the right-hand top corner of the graph (Fig. 2C). The kinetics of both AMPA and KA mEPSCs obtained by us were faster than that reported by Cossart et al. (2002), possibly because of differences in the composition of internal solutions (e.g., 1 mm EGTA vs 10 mm BAPTA). Our AMPAR kinetics are much closer to what has been reported at these synapses earlier (Jonas et al., 1993)
Subtracting averaged traces from APV alone currents from those treated with APV+SYM, derived from the same cells, resulted in a slow component that could be overlaid on averaged currents derived from APV+GYKI-treated cells (Fig. 2B) demonstrating that in the presence of APV alone, the mEPSCs had both an AMPA and a KA component.
These results suggest that the mEPSCs generated in the presence of nAChR agonists are mossy fiber in origin and not caused by activation of a different population of synapses.
We then characterized the large-amplitude mEPSCs obtained in response to nAChR activation to answer two questions: (1) are they mossy fiber in origin (i.e., do they contain a KA component) and (2) Do both components increase in the large mEPSCs?
We first divided mEPSCs into two groups: small (<25 pA) and large (>25 pA). Because the magnitude of the large events is mainly determined by the AMPA component, we averaged traces obtained in the presence of APV alone and APV plus SYM. The AMPA currents were subtracted from the total (APV alone) to generate the KA component. The charge transfer for the two components were calculated and expressed as a percentage of the total. The results are shown in Figure 2D. The KA component for both small and large mEPSCs was significant accounting for 39 ± 4.4% and 33 ± 4% of the total charge transfer for small and large mEPSCs, respectively. The two components scaled proportionally to generate the large events (p = 0.3; n = 6).
These results show that the large mEPSCs are mossy fiber in origin. Our data also suggest that these events arise from concerted neurotransmitter release rather than postsynaptic mechanisms as it is unlikely that there is a proportional insertion or modification of both receptor classes.
Low temperature dissociates nAChR-mediated frequency and amplitude changes
If the large-amplitude mEPSCs arise from concerted release, we argued that they should be slowed down, dissociated, or abolished by lowering the recording temperature, compared with room temperature (RT). Slices were bathed with cold ACSF to achieve a chamber temperature between 15 and 17°C [low temperature (LT)]. mEPSCs were recorded in the absence and presence of 100 μm ACh/At. The control mEPSC frequency was 0.36 ± 0.12 Hz compared with 1.2 ± 0.4 Hz at RT (Sharma and Vijayaraghavan, 2003). High-frequency bursts were observed in the presence of the agonist in all cases (n = 4) (Fig. 3A,B). The average delay in onset of the burst was 62 ± 13 s at LT (p = 0.078; compared with 29 ± 7 s at RT) (Sharma and Vijayaraghavan, 2003). The increase in frequency, in the presence of agonist was 7.5 ± 2-fold over the LT control, compared with 10.2 ± 1.6-fold at RT, compared with its control.

Low temperature dissociates high-amplitude events. A, Responses to 100 μm ACh/At recorded at 15–17°C (LT). mEPSCs in control (top trace) and in the presence of agonist (bottom trace). B, mEPSC frequency response in the absence (black trace) and the presence (red trace) of the agonist. Activation of nAChRs caused a robust increase in mEPSC frequencies. C, Cumulative probability distribution of amplitudes in control (black trace), in the presence of ACh/At (red trace) at LT, and at RT (23°C; green and blue traces respectively; data from 4 cells). The amplitude changes are abolished at LT (p = 0.1 control vs agonist), whereas a robust change is seen at RT (***p < 0.0001 control vs agonist). D, Amplitudes and 10–90% rise times at LT and RT for large (>95th percentile of respective controls) or averaged over all events. The amplitudes were significantly reduced (***p < 0.002, RT vs LT) and the rise times slower at LT (***p < 0.002, RT vs LT).
Interestingly, the amplitude distribution did not change significantly with ACh/At treatment at LT (p = 0.1) (Fig. 3C). The mean mEPSC amplitudes were 17.3 ± 0.9 pA for controls at LT (n = 255 mEPSCs from 4 cells) and 18.9 ± 0.2 pA during ACh/At bursts (n = 3578 mEPSCs), not significantly different from each other (p = 0.08, unpaired t test). The 95th percentile of the control amplitude distribution at LT was 37.4 pA. In the presence of the nAChR agonist, 7% of the events were above the 95th percentile of the control, compared with 33% at RT (Sharma and Vijayaraghavan, 2003). The average amplitude of events above the 95th percentile of control was 48.1 ± 0.8 pA at LT, compared with 91 ± 0.7 pA large events at RT (n = 3 cells, 247 and 3188 events for LT and RT, respectively; p < 0.0001) (Fig. 3D). The average 10–90% rise time of the large-amplitude mEPSCs was 2.01 ± 0.4 ms and 6.3 ± 0.3 ms at RT and LT, respectively, and the mean rise time for all events was 1.78 ± 0.01 ms and 4.0 ± 0.06 ms for mEPSCs at RT and LT, respectively (n = 3 cells, p < 0.0001 RT vs LT for both) (Fig. 3D).
After visual examination of a total of 51 mEPSCs, that had amplitudes of 50 pA or more, 94% of the events at low temperature showed distinct inflections in their rising phase (data not shown). Although this is consistent with concerted release, loss of most high-amplitude events at LT, and the lack of defined steps in amplitude along the rising phase of the mEPSCs, made additional analyses unlikely to yield any more useful information.
The loss of large-amplitude events at LT suggests that concerted release of multiple quanta is abolished at 15–17°C. Coupled with the large increase in frequency observed, our data suggests that the release, for the most part, is desynchronized. Another interpretation of the results shown in this section is that at LT, the number of release events per unit time is not high enough to achieve concerted release of multiple quanta, perhaps because of the loss of an additional temperature sensitive step downstream of calcium required for synchrony. Consistent with this conclusion, the rate of charge transfer at LT (quanta/s) was 23 ± 15% of that seen at RT (n = 4; p < 0.02).
Our results thus far demonstrating decoupling of frequency and amplitude speak to the possibility that the amplitude change evoked by nAChRs requires an additional step downstream of calcium release from ER. The first step toward addressing this issue would be to demonstrate that α7-nAChRs indeed raise presynaptic calcium at MFBs.
α7-nAChR activation causes a rise in calcium at MFBs
Although our results and those of one previous work (Gray et al., 1996) suggest that presynaptic α7-nAChRs increase glutamate release from MFBs, the ability of these receptors to increase intraterminal calcium is controversial (Gray et al., 1996; Vogt and Regehr, 2001). We, therefore, re-examined whether cholinergic agonists increased calcium in MFBs using fura-2, the calcium dye used in both previous studies. The identity of MFBs was confirmed by their location (in stratum lucidum), size (≥2 μm), and in some cases by double labeling with Dye I (see Materials and Methods) (Figs. 4A, 5A). Additional confirmation was obtained by demonstrating that a 10 s pulse with 70 mm KCl (substituted for NaCl in the ACSF) produced a calcium transient that was blocked by preincubating the slice with 10 μm DCG-IV (Fig. 4B). In the presence of DCG-IV the calcium response was decreased 73 ± 9% (n = 15 boutons, p < 0.0001 paired t test) (Fig. 4C). Washing out the agonist resulted in a recovery of the response to 96 ± 10% of the first response (n = 15; p = 0.6, paired t test) (Fig. 4B and 4 C).

Imaging MFBs. A, Top, Dye I-labeled MFB showing a beaded morphology characteristic of these terminals. Bottom, MFBs loaded with Fura-2 AM B, Calcium transient in response to a 10 s application of 70 mm KCl (HiK) in the absence (black trace) or presence (red trace) of 10 μm DCG-IV. The mGluR agonist significantly attenuated the response compared with control. Washout of the agonist resulted in near complete recovery of the response (green trace). C, Average data from 15 boutons before (Net HiK), during (Net DCG), or after washout (Net wash) of the mGluR agonist. In the presence of 10 μm DCG-IV, the calcium response was attenuated by 73 ± 9% (***p < 0.0001 compared with both the first response and response upon washout of the drug).

Calcium response to α7-nAChR activation. A, Left, A single MFB double labeled with Dye I (red) and Fura-2 (green). Middle trace, Response from this bouton to a 30 s application of 100 μm ACh/At. Right trace, Response to a 10 s application of 70 mm KCl from the same bouton. nAChR activation caused a slow long-lasting transient compared with the potassium application. B, Response to 100 μm ACh/At (left trace), to agonist application after a 30 min exposure to 125 nm αBTX (+αBTX; middle trace), and to a 10 s application of 70 mm KCl (HiK; right trace). C, Control response to 100 μm ACh/At (left trace; ACh/At); response after a 30–50 min incubation with 100 μm ryanodine (middle trace; +Ryanodine) followed by a response to a 10 s application of KCl (third trace; HiK). D, Left trace, Data from a single bouton to a 30 s application of 100 μm ACh/At showing emission from 340 nm excitation (black trace), 380 nm excitation (red trace), and the 340/380 ratio (green trace). Boutons were imaged at 0.3 Hz for the first 100 s and 0.1 Hz for the subsequent period. Activation of nAChRs elicited a slow calcium transient demonstrating changes in the opposite directions for the 340 nm and the 380 nm response, ruling out movement artifacts. Bar graph, Attenuation of ACh/At response by a 30 min preincubation with 125 nm αBTX (+αBTX) and a 45 min preincubation with 100 μm ryanodine (+Ryan). In the presence of the α7-nAChR antagonist, the calcium response was attenuated by 84 ± 16% (n = 21 boutons; ***p < 0.0001 compared with the ACh/At response). The block of RyRs attenuated the nAChR response by 61 ± 5.1% (n = 27 boutons; ***p < 0.0001 compared with control response).
A 30 s application of 100 μm ACh/At, resulted in a calcium transient with a slow rising phase and long-lasting increase in [Ca]i in MFBs. Because of the slow calcium transient, area of the signal over a 100–200 s period (the relevant time for the mEPSC experiments) was a more accurate estimate of the magnitude of the calcium response than the peak response (taking the peak did not qualitatively change the results). In all cases, at the end of the experiment, a response to a 10 s application of 70 mm KCl (HiK) was elicited to check the health of the terminals. Only terminals that responded with a calcium transient with ACh/At that came back to baseline, and responded to HiK with a sharp transient, at the end of each experiment, were used for analyses.
In the presence of 10 μm 1-(5-chloro-2,4-dimethoxy-phenyl)-3-(5-methyl-isoxazol-3-yl)-urea (PNU-120596) (Hurst et al., 2005), the positive allosteric modulator for α7-nAChRs, the calcium response was much larger and therefore more reliable. Responses were 3.6 ± 0.23-fold greater than that in the absence of the modulator (p < 0.0001, paired t test; n = 17 boutons). The allosteric modulator was included in all further experiments. The ACh/At response was not a movement artifact as previously suggested (Vogt and Regehr, 2001) as we used ratiometric measurements and the response from 340 nm excitation and the 380 nm excitation were in opposite directions, as expected (Fig. 5D, left). The response was confirmed to be mossy fiber in origin by double labeling the boutons with Fura 2-AM and DiI (placed in the granule cell layer) (Fig. 5A, left). The double labeled cells gave an identical response to the application of ACh/At and high potassium as those labeled with Fura 2 alone (n = 10 boutons) (Fig. 5A, middle, right).
A second response to the agonist elicited after 15–30 min wash was not significantly different from the first (87 ± 8.6%; p = 0.2, paired t test; n = 21 boutons). The response was due to activation of α7-nAChR as preincubating the cells with 125 nm αBTX blocked the response. In the presence of the toxin, the ACh/At response was decreased by 84 ± 16% compared with the controls (n = 21 boutons; p < 0.0001, paired t test) (Fig. 5B,D right).
Treating the slice with 100 μm ryanodine significantly reduced the ACh/At response. In the presence of ryanodine the ACh/At response was reduced to 61 ± 5.1% (n = 27; p < 0.0001 compared with controls, paired t test) (Fig. 5C,D right), demonstrating that ER calcium stores contribute to the nAChR response in MFBs.
Our data clearly demonstrate a slow calcium transient in the MFBs, triggered by the activation of α7-nAChRs.
Amplitude changes in response to sucrose elicited release
The question raised by the calcium experiments is whether a rise in intraterminal calcium is sufficient to cause changes in mEPSC amplitudes. We argued that if it were so, transmitter release induced downstream of calcium release, using hypertonic sucrose, should be immune to nAChR-mediated changes in amplitude. We, therefore, asked whether the long-lived changes in amplitude after nAChR activation could alter the amplitude distribution of responses to the application of 100 mm sucrose.
Application of sucrose by itself (for 30 s) to the stratum lucidum elicited a burst of mEPSCs (Fig. 6A). The increase in frequency was variable with a mean peak frequency of 26 ± 8.8 Hz (n = 7 cells) (Fig. 6B) and the mean frequency averaged over the application period was 9.7 ± 3.2 Hz. However, the amplitude distribution was not significantly altered in the presence of sucrose (control vs sucrose, p = 0.10) (Fig. 6C) (308 and 3464 events, respectively). The mean amplitude in the presence of sucrose was also not significantly different from that of control mEPSCs (24.1 ± 1.3 pA vs 22 ± 1 pA; p = 0.2, paired t test; n = 6 cells). This implies that changes in mEPSC frequencies alone are not sufficient to shift the amplitude distribution as would be predicted from previous data in this study.

Amplitude changes are preserved during sucrose application after nAChR activation. A, mEPSCs before (left) and during (right) application of 100 mm sucrose. A distinct increase in mEPSC frequency was observed. B, Frequency changes in the presence (red bar) of a 30 s application of sucrose. Sucrose elicited a burst of mEPSCs at high frequency. C, Cumulative probability distribution of mEPSC amplitudes taken from six cells. No significant shift in the amplitude distribution was observed (control, black; sucrose, red; p = 0.19). D, Frequency changes in the presence of ACh/At (first red bar), followed by a 30 s application of 100 mm sucrose (second red bar). Sucrose still elicited an increase in mEPSC frequencies. E, Cumulative probability distribution of amplitudes taken from six cells during control (black), during the period immediately preceding the sucrose application (green), and during sucrose application (red). Application of sucrose still elicited a rightward shift in the amplitude distribution, p < 0.0002 compared with control; p < 0.07 compared with the wash period after agonist application. F, Frequency changes in response to ACh/At followed by 100 mm sucrose application 25 min later. A distinct burst of mEPSCs were observed in the presence of sucrose. G, Cumulative probability distribution of amplitudes for control (black), ACh/At (red), and sucrose (green). Amplitude distributions in response to sucrose application 25 min later were not significantly different from that of the controls (n = 3 cells; p = 0.89 compared with control; p < 0.0001 compared with ACh/At).
We then asked whether the amplitude distribution after sucrose application would be altered if it immediately followed nAChR activation. Sucrose was applied for 30 s after the frequency changes induced by nAChR activation returned close to baseline as estimated by eye, online. This necessitated the application of sucrose at different time points after the cessation of agonist application. We, therefore, followed the following protocol for analyses. The period during sucrose application where the mEPSC frequency exceeded twice the frequency in the preceding wash period was used to calculate amplitudes of sucrose-elicited events. A 20 s period immediately preceding sucrose application was taken to estimate baseline frequency. The same number of events as elicited by sucrose application was taken from the immediately preceding period and were used for comparison. If sucrose application did not elicit large-amplitude mEPSCs, we would expect to see a significant reduction in the mean amplitudes of the events and a shift in the amplitude distribution to the left of that seen from the preceding time period.
The results are shown in Figure 6. Sucrose application after the ACh/At application still raised mEPSC frequencies (Fig. 6D). The mean baseline frequency during the period immediately preceding sucrose application was 1.75 ± 0.6 Hz and the mean frequency in the presence of sucrose was 6 ± 1.8 Hz (n = 6 cells).
The cumulative probability distribution of amplitudes of the mEPSCs, however, was still significantly shifted to the right compared with control (Fig. 6E) (p < 0.0002, 5264 and 297 events, respectively). The distribution was not significantly different from that during the preceding period after nAChR activation (p = 0.07). The mean amplitude when sucrose was applied after ACh/At was 32 ± 0.3 pA (compared with 21 ± 1 pA for control mEPSCs and 34 ± 0.6 pA in the period immediately preceding sucrose application; p < 0.001 compared with controls).
We also measured sucrose responses 20–25 min after the cessation of agonist application (Fig. 6F,G). There were no significant differences between sucrose mEPSCs and control mEPSCs in mean amplitudes (19 ± 0.4 pA and 17 ± 0.8 pA; p = 0.82) or in the amplitude distribution (p = 0.165; n = 3 cells). The percentage of sucrose events above the 95th percentile of control distribution was 5 ± 1.2%. Thus, it appears that nAChR-mediated potentiation of sucrose responses does not outlast amplitude changes induced by agonist application.
The maintenance of high-amplitude events, when sucrose was applied after nAChR activation, suggests that the change in mEPSC amplitudes is caused by modulation by mechanisms downstream of ER calcium release.
Role of CaMKII in amplitude changes after nAChR activation
The idea that the store calcium-dependent amplitude increases might occur downstream of ryanodine receptor (RyR)-activated increases in [Ca]i suggested to us that there might be additional effectors mediating the amplitude change. It has been reported that protein kinase C alters the frequency of release events seen after sucrose application at the calyx of Held (Wu and Wu, 2001). PKC has been shown to both increase the size of the readily releasable pool (RRP) of vesicles, as well as increase the rate of refilling in hippocampal neurons (Stevens and Sullivan, 1998), suggesting that protein kinase activity can regulate sucrose responses. We, therefore, asked whether protein phosphorylation might play a role in mediating the amplitude changes.
nAChRs have been shown to increase the activity of CaMKII (Tsutsui et al., 1996; Tang et al., 1998; Nakayama et al., 2001; Yamashita and Isa, 2003; Damaj, 2007) and, in the few cases tested, this occurs downstream of nAChR-mediated store calcium release (Chang and Berg, 2001; Hu et al., 2002). We, therefore, tested the role of CaMKII in modulating nAChR effects at MFBs. Slices were incubated with 10 μm KN-93, a selective CaMK inhibitor, or with its negative analog, KN-92, using identical conditions (45–60 min incubation in the drug). KN-93 completely blocked amplitude changes while maintaining the high-frequency burst (Fig. 7A,B). The peak frequency in the presence of KN-93 was 45.4 ± 11 Hz (n = 10 cells) compared with agonist alone (45.3 ± 4.5 Hz; n = 6; p = 0.99). In the presence of KN-93, the cumulative probability distribution of amplitudes and the mean amplitudes were not significantly different from control values (p = 0.55 and 0.75, respectively) (Fig. 7B,D) (1425 events control; and 9633 events KN-93). The mean amplitude of control mEPSCs in the presence of KN-93 was 22 ± 1.2 pA, not significantly different from untreated controls (p = 0.4, 234 and 239 events, respectively; data from same cells) and the basal frequency in the presence of KN-93 was 85 ± 5% of controls before treatment from the same cells (p = 0.7, paired t test, n = 2; data from same cells).

CaMKII antagonist abolishes amplitude changes. A, Nicotine (20 μm) elicited an mEPSC burst in the presence of 10 μm KN-93. The CaMKII antagonist was incubated for 45 min before agonist application. Bottom traces, Expanded traces for nicotine and control in the presence of KN-93. B, Left, Frequency changes in the presence of KN-93 in a single cell (control, black; nicotine, red; and wash, green). Nicotine (20 μm) elicited a robust burst of high-frequency mEPSCs. Right, Cumulative probability distribution of amplitudes for control (black traces) and nAChR activation in the presence of KN-93 from seven cells (red trace). The shift in the amplitude distribution was not significant (p = 0.55). C, Left, Frequency changes after application of 20 μm nicotine after a 45 min incubation with 10 μm of the inactive analog KN-92 (control, black; nicotine, red; wash, blue). KN-92 elicited a robust increase in mEPSC frequencies. Right trace, Cumulative probability distribution of amplitudes in the absence (black trace) and in the presence (red trace) of 20 μm nicotine plus 10 μm KN-92 from six cells. The agonist elicited a robust shift in the amplitude distribution in the presence of the inactive analog (**p < 0.001). D, Mean mEPSC amplitude for control, 20 μm nicotine plus 10 μm KN-93 (Nic + KN93), nicotine in the presence of 10 μm KN-92 (Nic. + KN92), or nicotine alone (Nic). In the presence of the active CaMKII inhibitor, the mean amplitudes after nicotine application were not significantly different from the control (p = 0.8), whereas in the presence of the inactive analog, a significant increase in mEPSC amplitudes was observed (44.4 ± 0.5 pA; p < 0.0001 compared with control). E, Calcium responses in the presence of KN-93. Left, Calcium trace from a single bouton showing responses to ACh/At (black); ACh/At + 100 μm ryanodine + 10 μm KN-93 (red); and ACh/At + KN-93 + ryanodine + 125 nm αBTX (green). Middle, HiK response from the same bouton elicited at the end of the experiment. Right, Cumulative data from 16 boutons. Inhibition of ACh/At signals after treatment with KN-93 + ryanodine was highly significant (***p < 0.0001, paired t test), as was the further inhibition of the signal by αBTX (***p < 0.0001, paired t test). The magnitude of the signal in the presence of ryanodine and KN-93 was not significantly different from that with ryanodine alone (Fig. 5) (p = 0.49).
The application of agonist in the presence of 10 μm KN-92, the inactive analog as a negative control, had effects on frequencies not significantly different compared with either the agonist alone or agonist in the presence of KN-93 (Fig. 7C) (mean frequency, 46.25 ± 9.06 Hz, n = 8; p = 0.95 compared with agonist in the presence of KN-93; p = 0.96 compared with agonist alone). Unlike with the active analog, the amplitude distribution in KN-92 was significantly shifted to the right (Fig. 7C) (p < 0.0001 compared with both control and agonist in the presences of KN-93). Our results suggest that active CaMKII is required for the concerted release of multiple quanta induced by nAChR activation, but not the induction of the high-frequency burst.
The availability of an inactive analog makes KN-93 the main, reliable, membrane-permeant CaMKII inhibitor. KN-92, the inactive form, mimics all effects of KN-93 with the exception of its ability to inhibit kinase activity. For this reason, it has often been used as the sole inhibitor for implicating CaMKII (Fog et al., 2006). Shared nonspecific effects of all membrane-permeant CaMKII inhibitors (Li et al., 1992; Tsutsui et al., 1996) makes their effects hard to interpret without a negative control. Therefore, instead of testing a second CaMKII inhibitor, constrained by the same caveats, we chose to test the involvement of other calcium and/or CaM-dependent kinases known to affect transmitter release (Stevens and Sullivan, 1998; Wu and Wu, 2001; Arias-Montano et al., 2007). At the CA3–mossy fiber synapse multiple kinases have been shown to alter transmitter release probabilities. In addition to CaMKII (Salin et al., 1996), these are protein kinase A (PKA) (Goussakov et al., 2000; Mellor et al., 2002) and PKC (Galimberti et al., 2006).
We used protein kinase inhibitors with selectivities for PKA (100 μm H-89) and PKC (100 μm bisindolylmaleimide). Slices were exposed to all antagonists for a period of 45–60 min before recording, to ensure their loading.
There was no effect of blocking PKA and PKC using their respective inhibitors at 10–100 times the concentrations shown to be effective in blocking transmitter release from presynaptic terminals in acute slices (Wu and Wu, 2001; Xu et al., 2004; Asaumi et al., 2006; rias-Montano et al., 2007). Results are shown in supplemental Figure 1 (available at www.jneurosci.org as supplemental material)
Because KN-93 is a membrane permeant antagonist, we could not use it in the patch pipette to rule out postsynaptic contributions. Instead we included 1 μm autocamtide-2 related inhibitory peptide (AIP) which is 25 times its IC50 for inhibiting CaMKII (Ishida et al., 1995), in the patch pipette. The peptide was allowed to diffuse for 30–40 min before agonist application. AIP had no effect on nAChR-mediated frequency or amplitude changes (n = 6 cells) (supplemental Fig. 2, available at www.jneurosci.org as supplemental material). The mean amplitude of the mEPSCs in the presence of AIP was 48.26 ± 0.195 pA (n = 6) whereas that with agonist alone was 47.5 ± 0.3 pA (n = 3), not significantly different from each other (p = 0.21).
As the postsynaptic effects of CaMKII block have not been well characterized at the mossy fiber–CA3 synapse, a definitive positive control for the AIP experiment was not possible. We used a second approach to confirm the presynaptic locus of action. It has been shown that inclusion of 10 mm BAPTA in the patch pipette abolishes or drastically attenuates store calcium-mediated postsynaptic alterations during multiple forms of mossy fiber LTP (Yeckel et al., 1999). In addition, inclusion of the buffer abolishes ER store-dependent calcium changes in CA3 dendrites. These results suggest that BAPTA reaches the postsynaptic thorny excrescences and should abolish ER store-dependent changes at postsynaptic sites.
As the changes in mEPSC amplitudes are entirely dependent on store calcium (Sharma and Vijayaraghavan, 2003), we argued that inclusion of 10 mm BAPTA in the pipette should abolish nAChR-mediated amplitude changes if they were postsynaptic in origin. Results are shown in supplemental Figure 2D (available at www.jneurosci.org as supplemental material). A period of 30–40 min was given before testing for agonist response, to ensure adequate diffusion of the buffer. Application of agonist in the presence of BAPTA caused a robust increase in both mEPSC frequencies and amplitudes clearly demonstrating the presynaptic origins the amplitude response.
Does the KN-93 effect come from a direct inhibition of presynaptic α7-nAChRs? To obtain evidence for or against this possibility, we examined ACh/At-induced changes in [Ca]i at MFBs under conditions where store contributions were blocked by 100 μm Ryanodine (see Fig. 5). Incubation with Ryanodine and 10 μm KN-93 decreased the fluorescence changes to 55.7 ± 4.3% of the control ACh/At responses from the same cells (Fig. 7E) (n = 16 boutons; p < 0. 0.0001, paired t test). The residual signal was further blocked by 125 nm αBTX (7.5 ± 1.5% of ACh/At alone; p < 0.0001 compared with signals from agonist alone and agonist plus ryanodine plus KN-93; paired t test). Interestingly, the agonist-induced signal in the presence of KN-93 and Ryanodine was not significantly different from that in the presence of Ryanodine alone (55.7 and 61.5% of responses to agonist alone, respectively, p = 0.4, unpaired t test). These results suggest that if the residual calcium signals, after blocking store contributions with 100 μm ryanodine, were caused by calcium flux through α7-nAChRs, KN-93 had no significant effect on the receptor.
Both amplitude and frequency changes are required for nAChR-mediated postsynaptic firing
Our previous work (Sharma and Vijayaraghavan, 2003) showed that the onset of the high-frequency and -amplitude burst leads to postsynaptic firing. Our data suggest that the postsynaptic firing occurs only at the initial burst period when the frequency and amplitude changes are maximal. The average duration of postsynaptic firing was 18 ± 9 s (n = 7; compared with the mean duration of the mEPSC burst, 52 ± 10 s; p < 0.02). No changes in mEPSP frequencies were observed before the burst of APs. This is consistent with the finding that there is no change in mEPSC frequencies before the burst as well (Fig. 1). As both frequency and amplitude changes require release of store calcium (Sharma and Vijayaraghavan, 2003), it is possible that the spatial localization of the α7-nAChRs on MFBs is such that flux through the channel does not cause sufficient changes in [Ca]i near exocytic sites to affect release. This interpretation would be consistent with our previous finding in another system where detected calcium signals after receptor activation were entirely attributable to receptor-mediated store calcium release (Sharma and Vijayaraghavan, 2001).
Our previous data also suggested that at low frequencies, large-amplitude events were not sufficient to drive the pyramidal neuron above threshold. Here we asked whether the initial high-frequency burst was sufficient to drive postsynaptic firing.
Nicotine (20 μm) was applied at the stratum lucidum and the membrane voltage monitored in the current clamp mode. The agonist elicited a burst of APs (Fig. 8A) after a delay of 38 ± 12 s; n = 7 (compared with the mEPSC burst delay of 29 ± 7 s; p = 0.53). This was accompanied by a rightward shift in the mEPSP amplitude distribution.

Inhibition of CaMKII abolishes postsynaptic firing. A, Response of a CA3 pyramidal cell to the application of 20 μm nicotine under current-clamp mode. Application of the agonist caused a delayed burst of APs concomitant with the burst of high-frequency mEPSCs. B, Same experiment in cells treated for 45 min with 10 μm KN-93. Although one could observe increased number of mEPSPs, no postsynaptic firing was observed.
In cells that were incubated with 10 μm KN-93, although one could observe an increase in the number of mEPSPs, no postsynaptic firing was seen (zero of five cells) (Fig. 8B). These results demonstrate that both an increase in the number of release events, as well as the concerted release of multiple quanta is required to drive the postsynaptic cell above threshold. The CaMKII inhibitor did not alter the AP-threshold or mEPSP kinetics (supplemental text and Fig. 3, available at www.jneurosci.org as supplemental material).
We then calculated the frequency of release required to elicit postsynaptic firing. To do this we estimated the charge carried by a uniquantal mEPSCs. Averaging 1363 fast mEPSCs (10–90% rise times ≤1.5 ms) with amplitudes <20 pA, the mean amplitude under control conditions, as shown previously (Sharma and Vijayaraghavan, 2003) gave a relatively homogenous population (coefficient of variation, 19%) of unitary mEPSCs with a mean amplitude of 15 ± 0.1 pA, mean 10–90% rise time of 0.95 ± 0.008 ms, and a mean charge of 65 ± 5 fC; comparable with that reported earlier at these synapses (Jonas et al., 1993). There was no positive correlation between rise times and amplitudes among these mEPSCs (r = −0.003; p = 0.911) arguing against these events being multiquantal. Assuming that release of one quantum transfers 65 fC of charge, then dividing the total charge carried by mEPSCs over a period of time by 65 fC gave us a more accurate estimate of release frequency expressed as quanta/s. Averaging the first 5 s of nAChR-induced burst showed that the mean frequency during this period was 330 ± 82 quanta/s (n = 6). Application of nicotine in the presence of KN-93 resulted in a mean frequency of 70 ± 17 quanta/s (n = 10; 21% of the frequency compared with the burst in the absence of the CaMKII inhibitor; p < 0.05). This demonstrates that large-amplitude mEPSCs arise from much higher release frequencies as a result of CaMKII activation.
Our data demonstrate that blockade of CaMKII results in the attenuation of concerted release resulting in insufficient depolarization to drive the postsynaptic cell above threshold.
Activation of nAChRs by low concentrations of nicotine is sufficient to cause concerted release
A key question posed by this study is its biological relevance. Our results suggest that ACh concentrations between 10 and 100 μm are required for mediating the nAChR effects (data not shown). Although one could argue, based on studies at the neuromuscular junction, that such concentrations are physiologically relevant, very little is known about ACh release in the CNS. Electron microscopic studies suggest that release of ACh and subsequent signaling might be mediated by “volume” transmission, dependent on diffusion of the released ACh (Contant et al., 1996; Descarries et al., 1997; Mechawar et al., 2002). If that's the case, then the actual concentrations of the transmitter at the mossy fiber synapse remains unknown. At present, there are few available tools to examine the mechanics of cholinergic transmission.
It is known that serum concentrations of nicotine reach 0.5–1 μm during smoking (Henningfield et al., 1993). As nicotine and its metabolites are concentrated in the brain almost fivefold (Ghosheh et al., 2001), this is likely to be an underestimate of the concentrations seen at CNS synapses. We used low nicotine concentrations at RT and at physiological temperatures (35°C) to examine their effects on glutamatergic mEPSCs. The results are shown in Figure 9. Nicotine at 0.5 μm, when applied at 35°C caused a 9.2 ± 3.8-fold increase in mEPSC frequencies (n = 3 cells) (Fig. 9A,B). The amplitude distribution showed a distinct rightward shift even during the wash period when the frequencies had declined by 80% of the value in the presence of the agonist (Fig. 9B, right) (p < 0.0001, control vs nicotine and control vs wash). The mean amplitudes of the mEPSCs increased from 20.4 ± 0.7 pA in controls to 32.4 ± 0.6 pA in the presence of 0.5 μm nicotine and 41.2 ± 1.12 pA during wash (data from three experiments, control, 1274 mEPSCs; nicotine, 7883 mEPSCs; and 2473 mEPSCs during wash; p < 0.0001 control vs nicotine and control vs wash).

Responses to low nicotine concentrations. A, Left trace, Control mEPSCs. Right trace, mEPSC burst induced by 0.5 μm nicotine at 35°C. Nicotine (0.5 μm) causes a burst of large mEPSCs at physiological temperatures. B, Left, Frequency response to 0.5 μm nicotine from a neuron (control, black; nicotine, red; and wash, green). Nicotine caused a sharp, robust increase in mEPSC frequency. Right, Cumulative probability distribution of amplitudes from three cells (color codes are the same). Low nicotine caused a long-lasting change in mEPSC amplitudes (p < 0.0001 compared with control, for both red and green traces). C, Left, Frequency response to application of 1 μm nicotine at RT (control, black; nicotine, red). Nicotine caused a robust increase in mEPSC frequencies. Right, Cumulative probability distribution of amplitude (color code same) taken from five cells. At RT, 1 μm nicotine did not alter mEPSC amplitude distribution (p = 0.4 compared with control). D, Calcium response from a MFB to a 30 s application of 0.5 μm nicotine (left trace). Nicotine causes an increase in [Ca]i. The red trace is a three-point adjacent average of the raw trace. Right trace, Same bouton challenged with a 10 s application of 70 mm KCl.
Application of 1 μm nicotine at RT resulted in a robust increase in mEPSC frequencies (Fig. 9C, left). In the presence of agonist the mean frequency increased 9.5 ± 2-fold (n = 5 cells) not significantly different from that elicited by 0.5 μm nicotine at physiological temperatures (9.2 ± 3.8-fold; p = 0.96). The amplitude distribution was not significantly altered (control, 483 mEPSCs; nicotine, 2768 mEPSCs; n = 5 cells; p = 0.4) (Fig. 9C, right). The mean mEPSC amplitudes were not significantly different between controls and 1 μm nicotine (22 ± 1.1 pA and 23 ± 0.4 pA respectively; n = 5 cells; p = 0.4).
Measurements of calcium signals from MFBs were difficult at physiological temperatures because of increased basal noise, spontaneous calcium transients, and possible dye sequestration. Nonetheless, examining data from 10 boutons, that did not show spontaneous activity, a distinct calcium transient was observed in response to a 30 s application of 0.5 μm nicotine (Fig. 9D). The cumulative calcium change over a period of 200 s was 2.2 ± 0.2-fold that seen with a signal obtained from a 10 s application of HiK integrated over 60 s; the average duration of the HiK response (p < 0.0001, 0.5 μm nicotine vs HiK; paired t test) suggesting a slow but significant calcium change in the boutons, as seen with 100 μm ACh/At at RT.
Discussion
There is increasing evidence that information transfer across synapses can occur in the absence of presynaptic APs. An understanding of the mechanisms underlying AP-independent signaling and its biological relevance is lacking. In this study, we show that α7-nAChRs, via their ability to mobilize store calcium, induce concerted release of multiple quanta at the mossy fiber–CA3 pyramidal cell synapse resulting in large-amplitude mEPSCs. This process of concerted release requires the downstream activation of presynaptic CaMKII demonstrating a novel, kinase-mediated, regulation of concerted release of multiple vesicles at the MFB. Furthermore, the coincidence of an overall increase in mEPSC frequencies and the CaMKII-dependent release of multiple quanta are required to drive the postsynaptic cell above threshold. This form of regulation of transmitter release taps into the RRP at this synapse, but is not subject to the negative feedback regulation by type II mGluRs characteristic of this synapse.
Our results demonstrate a regulated and a uniquely timed form of plasticity, driven by store calcium, that is responsive to a different history of synaptic activity than that mediated by presynaptic APs.
Large-amplitude mEPSCs from MFBs arise from concerted release of multiple quanta
The proportional increase of the AMPA and KA components with increasing amplitudes of individual mEPSCs is consistent with concerted release of multiple vesicles. For a postsynaptic mechanism to work, one would have to postulate equal scaling (by insertion or modification) of both postsynaptic components, possible but unlikely to occur.
In our experiments, reducing the temperature abolished the amplitude change implying a loss of efficiency in the nAChR-mediated release at MFBs. These data rule out monoquantal release from large, clear vesicles based on an earlier report (Henze et al., 2002). In the small pool of large mEPSCs, a number of events had inflections in their rising phase consistent with summation. However, we believe that the only case in which inflections can be convincingly used to show concerted release would be when individual events show kinks that occur at regular intervals which are multiples of an unitary event (Williams et al., 1998), a phenomenon unlikely to occur at a complex terminal with multiple active zones.
Coupled with the large overall increases in mEPSC frequencies, one explanation for our LT data are that an additional temperature-dependent step downstream of calcium is required for concerted release.
Evidence for functional α7-nAChRs on MFBs
Activation of α7-nAChRs results in a slow calcium transient that has a rise time in the order of many seconds and returns to baseline over a period of minutes. The modulation of the calcium signal by the positive allosteric modulator of α7-nAChR, PNU-120596 (Hurst et al., 2005), and the almost complete inhibition of the response with 125 nm αBTX, confirm that the calcium response in MFBs is attributable to the activation of this class of nAChRs, consistent with our electrophysiological data.
Although their conclusions about a previous report demonstrating α7-nAChR-mediated calcium transients from MFBs (Gray et al., 1996) might be correct, the slowness of the calcium transients explains the failure of Vogt and Regehr (2001) to detect calcium responses with rapid (1 s) agonist applications and a short imaging window. At the same time, their ability to see rapid α7-nAChR responses from the interneuron soma, shown also to have fast desensitizing current responses (Fayuk and Yakel, 2007), raises the possibility that there is a slow component to the presynaptic α7-nAChR, different from that described on postsynaptic neurons. Whether this implies the existence of a heteromeric receptor, a splice variant (Cuevas and Berg, 1998), or modification of receptor kinetics by association with other proteins, remains to be seen.
Involvement of store calcium
The significant block of the calcium signal by the inhibition of RyRs confirms the dependence of the calcium transient on ER store release, predicted by our electrophysiological data (Sharma and Vijayaraghavan, 2003).
The role of ER calcium in modulating short-term plasticity at these synapses is controversial showing both potentiation (Lauri et al., 2003) or no effect (Carter et al., 2002; Breustedt and Schmitz, 2004). Although we have not addressed this issue directly, our results demonstrating a slow calcium transient in response to store calcium release would explain a lack of effect of store calcium manipulations on frequency facilitation (Breustedt and Schmitz, 2004).
Our finding that DCG-IV is much less efficacious at blocking the mEPSC burst than EPSCs at this synapse implies that nAChR effects might not be subject to the same feedback mGluR-mediated regulation, seen with AP-dependent transmission.
Concerted release is regulated downstream of ER calcium
A surprising finding was that the amplitude change induced by nAChR activation persisted during subsequent applications of 100 mm sucrose. Because sucrose causes release independent of calcium changes, it is unlikely that synchrony arises from coordinated RyR-mediated calcium sparks at, or across, active zones. The most likely possibility is that calcium release from ER acts on downstream effectors to alter release. Such modulation of sucrose responses occurs at other synapses where protein kinase C has been shown to increase the frequency of release (Wu and Wu, 2001) and to increase both RRP size and vesicle refilling rates (Stevens and Sullivan, 1998).
Our data suggests some overlap between the AP-independent pool and the RRP. The large size of the MFB vesicle pool and complexity of the terminal (Rollenhagen et al., 2007) might allow for spatially selective mobilization of different subpools within the same RRP. Knowledge of the location of RyRs in the terminal will be critical in resolving this issue.
Involvement of CaMKII
The ability of CaMKII to alter release probabilities at this synapse has been shown in one instance (Salin et al., 1996). The role of CaMKII in mediating the effects of nAChRs has been documented in other systems (Damaj, 2000; Chang and Berg, 2001; Diaz-Hernandez et al., 2006; Damaj, 2007), and studies probing the mechanistic details of this signaling, clearly implicate store calcium as a trigger for nAChR-mediated CaMKII activation (Chang and Berg, 2001; Hu et al., 2002). These studies, combined with ours, suggest that activation of CaMKII might be a common mechanism in nAChR signal transduction.
CaMKII modulation of mEPSC frequencies is seen in hippocampal cultures (Ninan and Arancio, 2004), where the effects of the enzyme might be isoform specific (Thiagarajan et al., 2002). Our data indicate that the site of CaMKII action lies downstream of calcium, but the actual substrates of the enzyme responsible remain unknown.
Mechanisms by which CaMKII-mediated concerted release occurs remains to be investigated. It is possible that multiple vesicles are tethered to each other, as seen in ribbon synapses (Parsons and Sterling, 2003; Sterling and Matthews, 2005), or that the enzyme directly fuses multiple vesicles resulting in a form of compound exocytosis shown in other systems (Angleson et al., 1999). Another possibility is that CaMKII relieves lateral inhibition that then allows multiple release events to occur. There is evidence for (Dobrunz et al., 1997) and against (Abenavoli et al., 2002) lateral inhibition at other hippocampal synapses. At this juncture, all these remain speculative possibilities that need to be addressed.
A key finding from our previous work was that the burst of mEPSCs is sufficient to drive the postsynaptic neuron above its firing threshold. Postsynaptic firing coincided with the onset of the burst when frequency and amplitude changes were maximal. At low frequencies, the high-amplitude mEPSCs were not, by themselves, sufficient to drive the postsynaptic neuron above threshold (Sharma and Vijayaraghavan, 2003). Our data here shows that frequency change, in the absence of concerted release is also not sufficient for AP generation. This demonstrates that the coincidence of the two, generated by increase in [Ca]i as well as the downstream CaMKII activation, is required for postsynaptic firing independent of presynaptic APs.
Potential biological relevance of AP-independent signaling
The relevance of nAChR-mediated postsynaptic firing remains to be elucidated. One might question, given the brevity of the burst, its relevance to synaptic strength. However, a single burst of 30–90 APs is sufficient to activate, by phosphorylation, the cAMP response element-binding protein (CREB) signaling cascade in dorsal root ganglion neurons (Fields et al., 1997). Furthermore, such bursts spaced 5 min apart, result in sustained activation of CREB, sufficient to alter gene expression and synaptic strength effectively (Fields et al., 1997). These results suggest a potential role for the nAChR-dependent firing in altering synaptic strength at the CA3–mossy fiber synapse.
The role of endogenous cholinergic inputs in mediating these effects remains unknown. This is mainly because of a lack of adequate tools to examine the mechanistic underpinnings of cholinergic signaling. Our finding that low nicotine concentrations, spanning the range experienced by smokers, can induce a burst of mEPSCs with changes in amplitude speaks to the biological relevance of AP-independent signaling. It is now being realized that addiction is a problem of hedonic dyshomeostasis, where drug use is seen as an attempt at self-medication to restore the balance of affective states in the body (Koob, 1996; Koob and Le Moal, 1997). Seen from this perspective, drug addiction is a complex phenomenon involving a lot more than just activation of reward pathways. The ability of drugs like nicotine to alter synaptic plasticity is clearly in line with this reasoning. This leads to the speculation that concerted release of transmitters, induced by nicotine, might play a role in achieving an alternate homeostatic state in the brain contributing to nicotine addiction.
Footnotes
-
This work was supported by National Institute of Drug Abuse Grant RO1 DA 10266 and Cutting-Edge Basic Research Awards Grant 5 R21 DA019453 to S.V. and by the American Heart Association Scientist Development Grant to G.S.
- Correspondence should be addressed to Sukumar Vijayaraghavan, Department of Physiology and Biophysics, University of Colorado at Denver and Health Sciences Center, Mail Stop 8307, P.O. Box 6511, 12800 East 19th Avenue, Aurora, CO 80045. sukumar.v{at}uchsc.edu


