

Abstract
A major goal in neuroscience is the development of optical reporters of membrane potential that are easy to use, have limited phototoxicity, and achieve the speed and sensitivity necessary for detection of individual action potentials in single neurons. Here we present a novel, two-component optical approach that attains these goals. By combining DiO, a fluorescent neuronal tracer dye, with dipicrylamine (DPA), a molecule whose membrane partitioning is voltage-sensitive, optical signals related to changes in membrane potential based on FRET (Förster resonance energy transfer) are reported. Using DiO/DPA in HEK-293 cells with diffraction-limited laser spot illumination, depolarization-induced fluorescence changes of 56% per 100 mV (τ ∼ 0.1 ms) were obtained, while in neuronal cultures and brain slices, action potentials (APs) generated a ΔF/F per 100 mV of >25%. The high sensitivity provided by DiO/DPA enabled the detection of subthreshold activity and high-frequency APs in single trials from somatic, axonal, or dendritic membrane compartments. Recognizing that DPA can depress excitability, we assayed the amplitude and duration of single APs, burst properties, and spontaneous firing in neurons of primary cultures and brain slices and found that they are undetectably altered by up to 2 μm DPA and only slightly perturbed by 5 μm DPA. These findings substantiate a simple, noninvasive method that relies on a neuronal tracer dye for monitoring electrical signal flow, and offers unique flexibility for the study of signaling within intact neuronal circuits.
Introduction
Electrode-based methods are the principal tools for recording activity from single neurons, yet there are many contexts in which these methods have limited capabilities. For example, it is difficult to monitor electrical signals in subcellular compartments such as axons or dendritic spines, to make parallel recordings from several interconnected neurons, or to make long-term (i.e., days) recordings from single neurons. Such limitations have stimulated the development of optical approaches as alternatives (Salzberg et al., 1973; Cohen et al., 1978). The most widely used involve synthetic fluorescent dyes which allow detection of spatially averaged membrane potential from many neurons (Parsons et al., 1991; Obaid et al., 1999; Petersen et al., 2003; Grinvald and Hildesheim, 2004), or from small regions of single neurons (Djurisic et al., 2004; Nuriya et al., 2006; Palmer and Stuart, 2006; Zhou et al., 2007, 2008; Fisher et al., 2008). Unfortunately, the best-performing synthetic dyes have significant shortcomings, including low aqueous solubility (Fromherz et al., 2008), making it difficult to label single neurons, slow diffusional properties (Blunck et al., 2005) requiring long staining periods (e.g., Djurisic et al., 2004), and high phototoxicity (Obaid et al., 1999; Djurisic et al., 2004).
A promising optical approach makes use of changes in Förster resonance energy transfer (FRET) between two components, one of which partitions between leaflets of the lipid bilayer in response to changes in transmembrane voltage (González and Tsien, 1995, 1997). We have adapted this approach by pairing the common tracer dye DiO (Cohen et al., 1974; Honig and Hume, 1989; Wu et al., 2003) as a fluorescent donor with dipicrylamine (DPA), a low-molecular-weight lipophilic anion, as a nonfluorescent, voltage-sensing acceptor (Chanda et al., 2005b). As a donor, DiO is a bright, nontoxic membrane label that permits repeated imaging of viable neuronal structures (Dailey et al., 1994) and does not perturb electrical activity (Honig and Hume, 1986; Ratzliff et al., 2004). DiO readily labels cultured cells by bath application, or clusters of neurons within live tissue using ballistic application (Gan et al., 2000), making it a versatile fluorescent membrane label for neurons within a network (Morgan and Wong, 2008). As an acceptor/voltage sensor, DPA has attractive properties including extremely rapid kinetics (τ < 0.5 ms) (Fernández et al., 1983; Chanda et al., 2005b), peak voltage sensitivity within the physiological range, good aqueous solubility, and low phototoxicity. One potential limitation is that DPA can perturb excitability by adding capacitance to the membrane (Fernández et al., 1983; Chanda et al., 2005b; DiFranco et al., 2007; Sjulson and Miesenböck, 2008).
Using laser spot detection methods, we demonstrate that DiO/DPA can report voltage-dependent fluorescence changes in HEK cells with submillisecond kinetics and a sensitivity of up to 60% ΔF/F per 100 mV, performance equal to or better than any existing voltage sensor. In culture and brain slice preparations, subthreshold signals are detectable from neurons in average trials and AP-evoked signals in single trials with a signal-to-noise ratio (SNR) >6. Control experiments confirm that relevant DPA concentrations do not alter AP waveform, high-frequency bursting, or spontaneous firing. These properties make DiO/DPA well suited for use as an in situ sensor of neuronal activity.
Materials and Methods
Cell culture preparation and transfection.
HEK-293 cells and hippocampal neurons (2–4 weeks in vitro) were prepared as previously described [Zhang et al. (1997) and Eugène et al. (2007), respectively]. eGFP-F was from BD Biosciences Clontech and a kind gift from Dr. Pratap Meera, University of California, Los Angeles (Los Angeles, CA). Transfections were also performed as previously described (Zhang et al., 1997).
Brain slice preparation.
Parasagittal slices of cerebellum were prepared from 25- to 45-d-old BALB or C57BL/6 mice (Nielsen et al., 2004). Slicing solution was chilled to <4°C and consisted of the following (in mm unless otherwise stated): 85 NaCl, 63.4 sucrose, 2.5 KCl, 0.5 CaCl2, 4 MgCl2, 1.25 NaH2PO4, 26 NaHCO3, and 25 glucose, saturated with 95% O2/5% CO2. Slices were incubated in the same solution at 34°C for 30 min to 1 h, and then transferred to normal external solution maintained at room temperature (22–24°C). This external solution was comprised of the following: 125 NaCl, 2.5 KCl, 2 CaCl2, 1 MgCl2, 1.25 NaH2PO4, 26 NaHCO3, and 25 glucose, pH 7.3.
Electrophysiological recording.
The external solution for HEK-293 cells was as follows (in mm): 140 NaCl, 5 KCl, 2 CaCl2, 1 MgCl2, 20 HEPES, and 25 glucose, pH 7.4; and for hippocampal cells, it was as follows: 130 NaCl, 2 KCl, 2 CaCl2, 3 MgCl2, 10 HEPES, and 20 glucose, pH 7.4. Fire-polished patch electrodes were back-filled with an internal solution, as follows (in mm): 110 K-MeSO3, 40 HEPES, 6 NaOH, 4 MgCl2, 0.3 NaGTP, 4 NaATP, either 5 EGTA and 2 CaCl2, or 2 EGTA alone, and in some recordings 20 μm Alexa 594. Tip resistances were between 3 and 10 MΩ. Recordings from cultured cells were performed at elevated temperatures (32–34°C), and neuronal recordings from brain slices were made at slightly elevated temperature (25–27°C). Voltage-clamp and current-clamp recordings from cultured cells were performed with an Axopatch 200B (Molecular Devices), filtered at 5–10 kHz, and then digitized at 20 or 100 kHz. Current-clamp recordings from brain slices were performed with a Multiclamp 700B amplifier (Molecular Devices), filtered at 10 kHz, and digitized at 20–100 kHz. Series resistance compensation of HEK-293 cells produced a final series resistance of on average 6.3 ± 0.9 MΩ (n = 16). Where indicated, holding current was injected to maintain the membrane potential at approximately −70 mV (hippocampal neurons) or −60 mV (Purkinje neurons), and 2 or 10 ms current injections were used to elicit single APs or complex spike-like bursts, respectively. AP waveforms used as voltage-clamp commands in the HEK-293 cell experiments were provided courtesy of Dr. Yukihiro Nakamura, Doshisha University (Kyoto, Japan), and were recorded from 7-d-old rat calyx of Held.
DiO and DPA staining.
HEK-293 cells on glass coverslips were labeled for 2 min by incubation in HEPES-based external solution containing the membrane fluorescent probe DiO, either DiO-C18 or DiO-C16 (Invitrogen), at a final concentration of 5–10 μm. Cultures of hippocampal neurons were labeled with 4–10 μm DiO16. Increasing the temperature to 37°C during incubation with DiO16 often enhanced labeling. In some sets of cultures (both HEK-293 and hippocampal), bath staining was less reliable. As an alternative, HEK-293 cells or single neurons were labeled by maintaining the cell-attached patch configuration for 15 s to 3 min with a patch pipette filled with external solution (HEK-293) or internal solution (neurons), to which DiO at a final concentration of 1.8 μm or 5–10 μm, respectively, had been added. Dilutions of DiO were made fresh from a 1.8 mm stock in dimethylformamide (Sigma). Empirically, we found it more efficient to stain with DiO16 yet did not observe significantly different response behavior compared with DiO18. We found that cell-attached labeling was quite reliable for staining the soma, proximal axon, and dendrites (see Results), particularly when clumps of DiO were visible in the labeling pipette.
DPA (City Chemicals) was dissolved to 20 mm in DMSO (Sigma-Aldrich), stored at room temperature, and diluted daily into the external solutions. Superfusion was set to ∼1 ml/min; optical responses generally could be detected from cultured cells within 3 min after switching over to DPA-containing external solution, and became maximal within 10 min. For slices, >30 min of preincubation by bath application of DPA was necessary before optical responses showed saturation. For this reason, all measurements using DPA in slices have been made after 45 min of preincubation and during continuous superfusion by DPA.
Optical recording.
An acousto-optical tunable filter (AOTF) was use to control the wavelength (488 nm), amplitude, and duration of illumination by laser light produced from an air-cooled krypton-argon laser (Omnichrome, Melles Griot). The laser light was coupled into a polarization maintaining optical fiber (Point Source) and delivered to a galvanometer mirror-based scan head (Prairie Technologies). The laser light was collimated and adjusted to overfill a 60× objective (1.0 NA, Nikon) to produce a diffraction-limited spot (full width at half maximum of ∼400 nm) in the specimen plane. All optical voltage recordings were made from the illumination spot parked on the plasma membrane guided by a confocal scanned fluorescent image. For cultured cells this was generally in a focal plane several micrometers above the surface of the coverslip. The fluorescence emission was filtered using a 540/80 nm bandpass filter. All the emitted fluorescence was focused onto either a standard side-on multialkali photomultiplier tube (PMT; 3896, Hamamatsu) or a gallium arsenide phosphide-based photocathode PMT (GaAsP PMT; H7422P, Hamamatsu; quantum efficiency ∼45%) whose current output was passed through a discriminator (C3866, Hamamatsu). For all images and some point recordings, a 60 μm pinhole was inserted in a conjugate image plane using a remotely controlled servo motor. Confocal images of labeled HEK-293 cells were made using the multialkali PMT, whereas the GaAsP detector was used for neuronal images. Unless otherwise stated, spot detection fluorescence recordings were performed without the confocal pinhole in place. Spot detection currents produced by the multialkali PMT (used for HEK-293 cells) were directly filtered and acquired as described above. For spot detection measurements in neurons, the voltage output of the discriminator was filtered at 10 kHz using an 8-pole Bessel filter (Frequency Devices) before digitization. This discriminator model can typically count linearly up to 4 MHz. However, increases in signal-to-noise could still be attained by increasing the illumination, and thereby the detected photon flux (range of fluxes were 10–185 MHz). In cases where the photon flux was within this range, signals were corrected for nonlinearities (likely due to missed photon counts). This nonlinearity was estimated by comparing the output voltage of the discriminator versus the current output of a multialkali PMT in response to a range of fluorescence intensities from a 2 μm sample of fluorescein (Sigma) spanning those detected in the experiment. The relationship was well fit by an exponential function and used to correct (scale) the amplitude of optical responses. Correction factors were typically 1.2-fold (max 1.6-fold). Photon acquisition was performed simultaneously with electrophysiological patch pipette recordings as described above.
Data analysis.
Data analysis was performed using the Neuromatic analysis package (www.neuromatic.thinkrandom.com) and custom routines within the IgorPro environment (Wavemetrics). All values are displayed or expressed ±SEM. All statistical tests were performed using a nonparametric Wilcoxon–Mann–Whitney two-sample rank test routine or a Wilcoxon signed-rank test routine for paired comparisons (IgorPro), unless otherwise indicated. Correlations between data were tested using a Pearson correlation test within Excel software package (Microsoft). Only cells with less than a 15 mV voltage offset resulting from the pipette resistance and the membrane current at the end of the 40 ms voltage pulse were used for analysis of ΔF/F versus voltage plots. Reported membrane voltages were not corrected for liquid junction potential. Fluorescence traces were converted to ΔF/F% by subtracting the baseline fluorescence value, F (obtained by averaging over 5 ms before stimulation), from the peak signal value, then dividing by F, and multiplying by 100. For comparison across cell types, values of ΔF/F per 100 mV per AP were calculated by dividing the peak amplitude of fluorescence transients by the ΔV from rest. We judged this normalization to be justified because in neuronal current-clamp, holding potentials spanned −75 to −55 mV and APs peaked at +5 to +28 mV, and between these ranges of voltages, the DiO/DPA response is linear (see Figs. 1, 2; supplemental note 1, available at www.jneurosci.org as supplemental material). For brain slice experiments, the resting fluorescence was adjusted by subtracting the background fluorescence of the slice estimated from a location off the cell but within 10 μm of the recording site. Fluorescence traces were smoothed offline with the binomial smoothing routine such that the final cascaded frequency was 1–3.5 kHz. In most cells, the fluorescence decayed by ∼25% over two components, a rapid (∼2 ms) and slow (∼20 ms) component. This was corrected for by subtracting a double-exponential function to interleaved sweeps without stimuli (see supplemental Fig. 1, available at www.jneurosci.org as supplemental material). For the SNR, we measured the variance over a 5–10 ms window just before stimulation from single trial traces that were filtered to a final frequency of 1 kHz for hippocampal responses and 3.5 kHz for Purkinje cell responses. The SNR was calculated from the peak amplitude divided by the square root of that variance. Weighted decays were calculated from the sum of the amplitude weighted time constants. Values for spontaneous firing frequency were obtained from analysis of 30–60 s periods of spontaneous firing. Confocal images were analyzed using ImageJ (http://rsbweb.nih.gov/ij).
Results
DiO and DPA function together as a FRET-based voltage sensor
Membrane-tethered eGFP (eGFP-F) and DPA have been shown to function together as a voltage-dependent FRET pair in HEKcells, neurons, and muscle fibers (Chanda et al., 2005b; DiFranco et al., 2007; Taraska and Zagotta, 2007), and controlling the distance between them can regulate the efficiency of energy transfer (Taraska and Zagotta, 2007; Sjulson and Miesenböck, 2008). We reasoned, therefore, that DiO [a well established carbocyanine membrane label with a fluorescence emission spectrum very similar to eGFP (Cohen et al., 1974; Honig and Hume, 1986)] might act as a higher-efficiency substitute for eGFP-F because its location within the lipid bilayer (Axelrod, 1979) places it in closer proximity to DPA molecules. To test the performance of the DiO/DPA pair, HEK-293 cells were labeled with DiO-C18 or DiO-C16 by bath application or with a cell-attached patch electrode (see Materials and Methods), resulting in prominent labeling of the plasma membrane as visualized by standard confocal microscopy (Fig. 1 A, left; supplemental Fig. 2, available at www.jneurosci.org as supplemental material). Isolated, cells were labeled, voltage clamped at −70 mV in whole-cell patch mode, and then exposed to 5 μm DPA. Voltage steps were delivered while monitoring fluorescence from a “parked” diffraction-limited illumination spot without the use of a confocal pinhole, similar to detection with stage scanning devices (Escobar et al., 1994; DiGregorio et al., 1999) (λ = 488 nm) (Fig. 1 B, top). Upon depolarization, rapid decreases in fluorescence intensity were observed with a relative fractional change (ΔF/F) as large as −64%. The average change was −56 ± 3% ΔF/F per 100 mV (n = 6) (Fig. 1 D, leftmost bar). Such responses were very stable, indicating that phototoxicity was minimal; hundreds of responses could be elicited over several minutes with no apparent decrement in ΔF/F (supplemental Fig. 3, available at www.jneurosci.org as supplemental material).

Fluorescence changes of DiO/DPA and eGFP/DPA FRET pairs in response to voltage steps. A , Confocal images of a HEK-293 cell labeled by incubation with DiO-C18 (left), and a HEK-293 cell transiently expressing eGFP-F (right). Yellow cross is an example of a typical spot detection site. B , Fluorescence signals in response to voltage steps (indicated above) from cells in whole-cell patch-clamp mode labeled with DiO-C18 (top), eGFP-F (middle), and DiO-C16 (bottom), and superfused with an extracellular solution containing 5 μm DPA (top and middle) or 1 μm DPA (bottom). All traces are averages of five sweeps. Dotted line indicates zero change in fluorescence. C , Summary plots of peak amplitude fluorescence changes within 2 ms of the start of the voltage step. D , Summary bar graph showing average maximal ΔF/F for a 100 mV step from a holding potential (hp) of −70 mV. Black bars, DiO-labeled cells; 5 μm DPA, n = 6; 1 μm DPA, n = 7. Gray bars, eGFP-F cells; 5 μm DPA, n = 5; 1 μm DPA, n = 2.
For comparison we expressed a farnesylated form of eGFP (eGFP-F) in HEK-293 cells (Fig. 1 A, right). As observed previously with this eGFP-F construct, fluorescence appeared on the plasma membrane as well as in intracellular puncta (Chanda et al., 2005a). Fluorescence measurements were made using the same spot detection approach, DPA concentration, and voltage-clamp stimuli as in the experiments described above with DiO as donor (Fig. 1 B, middle). In our hands, the average sensitivity of the eGFP-F/DPA FRET pair was −14 ± 1% ΔF/F per 100 mV (n = 7). These values, in line with prior observations (Chanda et al., 2005a), are approximately fourfold smaller than with DiO as donor (Fig. 1 D, compare left two bars).
In some systems the increased capacitive load caused by 5 μm DPA might lead to distortion/prevention of regenerative APs (Fernández et al., 1983; Chanda et al., 2005a; DiFranco et al., 2007; Sjulson and Miesenböck, 2008). With this in mind we assayed changes in donor fluorescence at 1 μm DPA. Notably, at 1 μm DPA the DiO/DPA pair still reported a larger signal than did eGFP-F/5 μm DPA (DiO, −22 ± 2% ΔF/F per 100 mV, n = 6; eGFP-F, −14 ± 1% per 100 mV, n = 7, p < 0.002) (Fig. 1 D). Indeed, the performance of the DiO/DPA pair places it among the largest signals of any rapid optical voltage reporter.
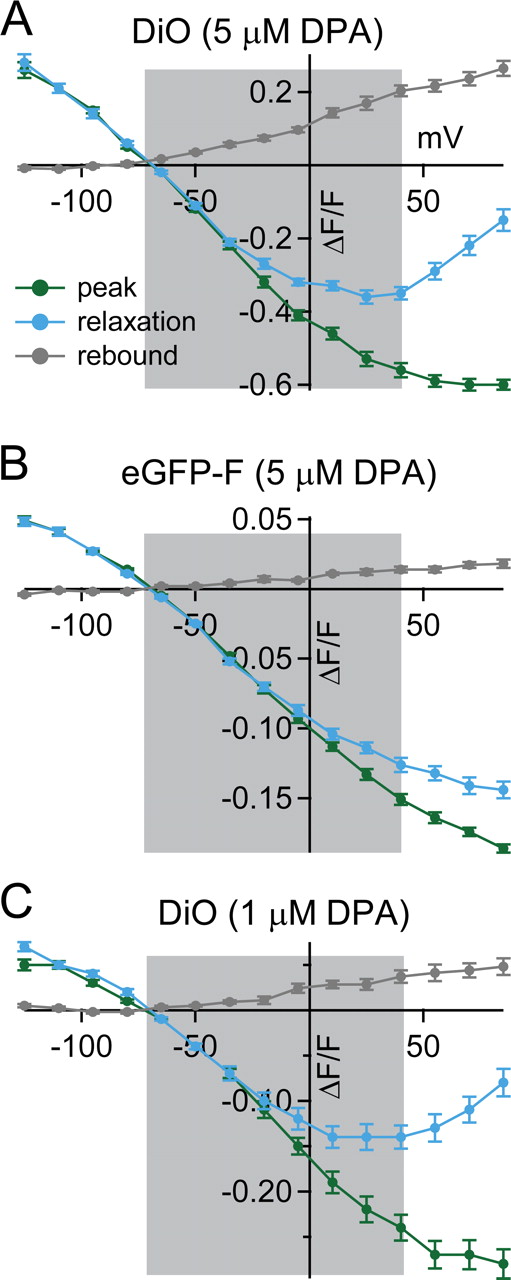
In response to large, sustained, depolarizing voltage steps, the initial rapid quenching response was followed by a slower increase in fluorescence, hereafter referred to as a relaxation. Although apparent with eGFP-F/DPA, these voltage-dependent relaxations were more prominent with DiO/DPA, and measures of pre-steady-state dynamics in 1 and 5 μm DPA showed no differences, indicating that these voltage-dependent behaviors appear to be independent of DPA concentration [Figs. 1 B (top and bottom), 2 A, C]. We quantified this behavior by measuring ΔF/F at the end of the 40 ms pulse and found that relaxations appear when the membrane potential is depolarized from −70 to potentials >0 mV, such that at +85 mV only 20% of the initial quenched signal remained (Fig. 2 A, C, cyan). In responses where a relaxation was evident during the sustained, 40 ms depolarization, an overshoot, or rebound in fluorescence after termination of the voltage stimulus was also present. Additional experiments discussed in the supplemental material (supplemental Figs. 4, 5; supplemental Note 1, available at www.jneurosci.org as supplemental material) are directed at better understanding the mechanism underlying the slow relaxation and overshoot, which have been observed in other systems when two dye components are mobile (Chanda et al., 2005a). These experiments, as well as those shown below, suggest that under physiological conditions the slower mechanism would make a minimal contribution to signals because of the brevity and limited positive voltages attained by typical action potentials (delimited by the gray areas of the panels in Fig. 2). Together, these data indicate that the DiO/DPA FRET pair can report rapid voltage changes over a wide dynamic range from −125 mV to +40 mV, with a maximum ΔF/F per 100 mV of nearly −60%.

Quantification of voltage-dependent relaxation and rebound under sustained voltage steps. Summary plots of fluorescence amplitudes measured at three time points in Figure 1 B: the initial peak signal within 2 ms of voltage step (green), relaxation at the end of the voltage step (cyan), and rebound just following repolarization of the membrane (gray). Shaded gray area indicates the physiological voltage range from −70 mV to +40 mV.
The DiO/DPA FRET pair reports submillisecond voltage changes
To assess whether the DiO/DPA FRET pair would be suitable for detection of AP-like signals, we determined the speed of fluorescence changes in response to voltage steps from −70 mV to +30 mV and ranging from 0.1 to 5 ms in duration (Fig. 3 A). A single-exponential fit of the onset of the fluorescence-quenching resulted in a time constant of 0.12 ms. A series of similar experiments indicated that the quenching speeds could vary widely, but that this variability strongly correlated with the voltage-clamp speed and was independent of the donor (DiO or eGFP-F) or DPA concentration (Fig. 3 B). The fastest fluorescence time constants were ∼0.12 ms (Fig. 3 B). Although this is slightly faster than previous estimates with DPA and membrane-tethered fluorescent proteins (∼0.5 ms) (Chanda et al., 2005b; DiFranco et al., 2007), it is comparable to the speed of DPA movement in other preparations (∼0.1 ms) (Fernández et al., 1983; Lu et al., 1995).

Temporal fidelity of DiO/DPA FRET pair. A , Fluorescence quenching responses to brief depolarizations from a HEK-293 cell bath labeled with DiO and incubated with 1 μm DPA. Membrane potential was stepped to +100 mV from an hp of −70 mV for durations of 0.1, 0.3, 1, 2, and 5 ms, yielding peak ΔF/F amplitudes of −14, −25, −28, −28, and −29%, respectively. Gray trace (τ rise) is a single-exponential fit to the initial quenching response of the 5 ms pulse. Black dashed traces (τ decay) are double-exponential fits of 0.17, 0.29, and 0.38 to the recovery of the quenched fluorescence response following termination of the 0.3, 1, and 5 ms step pulses, respectively. Each trace is an average of 10 sweeps and was filtered offline to 2 kHz. B , Correlation plot of the τ rise of fluorescence (+100 mV pulse for 5 ms) versus the weighted time constant of a double-exponential fit of the capacitance transients in response to a 5 mV step. Dashed line is a linear fit to all the data (Pearson correlation). The y-intercept is 0.12 ms and approximates the intrinsic time constant of the voltage-dependent quenching of the DiO fluorescence. C , Fluorescence quenching responses to trains of 1 ms, 100 mV depolarizations (hp = −70 mV) delivered at various frequencies (1000 Hz stimuli used 0.5 ms pulses). Traces were filtered offline to 3.5 kHz, and are averages of 10 and 15 trials for the 100 Hz and 300 Hz trains, respectively, and 17 trials for both 666 and 1000 Hz. DPA concentration was 1 μm. Inset is an expanded time scale of the 1000 Hz train (calibration: 4 ms, 12% ΔF/F).
The decay of the fluorescence (weighted τ) following brief pulses was also fast and increased slightly with longer pulses from 0.30 ± 0.08 to 0.48 ± 0.08 ms (n = 5), for 0.3 and 5 ms duration pulses, respectively (Fig. 3 A). Also associated with the slowing in the decay was the appearance of small rebound fluorescence (0.7 ± 0.2% ΔF/F for the 5 ms pulses) compared with the maximal drop in fluorescence during the depolarization (−24 ± 0.2% ΔF/F; n = 4). Thus, the DiO/DPA FRET pair can faithfully report brief depolarizations, similar in duration to neuronal APs, with little temporal distortion.
Since many neurons fire in short bursts of APs at frequencies of hundreds of Hz, we examined the accuracy with which the DiO/DPA FRET pair could report brief trains of voltage steps delivered at different frequencies. In response to a 100 Hz train of 1 ms pulses, the amplitude of the 10th pulse decreased by ∼10% compared with the amplitude of the first (Fig. 3 C) (7 ± 2% reduction; n = 12). Decreases were slightly larger for frequencies of 300 and 600 Hz (16 ± 8 and 18 ± 2% reductions, respectively; n = 3). For 1000 Hz, the duration of the pulse was reduced to 0.5 ms and the decrement in the response by the 10th pulse (7 ± 2%; n = 3) was less pronounced than at 600 Hz. Also apparent was a progressive increase in the rebound fluorescence following the termination of the higher-frequency trains (Fig. 3 C), similar to that observed for long step durations in Figure 1. However, for all pulse frequencies the relative amplitude of this rebound was <10% of the peak amplitude. Together, these data indicate that the DiO/DPA FRET pair is suitable for tracking single APs and bursts of APs with little temporal distortion.
The DiO/DPA FRET pair detects AP-like voltage waveforms in single sweeps
To test whether the DiO/DPA FRET pair can be used to detect individual AP-like signals in single sweeps, we applied an AP waveform as a voltage-clamp command to DiO-C16-labeled HEK-293 cells in the presence of 1 μm DPA. In Figure 4 A, the command voltage is superimposed on an inverted, signal-averaged optical response. Consistent with the 1 ms step pulses (Fig. 3), responses to AP-like waveforms were large (−25 ± 3%; n = 4 cells) and faithfully reported the time course of the command voltage. Trains of AP waveforms (Fig. 4 B) elicited brief quenching responses that could easily be detected in single sweeps (Fig. 4 C, left), with an SNR of 7.1 (average across cells 6.1 ± 1.7, n = 4). Signal-averaged responses (Fig. 4 C, right) showed little decrement in the peak amplitude of the optical response to the fifth AP compared with the first (average ratio 1.0 ± 0.03; n = 5 cells, p > 0.5). By comparison, the eGFP-F/DPA FRET pair gave rise to signals that were approximately fourfold smaller given identical stimuli and DPA concentration (Fig. 4 D), making it difficult to detect AP-induced fluorescence changes in single trials under these conditions (SNR 3.9).
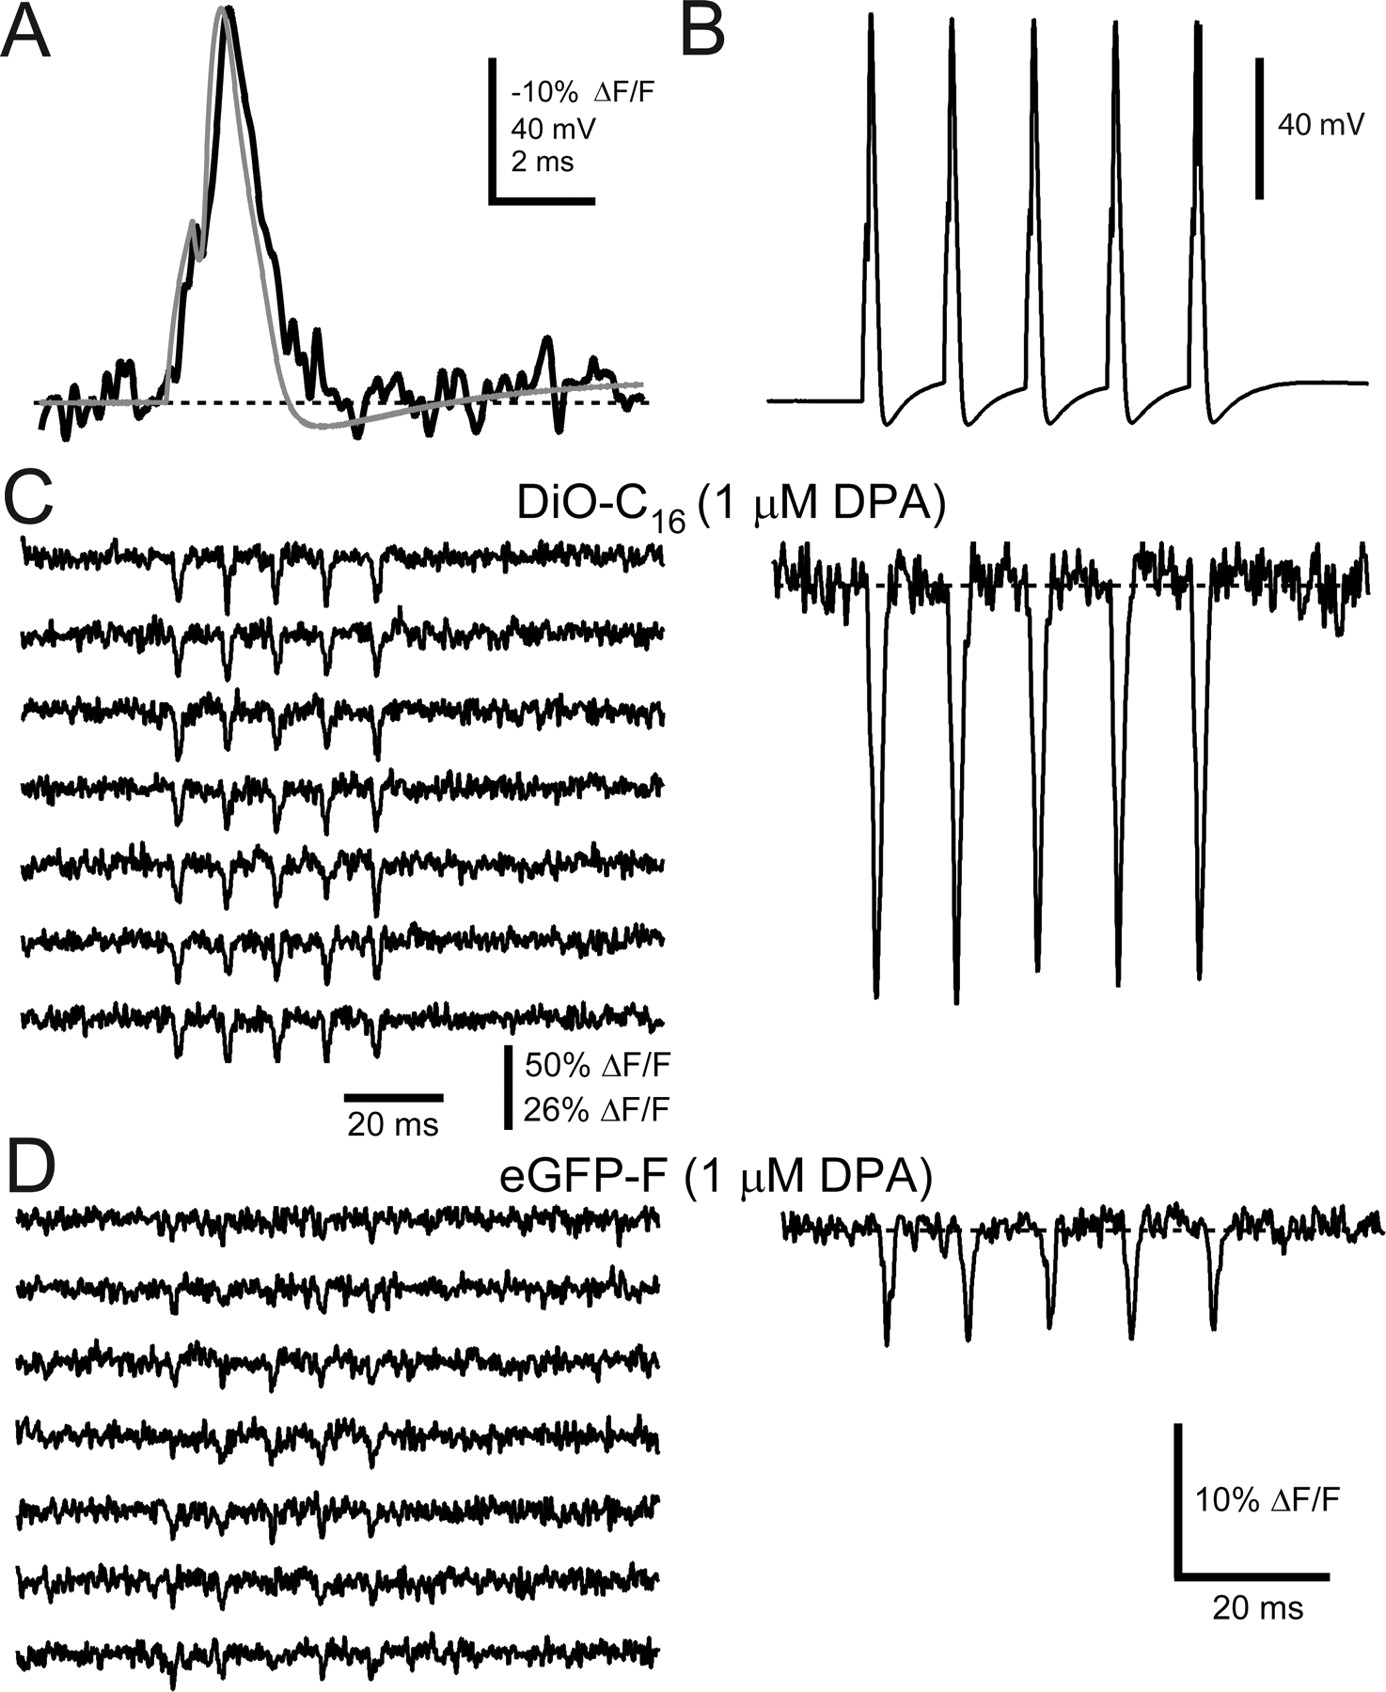
Optical responses of the DiO/DPA FRET pair faithfully follow AP voltage waveforms in single sweeps. A , Averaged fluorescence response (black trace; n = 17 sweeps) from a voltage-clamped HEK-293 cell labeled with DiO-C16 and in the presence of 1 μm DPA to an AP waveform used as command voltage (gray trace). The record was filtered offline to 2 kHz and inverted for comparison to AP waveform. B , 100 Hz AP train waveform used as the command voltage for C and D . C , Seven consecutive fluorescence quenching responses to the train of AP waveforms ( C ), in the presence of 1 μm DPA. Right, The averaged trace (n = 11 sweeps). D , Seven consecutive eGFP-F fluorescence quenching responses to the train of AP waveforms ( B ), in the presence of 1 μm DPA. Right, The averaged trace (n = 11 sweeps). Single sweeps were filtered offline to 1 kHz. Scale bar in the bottom right of D corresponds to averaged traces in C and D .
The DiO/DPA FRET pair reports neuronal APs and subthreshold signals from cultured neurons
A critical test of the DiO/DPA FRET pair is detection of APs in excitable cells. Previous studies in cultured neurons (Chanda et al., 2005a) or skeletal muscle fibers (DiFranco et al., 2007) have shown that DPA concentrations between 5 and 20 μm induce a capacitive load on cell membranes reducing the AP peak amplitude and increasing the AP width. We assayed the effects of 1 μm DPA using current-clamp recordings of cultured hippocampal neurons (Fig. 5 A). By comparing recordings in the absence (n = 12 cells) or preincubated for >10 min in the presence (n = 10 cells) of 1 μm DPA, we found no difference in AP width (p = 0.2) or AP height (p > 0.5) when the resting membrane potentials were similar (p > 0.5). These data indicate that 1 μm DPA would be a suitable concentration to report regenerative APs in this preparation.

The DiO/DPA FRET pair reports high-frequency APs in cultured hippocampal neurons. Properties of APs recorded under current clamp in the presence of DPA are shown. A , Records of APs from two different hippocampal neurons 4 min after the formation of the whole-cell configuration, either in the absence of DPA (left, current injection 2200 pA) or after preincubation in 1 μm DPA for 19 min (right, current injection 1600 pA). Far right, Summary bar graphs of AP properties recorded in the absence of DPA (n = 12 cells) or after the 1 μm DPA preincubation (≥10 min, mean = 20 ± 4 min, n = 10). “WC time” is the average time at which APs were recorded following whole-cell formation, “AP height” is the difference between the peak amplitude and resting potential, and “AP width” is the width of the AP at half its maximal amplitude. No significant differences were observed (p > 0.1). DiO/DPA reports APs in neurons. B , DIC image of the cultured hippocampal neuron and recording pipette (top). Inset, Confocal image of the same neuron and the location of the optical recording (yellow cross) made during a 100 Hz train of current injections (1400 pA) to initiate APs. Shown are electrical recordings (middle) and corresponding optical recordings (bottom). Red traces are averages of six sweeps where there was a failure of AP generation in response to the first current injection. Blue traces are averages of 12 sweeps, where each current pulse successfully generated an AP. C , DiO/DPA reports APs in single trials. APs (red) were evoked by a train of five 1900 pA current pulses at 100 Hz (top). Ten consecutive single sweeps are shown with the average below. Individual sweeps were filtered offline to 1 kHz.
Hippocampal neurons were labeled with DiO-C16 by either bath or pipette methods. Whole-cell current-clamp recordings were used to deliver brief current injections to initiate APs in the presence of 1 μm DPA. In the cell shown in Figure 5 B at 7 min after DPA application, a 100 Hz train of APs elicited transient decreases in fluorescence with peak amplitudes of −16% ΔF/F (Fig. 5 B, traces have been inverted). In this particular cell the holding potential varied slightly from trial to trial such that in 6 of the 18 trials there was a failure of AP generation in response to the first current pulse (Fig. 5 B, middle, red). As indicated in the electrical recordings, APs elicited from the more hyperpolarized resting potential were slightly faster than at the depolarized resting potential (Fig. 5 B, middle, compare red with blue traces). Notably, this slight difference in AP duration was also apparent in the optical recording (Fig. 5 B, bottom, red and blue traces). Indeed, the DiO/DPA fluorescence transients faithfully followed the time course of the electrical membrane potential recording (half-width of membrane potential signals, 2.1 ± 0.7 ms; half-width of fluorescence signals, 2.2 ± 0.9; paired test, p = 0.6). In addition, the SNR of the DiO/DPA FRET signals were large enough so that even subthreshold depolarizations were detected in those sweeps where the first AP failed to be evoked (Fig. 5 B, red). Analysis of AP-elicited DiO/DPA FRET signals indicated an average ΔF/F per 100 mV of −24 ± 2% (n = 7 cells), greater than a sixfold improvement over eGFP-F/DPA FRET (Chanda et al., 2005a). These results demonstrate that the DiO/DPA voltage sensor yields large and rapid fluorescence changes at concentrations of DPA that have negligible effects on AP shape, allowing high-fidelity optical detection of either APs or subthreshold activity.
Another critical test for the DiO/DPA FRET pair is detection of AP signals in single sweeps. The neuronal fluorescence responses shown in Figure 5 C show clearly discernable responses in single trials that, with a peak ΔF/F of −13% and a detected “resting” photon flux [a critical determinant of SNR (Sjulson and Miesenböck, 2007)] before AP stimulation of 29 MHz, produced a signal-to-noise ratio of 6.1. The average SNR across cells was 7.2 ± 0.7 (n = 7; 29 ± 3 MHz resting photon flux). When using a confocal pinhole, the SNR was reduced to 2.9 ± 1.0 (n = 3; 2.6 ± 1.1 MHz resting photon flux), yet the mean signal size improved to −34 ± 3% ΔF/F/100 mV (supplemental Fig. 6, available at www.jneurosci.org as supplemental material). Signal averaged responses with the DiO/DPA FRET pair (Fig. 5 C, bottom black trace) showed that the peak amplitude of the fluorescence transients generated by APs were well maintained throughout trains, indicating that in cultured hippocampal neurons, APs can be monitored optically with high fidelity. This, combined with high sensitivity, makes the DiO/DPA voltage reporter amenable to use with other rapid optical detection devices, such as photodiode arrays and fast CCD cameras (Baker et al., 2005), which enable rapid multisite or multineuron imaging of network activity (Obaid et al., 2004).
The DiO/DPA FRET pair reports evoked neuronal activity in brain slices
To examine the performance of the DiO/DPA FRET pair in situ, Purkinje neurons within a brain slice were labeled with DiO-C16 using a cell-attached configuration (e.g., supplemental Fig. 2, available at www.jneurosci.org as supplemental material). Before labeling, slices were preincubated in DPA for >45 min to ensure the DPA concentration was at equilibrium; DPA was subsequently continuously superfused for the remainder of each experiment. Up to 90% of Purkinje neurons were successfully labeled (i.e., produced preferential membrane labeling) with DiO16 if the labeling solution was made <30 min before patching. Preferential membrane staining of the soma, proximal dendrite, and proximal axon was observed within minutes following establishment of a seal with the membrane (Fig. 6 B). After longer periods (∼15 min), the staining of spine-like structures could also be observed (data not shown). The cell body, however, progressively lost its membrane staining over tens of minutes after the dye-filled pipette was removed (Fig. 6, compare B, C; also see supplemental Fig. 7, and see supplemental note 2, available at www.jneurosci.org as supplemental material). Following staining, a second, dye-free pipette was introduced to obtain a whole-cell recording and to enable simultaneous electrical and optical recordings. The whole-cell recording configuration also permitted spontaneous spiking activity to be silenced by slight hyperpolarization of the membrane potential, and injection of brief current pulses from hyperpolarized resting potentials to induce well timed APs. Under these conditions, and with the illumination spot positioned on the soma membrane, transient decreases in fluorescence were observed in response to single APs in single trials (1 μm DPA) (Fig. 6 C).

The DiO/DPA FRET pair reports simple and complex cerebellar Purkinje neuron activity in brain slices. A , B , DIC ( A ) and confocal fluorescence ( B ) images of a Purkinje neuron located in a brain slice preincubated and superfused with 1 μm DPA and 1 min after cell-attached labeling with DiO-C16. C , Single sweep AP-associated DiO/DPA responses (left) and their average (n = 19; bottom right) obtained from the Purkinje neuron displayed in A and B . Single APs were elicited by whole-cell current injection (2500 pA, 2 ms). Red traces are the current-clamp voltage recordings. Confocal image shows decreased membrane staining 24 min after DiO labeling, and yellow cross indicates the location of optical recordings. Right middle, Two plots of the amplitudes and widths, as a function of time, of the individual electrical (gray) and optical (black) AP recordings (scale of bottom plot is in milliseconds). D , DiO/DPA optical responses to single APs elicited by whole-cell current injection in the presence of 2 μm DPA. Bottom right, An average of 19 responses superimposed on the average electrical recording (red). E , Single and averaged (n = 10) optical responses to complex spike-like bursts elicited by larger current injections (3500 pA, 10 ms) from a different cell. All optical traces shown were filtered offline at 3.5 kHz.
As was the case for the HEK-293 cells (supplemental Fig. 3, available at www.jneurosci.org as supplemental material), many sweeps could be delivered without noticeable photodamage (up to 100, with <5 s intervals): the electrophysiological parameters remained stable following illumination, and there was no evidence of membrane blebbing, significant increase in baseline fluorescence, or decrement in consecutive fluorescence responses. In the cell displayed in Figure 6 C, peak amplitudes and widths of DiO/DPA optical responses were stable over the 20 APs delivered at 5 s intervals (Fig. 6 C, inset). Note that because of the interleaved trials without AP stimuli, the total number of illumination trials was double that indicated in Figure 6 C (inset). On average, DiO/DPA responses to single APs could be stable for >30 min (e.g., supplemental Fig. 7, available at www.jneurosci.org as supplemental material) (n = 3 cells). It is also important to note that of the 90% of neurons showing prominent membrane labeling, all of them produced detectable (>5% ΔF/F) optical responses to APs.
The SNR of the single AP responses (given the peak ΔF/F of −13% and a resting photon flux of 69 MHz) was 5.0. In another cell, the peak ΔF/F was −19% and the resting photon flux was 183 MHz, yielding a larger SNR of 11.4 (2 μm DPA) (Fig. 6 D). On average, the peak amplitude of the fluorescence transients in response to single APs recorded with the spot positioned on somatic membrane was −12 ± 1% ΔF/F for 1 μm DPA (n = 5), which was significantly different from experiments performed in 2 μm DPA (−19 ± 2% ΔF/F, n = 5; p = 0.05). This corresponds to a −19 ± 3% ΔF/F per 100 mV for 1 μm DPA and 26 ± 2% per 100 mV for 2 μm DPA (p = 0.04). The average SNR of single trial AP-associated somatic transients was 4.6 ± 1.2 (70 ± 21 MHz count rate) and 6.8 ± 1.4 (70 ± 29 MHz count rate) for 1 and 2 μm DPA, respectively.
In addition to firing classical APs (often referred to as “simple spikes”), Purkinje neurons also fire “complex spikes,” a characteristic discharge in response to strong depolarization by climbing fiber synaptic inputs (Eccles et al., 1966). Somatic injection of current can elicit complex spike-like responses that are remarkably similar to climbing fiber-evoked complex spikes. Both complex spikes and complex spike-like responses are characterized by high-frequency bursts of decrementing spikelets (Eccles et al., 1966; Llinás and Sugimori, 1980; Khaliq and Raman, 2005; Davie et al., 2008). Figures 6 E and 8 A show examples of single complex spike-like responses elicited by current injections similar in total charge to those found to best reproduce true complex spikes (Davie et al., 2008). As discussed in detail below, our data show that the number and timing of the spikelets in the electrical signal (see Figs. 6 E, 8 A, red traces) were faithfully represented in the optical signals (see Figs. 6 E, 8 A, black traces) in all recorded Purkinje neurons (n = 3). The signal-to-noise ratio of the DiO/DPA FRET pair was sufficiently large that fluorescence responses to single APs as well as high-frequency bursts could be well resolved in single trials.
Examination of Purkinje neuron firing properties in the presence of DPA
To evaluate whether the membrane capacitance added by these concentrations of DPA depresses neuronal activity in slices, we made a series of measurements from Purkinje neurons preincubated in DPA for at least 45 min before recording. We compared single APs recorded in current clamp under control conditions and in 1, 2, or 5 μm DPA and found that DPA concentrations up to 5 μm led to no significant differences in AP amplitude or spike threshold. However, 5 μm DPA led to a moderate yet significant broadening of the AP from 431 to 637 μs (Fig. 7 A, B, Table 1).

DPA does not disrupt firing properties of Purkinje neurons. A , Superimposed whole-cell current-clamp recordings of Purkinje neuron action potentials in response to a 2 ms step current injection. Displayed are single sweeps from three different neurons (black, control; blue, 2 μm DPA; red, 5 μm DPA). Note that the AP duration is prolonged in 5 μm DPA. B , Summary plot of AP duration measurements (full width at half-maximal amplitude) as a function of DPA concentration. Each data point corresponds to a different Purkinje neuron. Horizontal lines indicate mean values. C , Complex spike-like responses elicited with longer/larger current injections (10 ms, 3.5 nA) recorded in the indicated concentrations of DPA. Note that 5 μm DPA is associated with a loss of spikelets in the burst (see also Table 1). D , Extracellular recordings made from Purkinje neurons in slices incubated in control solutions or indicated DPA concentrations. Note that regular spontaneous firing rates are maintained in slices equilibrated in DPA. Vertical scale bar represents 45 pA for control, 15 pA for 1 μm DPA, and 30 pA for 2 and 5 μm DPA; horizontal scale bar is 2 s. E , Cumulative probability plots of Purkinje neuron spontaneous firing rates measured with extracellular electrophysiological methods in control (n = 82 cells) and DPA-treated conditions (1 μm, n = 34; 2 μm n = 34; 5 μm n = 45). All measurements have been made on Purkinje neurons in slices equilibrated in the indicated concentration of DPA for >45 min. No significant differences were observed (pairwise Kolmogorov–Smirnov tests, p > 0.05).
Summary of DPA effects on Purkinje neuron excitability
Interestingly, DPA-treated Purkinje neurons did not require larger current injections to elicit a spike within the 2 ms duration current injection window. We found that the minimal amount of current required to elicit a spike within ∼1.4 ms was the same as for control at all DPA concentrations (Table 1). Notably, these current injections are well within the range of stimuli used in previous studies to elicit well timed spikes in large neurons (Kole and Stuart, 2008; Zhou et al., 2008).
Analyses of complex spike-like responses elicited by longer-duration current injections yielded complementary results in that 1 and 2 μm concentrations of DPA had little effect on excitability. No significant differences compared with control were observed in the numbers of spikelets per burst or spikelet frequency within a burst (Table 1). However, just as for the single AP responses, 5 μm DPA led to a reduction in the number of spikelets and their instantaneous frequency (Fig. 7 C, Table 1). Thus, in cerebellar slices, concentrations of 1–2 μm DPA do not interfere in significant ways with the endogenous generation of APs or complex spike-like responses.
Finally, we exploited the fact that Purkinje neurons engage in spontaneous pacemaking activity in brain slice preparations (Dailey et al., 1994; Häusser and Clark, 1997) to examine the effects of DPA on spontaneous excitability in a minimally invasive manner. Extracellular recordings from individual Purkinje neurons in control versus 1, 2, or 5 μm DPA show that spontaneous spiking is maintained in the presence of DPA (Fig. 7 D). Even at 5 μm, the highest DPA concentration tested, there is only a nonsignificant trend toward a reduced average firing rate (no difference between any groups, one way ANOVA, p = 0.64). The cumulative plots indicate that there was also no significant difference in the distribution of firing frequencies across cells in any DPA concentration when compared with control (Fig. 7 E) (p > 0.05, Kolmogorov–Smirnov test). Together, these data suggest that DPA concentrations necessary for high-fidelity optical detection minimally perturb neuronal electrical properties. Beyond our own work, these observations also suggest that DPA-based optical reporters may be useful over a much broader range than previously suggested from experiments in Drosophila (Sjulson and Miesenböck, 2008).
DiO/DPA voltage signals in neuronal subcompartments
Taking advantage of the high spatial resolution, we positioned the diffraction-limited illumination spot (∼400 nm) on different cellular compartments, and obtained AP or complex spike-like optical signals from somata, dendrites (>10 μm from somata), and axons (>5 μm from somata) of the same Purkinje neuron (Fig. 8; same cell as shown in Fig. 6 D). When comparing complex spikes measured in the soma with those measured in the dendrite, the amplitudes were smaller in the dendrite with a prominent slow charging component (Fig. 8 A), consistent with the lack of invasion of fast spikes into the dendrite (Davie et al., 2008). The largest signals were observed in the axonal compartments (Fig. 8 B). Although we have not explored this further, nonhomogeneity in intracellular labeling or the relative surface to volume differences between these compartments could be contributing factors. When the optical signals were aligned on the basis of the electrical AP signal (Fig. 8 B, bottom right), it was clear that the AP in the axon preceded APs in the soma and dendrites by 100 ± 30 μs (n = 4). Moreover, the width of the optical AP signal in the axon was significantly greater than either the width of signals recorded from the somata or the electrically recorded AP (axon, 580 ± 60 μs, n = 4; soma, 400 ± 20 μs, n = 10; electrical signal, 455 ± 20 μs, n = 10; p < 0.05). These observations are in line with prior electrical measurements in Purkinje neurons, and are consistent with the suggestion that AP initiation occurs in the axon (Stuart and Häusser, 1994). Interestingly, there was also a significant difference between the width of DiO/DPA fluorescence responses to an AP and the width of the corresponding electrically recorded AP (above values, p = 0.01). This is consistent with the electrode-based measurement being influenced by larger membrane regions than the diffraction-limited spot optical measurement (Bean, 2007). The use of a diffraction limited spot to optically monitor membrane potential therefore provides a more localized measurement of electrical signals than can be achieved with electrode-based methods.

Spot detection of soma, dendrite, and axonal voltage responses. A , Averaged optical responses (black traces) to complex spike-like bursts (red traces) recorded from the soma (n = 16 sweeps) and dendrite (n = 13 sweeps) of a Purkinje neuron indicated in the confocal image (yellow crosses). B , Optical responses to single APs recorded from different locations (yellow crosses) within the same cell. Averaged responses from the axon (blue, n = 9 sweeps), soma (black; n = 14), and dendrite (red, n = 10) are shown to the left. Traces have been temporally aligned with respect to the electrically recorded AP and superimposed below the micrograph. Responses were recorded in 2 μm DPA.
Discussion
We describe a novel, FRET-based approach for optical detection of changes in membrane potential. The method relies on energy transfer from a membrane dye (DiO) and a lipophilic anion (DPA) whose membrane partitioning is voltage sensitive. Ironically, DiO was originally synthesized as a potential voltage-sensitive dye, but exhibited no signal (Cohen et al., 1974), and has since been used predominantly for neuroanatomical tracing. Compared with other available methods several features of this approach are worth noting. First, DiO/DPA rapidly reports changes in membrane potential (τ ∼ 120 μs); second, it shows a high sensitivity over the physiological range of membrane voltage within neurons in culture and in brain slices (−17 to −40% ΔF/F per 100 mV for APs); third, there is no apparent phototoxicity; and fourth, DiO has favorable chemical properties (bright signal, rapid dispersion within biological membranes, and negligible fluorescence in aqueous solution). We demonstrate that these properties, combined with laser-illuminated spot detection, represent a very effective method for optical detection of membrane potential from single neurons and/or small neuronal compartments. These same features make the DiO/DPA FRET an attractive methodology for high-throughput screening assays for compounds that give rise to depolarizing or hyperpolarizing changes in membrane potential.
Comparison with existing voltage sensors
The large ΔF/F response to voltage (−56% per 100 mV using 5 μm DPA) is, to our knowledge, the largest reported signal for such a rapid, single photon-activated, fluorescent reporter. The improvement over eGFP-F/DPA may in part be due to a closer proximity of the DiO chromophore to DPA within the plasma membrane. Additional factors, such as a more favorable dipole orientation or a larger quantum yield, may also contribute. Comparison with existing voltage sensor dyes shows that only the dyes ANNINE-6 and ANNINE-6plus yield larger signals, up to 70% ΔF/F per 100 mV for two-photon excitation (Kuhn et al., 2004; Fromherz et al., 2008). These compounds, however, require relatively large illumination intensities that may result in neuronal damage upon repeated measurement and their narrow emission bands limit SNR (Fromherz et al., 2008). Among the dyes used to measure APs within neurons, di-3-ANNEPDHQ produces ∼8% ΔF/F per 100 mV in response to an AP using two-photon excitation (Fisher et al., 2008), while FM4-64 has been reported to produce AP-induced fluorescence changes of ∼8% ΔF/F per 100 mV in cultured cells and brain slices using second harmonic generation (Dombeck et al., 2005). In the latter case, low photon fluxes limit the SNR to <2 for single sweeps (Dombeck et al., 2004, 2005). By comparison, in response to evoked APs in hippocampal neurons, the DiO/DPA FRET pair produces −34% ΔF/F per 100 mV with a SNR of ∼3 under confocal detection and −26 ± 3% ΔF/F per 100 mV with a SNR of ∼7 in nonconfocal mode. In brain slices the sensitivity was slightly reduced to −19 ± 3% ΔF/F per 100 mV (1 μm DPA) and −26 ± 2% (2 μm) with a combined average SNR of ∼6. While all of these dyes have not been compared on the same preparation with identical methods, a comparison in similar experimental contexts (axonal measurement of APs in brain slices) shows slightly higher SNR and larger peak signals for DiO/DPA compared with di-3-ANNEPDHQ (10 vs 39% ΔF/F without the pinhole) [compare Fig. 8 B (blue trace) with Fisher et al. (2008)]. While we have not yet tested whether the DiO/DPA FRET pair will produce signals with a similar sensitivity using two-photon excitation, DiO is readily excited in two-photon mode (Majewska et al., 2000). Two-photon excitation would not only allow for deep tissue imaging but would permit the use of new random access acousto-optic deflector-based scanning devices (Duemani Reddy et al., 2008; Otsu et al., 2008), which are ideally suited for rapid monitoring of single neurons or network activity in three-dimensional space.
Another class of recently described synthetic dye compounds has been used to monitor AP propagation in pyramidal cell dendrites and axons (Antic, 2003; Palmer and Stuart, 2006; Zhou et al., 2007, 2008). The largest signals reported by these dyes have been ∼12% ΔF/F (i.e., the JPW 4090 dye) (Zhou et al., 2007). However, all DiO/DPA data reported here have been collected with diffraction-limited spot illumination, and SNRs have been calculated from single trials, whereas other investigators calculated peak ΔF/F and SNR values from spatially (15–20 μm) and temporally averaged traces. Interestingly, Zhou et al. (2007) have noted decreased photodamage when using spot laser illumination compared with whole-cell illumination; this would also be the case for the submicrometer detection volumes used here.
Regarding speed of response, DPA serves as an extremely rapid voltage sensor in a FRET-based system, yet it is likely slower than the microsecond response times of the commonly used synthetic dyes such as merocyanines (Salzberg et al., 1993) or styryl dyes (Rohr and Salzberg, 1994). It should also be noted that conventional voltage sensitive dyes tend to be linear reporters of membrane voltage, without any visible hysteresis (Cohen and Salzberg, 1978).
Although genetically encoded voltage sensors are extremely desirable, proteins engineered to report voltage have significant shortcomings compared with synthetic dyes. These include relatively small ΔF/F (Sjulson and Miesenböck, 2007), kinetics much slower than single APs (Sjulson and Miesenböck, 2007; Tsutsui et al., 2008), limited dynamic range (Blunck et al., 2005), and intracellular targeting defects resulting in poor or mislocalized expression (Baker et al., 2007). “Hybrid” voltage sensor methods, that is, those that make use of a fluorescent protein combined with DPA (Chanda et al., 2005b; DiFranco et al., 2007; Sjulson and Miesenböck, 2008), show excellent promise due to the combination of high membrane specificity, extremely rapid kinetics (τ < 0.5 ms), and low phototoxicity (Sjulson and Miesenböck, 2007). Improvements to the hybrid voltage sensor method have already been demonstrated by shortening the stretch of amino acids tethering the fluorescent protein to the membrane (Sjulson and Miesenböck, 2008) and by changing the donor from green to cyan fluorescent protein, which increases the spectral overlap with DPA (DiFranco et al., 2007). To date, however, AP-elicited signals have been reported only for cultured neurons (−4% ΔF/F per 100 mV using eGFP-F and 3 μm DPA) (Chanda et al., 2005) and muscle cells (∼7% ΔF/F per 100 mV using eCFP-F and 5 μm DPA) (DiFranco et al., 2007). Attempts to make optical recordings of APs from single neurons in situ in Drosophila have been unsuccessful (Sjulson and Miesenböck, 2008).
Effects of DPA on neuronal excitability
One potential shortcoming of DPA-based methods, and for that matter any method relying on a mobile voltage sensing element located in the transmembrane electric field, arises due to the added electrical capacitance. The measurements of single AP and AP burst parameters as well as spontaneous spiking activity in the present work demonstrate that there is very little effect of 1–2 μm DPA on regenerative excitability in primary neuronal cultures and Purkinje cells in cerebellar slices. These conclusions are in general agreement with prior work. Both the voltage range over which DPA moves and the fractional increase in capacitance within this voltage range have been well documented in various systems in the presence of low micromolar concentrations of DPA (Fernández et al., 1983; Oberhauser and Fernandez, 1995; Chanda et al., 2005a; DiFranco et al., 2007; Sjulson and Miesenböck, 2008). At concentrations of 5–10 μm, DPA depresses regenerative excitability in most cells, as reflected by AP slowing and reductions in peak amplitude (Fernández et al., 1983; Chanda et al., 2005a; DiFranco et al., 2007). In contrast, a recent study concluded that DPA concentrations of 2 μm severely depress axonal excitability in a Drosophila antennal lobe preparation (Sjulson and Miesenböck, 2008). However, to assay excitability this study relied on a synaptopHluorin reporter construct to report exocytosis. Given that DPA might quench synaptopHluorin fluorescence, this reduction may not result from DPA depressing excitability. Other possibilities to explain these discrepant results are that Drosophila neurons are more sensitive to added capacitance by DPA or that they exhibit specific pharmacological sensitivity to DPA (Sjulson and Miesenböck, 2008). Nevertheless, the concentrations of DPA attained in brain slices were sufficient to observe large DiO/DPA FRET responses provided the bath concentration was 2 μm or less. The lack of change in the AP shape also suggests that AP propagation may remain intact since changes in the rate of rise of the AP determine the speed of propagation, as observed for 10 μm DPA (Fernández et al., 1983; Chanda et al., 2005a; DiFranco et al., 2007).
In any event, our observations regarding the limited effects of low micromolar concentrations of DPA on excitability of Purkinje cells in cerebellar slices are encouraging for any DPA-based voltage sensing methods. Although the effects of DPA on each preparation will have to be determined, DPA-based approaches do have an additional advantage over, for example, most transmembrane protein-based sensors in that the capacitive load for a given DPA concentration should be spatially uniform and can be accurately measured (Fernández et al., 1983; Chanda et al., 2005a; DiFranco et al., 2007). Standard computational methods will then prove useful for predicting effects on excitability.
Unique advantages for DiO/DPA as a voltage sensor
In addition to rapid responsiveness and large sensitivity, the DiO/DPA FRET pair has other unique properties. First, depolarization causes decreases in fluorescence from a large resting fluorescence, which is important because in most imaging systems optical signal detection is dependent on the baseline photon flux (Sjulson and Miesenböck, 2007). Second, the brightness of DiO permits detection of rapid changes in membrane potential from subcellular compartments using spot (vs scanning or full field) illumination methods, reducing the excitation load per cell, thereby lowering phototoxicity. Finally, a number of different DiO labeling methods exist, which yield rapid diffusion of DiO in plasma membranes within tens of minutes. Although in certain contexts it is challenging to obtain labeling confined to surface membranes (see Materials and Methods), prior studies have used ballistic methods (Gan et al., 2000; O'Brien and Lummis, 2006) or protocols resulting in anterograde and retrograde staining of specific groups of neurons (Lichtman and Fraser, 2001; Ratzliff et al., 2004). Notably, these methods do not perturb neuronal function and in fact have enabled time-lapse microscopy of living neurons over extended time periods (Lichtman and Fraser, 2001). Thus, the DiO/DPA FRET pair may serve as an attractive nongenetic approach to sparsely label operationally defined groups of neurons within tissue and may prove useful in the study of neuronal networks in genetically intractable contexts such as primates (Luo et al., 2008).
Footnotes
-
This work was supported by the Centre National de la Recherche Scientifique through the Actions Thématiques et Incitatives sur Programme, Fondation Fyssen, Fondation pour la Recherche Medicale, Federation pour la Recherche sur le Cerveau, European Commission FP6 Specific Targeted Project LSHM-CT-2007-037765 (D.A.D.), and National Institutes of Health Grants NS49238 (T.S.O.) and NS058280 (R.L.). J.B. was partially funded by Fondation pour la Recherche Medicale and École des Neurosciences Paris Île-de-France. We thank A. Marty and D. Ogden for valuable discussions and guidance; A. Marty and Boris Barbour for critical reading of the manuscript; Gregory Gauvain, Sabine Lévi, and Jean Christophe Poncer for preparation of the hippocampal cultures; Jason Rothman for help with Neuromatic; and Patricia Araj for assistance with analysis. J.B. performed the HEK cell experiments. R.L. did the experiments examining neuronal excitability in cerebellar slices. T.O. conceived of the use of DiO as a donor, and with D.D., performed all other experiments on slices. D.D. performed the experiments on hippocampal cultures and some on HEK cells. J.B., T.O., and D.D. contributed to writing the manuscript.
- Correspondence should be addressed to David A. DiGregorio, Centre National de la Recherche Scientifique UMR8118, Laboratoire de Physiologie Cérébrale, Université Paris Descartes, 45 rue des Saints Pères, 75006 Paris, France. david.digregorio{at}univ-paris5.fr


