

Abstract
Fura-2 recording of Ca2+ influx was used to show that incubation in 1 μm nicotine (2-6 d) upregulates several pharmacological components of acetylcholine (ACh) responses in ventral midbrain cultures, including a MLA-resistant, DHβE-sensitive component that presumably corresponds to α4β2 receptors. To study changes in α4β2 receptor levels and assembly during this upregulation, we incorporated yellow and cyan fluorescent proteins (YFPs and CFPs) into the α4 or β2 M3-M4 intracellular loops, and these subunits were coexpressed in human embryonic kidney (HEK) 293T cells and cultured ventral midbrain neurons. The fluorescent receptors resembled wild-type receptors in maximal responses to ACh, dose-response relations, ACh-induced Ca2+ influx, and somatic and dendritic distribution. Transfected midbrain neurons that were exposed to nicotine (1 d) displayed greater levels of fluorescent α4 and β2 nicotinic ACh receptor (nAChR) subunits. As expected from the hetero-multimeric nature of α4β2 receptors, coexpression of the α4-YFP and β2-CFP subunits resulted in robust fluorescence resonance energy transfer (FRET), with a FRET efficiency of 22%. In midbrain neurons, dendritic α4β2 nAChRs displayed greater FRET than receptors inside the soma, and in HEK293T cells, a similar increase was noted for receptors that were translocated to the surface during PKC stimulation. When cultured transfected midbrain neurons were incubated in 1 μm nicotine, there was increased FRET in the cell body, denoting increased assembly of α4β2 receptors. Thus, changes in α4β2 receptor assembly play a role in the regulation of α4β2 levels and responses in both clonal cell lines and midbrain neurons, and the regulation may result from Ca2+-stimulated pathways.
Introduction
Increased nicotinic receptor levels are measured in tobacco smokers and in animals exposed chronically to nicotine (Marks et al., 1992; Breese et al., 1997; Perry et al., 1999). Several incisive reviews suggest that this upregulation plays a role in nicotine addiction (Dani and Heinemann, 1996; Buisson and Bertrand, 2002; Mansvelder and McGehee, 2002). Critical evaluation of this hypothesis is not yet possible, because we do not know whether this increase in nicotinic receptor levels is accompanied by increased receptor function, by decreased receptor function, or by no change.
Important clues are presented by the findings that, in clonal cell lines and Xenopus oocytes expressing nicotinic receptor subunits, exposure to nicotine does produce upregulation of functional receptors (Peng et al., 1994; Whiteaker et al., 1998; Buisson and Bertrand, 2001). One study indicates that both levels and function of α7 receptors increase in cultured chick cortical neurons during chronic exposure to nicotine (Kawai and Berg, 2001). Because the regulation of ion channels is likely to vary among cell types, however, it is important to test for such functional upregulation with other relevant nicotinic receptor subtypes and with other neurons of interest. We have chosen to study the mesolimbic system, because it is a major common target for nicotine and others drugs of abuse (Stolerman and Shoaib, 1991; Dani and Heinemann, 1996).
Which nicotinic receptors should one monitor? This study concentrates on α4β2 receptors, because receptors containing α4 and β2 nicotinic subunits comprise the most abundant nicotinic subunits in the brain and are most sensitive to nicotine (Wonnacott, 1990). Nicotine binding is much reduced in mice lacking the α4 nicotinic subunit (Marubio et al., 1999). β2 subunit-containing nicotinic receptors are responsible for mediating nicotine self-administration in mice, nicotine-elicited currents from midbrain neurons, and increased dopamine release in the mesolimbic dopamine system (Picciotto et al., 1998). Dopaminergic neurons express several other nicotinic acetylcholine receptor (nAChR) subunits, including, α2, α3, α5, α6, α7, and β3 (Di Chiara, 2000; Klink et al., 2001). Altered nicotinic receptor function is also implicated in several disorders such as epilepsy (Steinlein et al., 1995; Figl et al., 1998; Bertrand et al., 2002), Parkinson's disease (Banerjee et al., 2000; Martin-Ruiz et al., 2000), schizophrenia (Durany et al., 2000), and Alzheimer's disease (Court et al., 2000).
This paper gathers new data about the regulation of α4β2 nicotinic receptors by combining four types of in vivo measurements: (1) electrophysiology, (2) visualization of fluorescently labeled receptors; (3) fluorescence resonance energy transfer (FRET) between receptor subunits; and (4) fura-2 measurements of Ca2+ influx. We chose to design, test, and measure fluorescent α4 and β2 subunits both because there is no α4β2 counterpart of the convenient α7 ligand, α-bungarotoxin, and because fluorescent subunits can be detected in real time while still functional.
We expected that FRET measurements in particular would be more sensitive for hetero-oligomeric channels (Riven et al., 2003) such as the α4β2 receptor than for homomeric ion channels, because it is possible to place donor or acceptor fluorophores in all subunits of each channel (although we acknowledge some ambiguity because the receptors might have either (α4)2(β2)3 or (α4)3(β22) stoichiometry (Nelson et al., 2003)). The data presented here fulfill this expectation. The efficiency of FRET varies inversely with the sixth power of distance separating the two fluorophores, and we have used this sensitive measure of distance to assess the fraction of assembled versus unassembled receptors. These fluorescently tagged α4β2 nicotinic receptor subunits now reveal that nicotine-induced nAChR assembly occurs primarily in the soma of midbrain neurons.
Materials and Methods
cDNA constructs of fluorescently tagged nicotinic subunits. Mouse α4 and β2 nAChR cDNAs were kindly provided by Jerry Stitzel (University of Michigan, Ann Arbor, MI). Both α4 and β2 were inserted in the EcoRI site of the pCI-neo vector (Promega, Madison, WI) in the T7 orientation. Yellow fluorescent protein (YFP) was inserted in frame into the N terminus of α4. YFP (Clontech, BD Biosciences, Bedford, MA) and an upstream hemagglutinin (HA) epitope tag were inserted three amino acids (aa) downstream from the putative signal peptide sequence (after residue 34) (Fig. 1A). The XmaI in the multiple cloning region of pCI-neo was removed by cutting with NotI and XbaI. DNA polymerase I Large Fragment (Klenow) was used to fill in the 5′ overhangs, and a blunt-end ligation was performed. For one upstream linker of YFP, the forward primer 5′-TTT TCC CGG GAA TAT CCT TAT GAC GTC CCA GAC TAC GCC ATG GTG AGC AAG GGC GAG GAG CTG-3′ and the reverse primer 5′-AAA AGG CGT AGT CTG GGA CGT CAT AAG GAT ACC CGG GTC TTG TAC AGC TCG TCC ATG CCG AG-3′ were used to amplify by PCR pEYFP-N1 (Clontech, BD Biosciences). To create YFP with two flanking linkers with an upstream HA tag, the forward primer 5′-TTT TCC CGG GAA TAT CCT TAT GAC GTC CCA GAC TAC GCC CCT GAC GCC ATG GTG AGC AAG GGC GAG GAG CTG-3′ and the reverse primer 5′-AAA AGG CGT AGT CTG GGA CGT CAT AAG GAT ACC CGG GTG TCA GGG TCA TAT GGG GCA TAG TAG ACC TTG TAC AGC TGG TCC ATG CCG AG-3′ were used to amplify pEYFP-N1 by PCR. In both constructs, the PCR insert products and the vectors were cut with XmaI. The vector was dephosphorylated with shrimp alkaline phosphatase (SAP) and ligated to the insert.

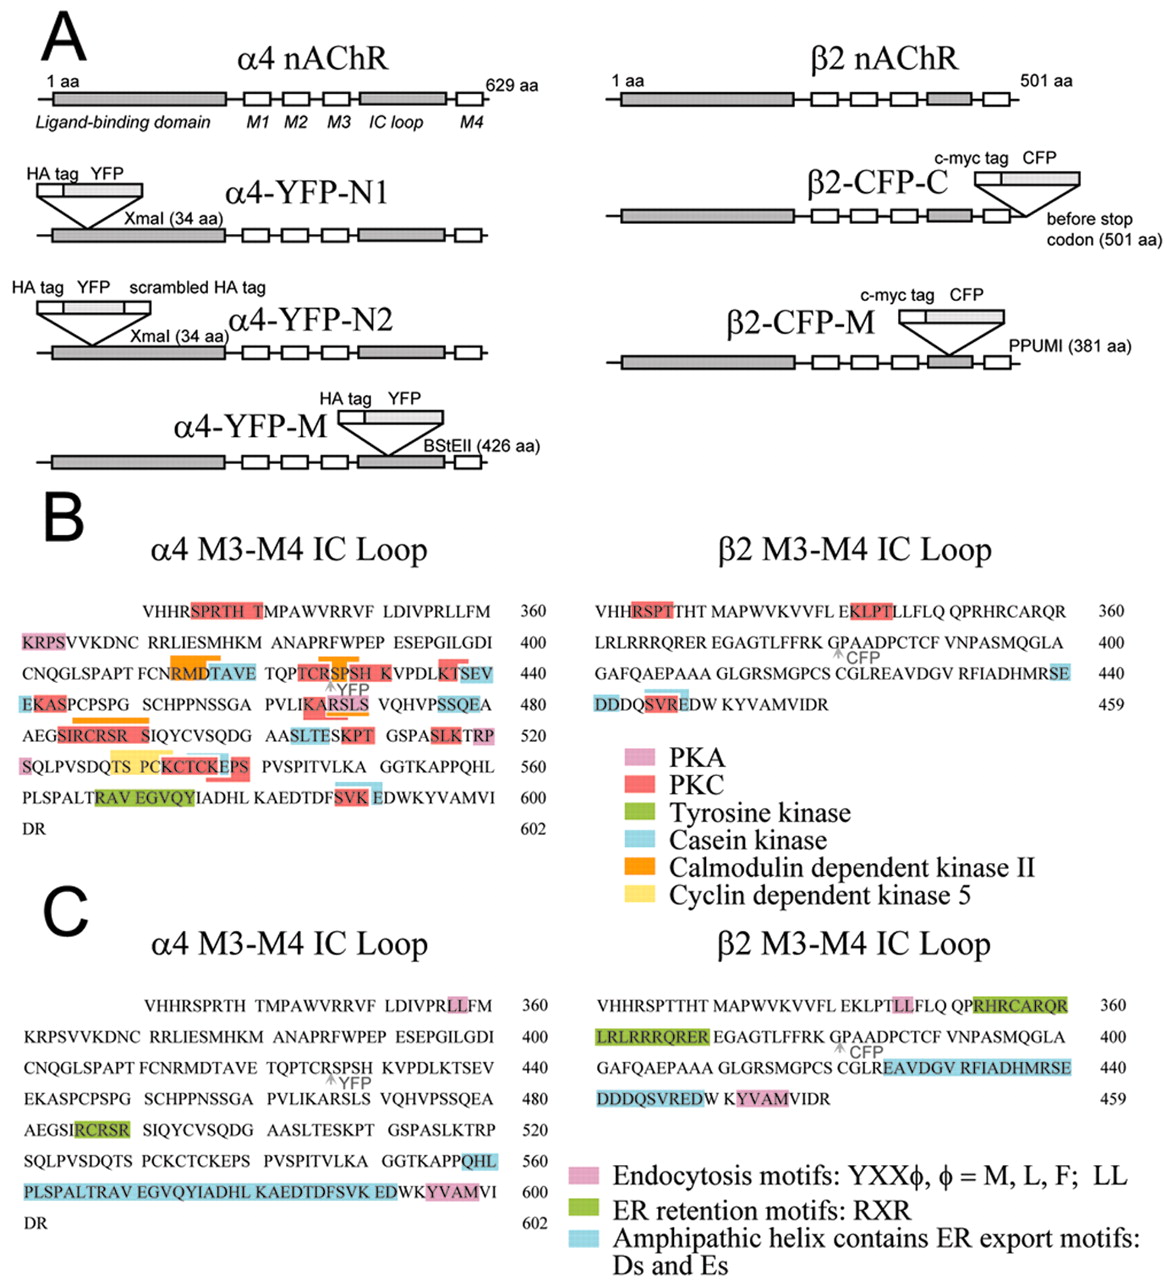
Designs of fluorescently tagged α4 and β2 nAChR subunits. A, Nomenclature of the various α4-YFP and β2-CFP chimeric constructs and their diagrams illustrating the location of insertion of the fluorescent protein within the nAChR subunit. (1) YFP with an upstream HA epitope tag was inserted near the N terminus, three amino acids downstream after the putative signal sequence (α4-YFP-N1). (2) YFP with an upstream HA epitope tag and a downstream scrambled HA epitope tag was inserted near the N terminus, three residues downstream after the putative signal sequence (α4-YFP-N2). (3) YFP with an upstream HA epitope tag was inserted into BstEII restriction site of the M3-M4 loop at amino acid position 426 (α4-YFP-M). (4) CFP with an upstream c-myc epitope tag was inserted into PpuMI restriction site of the (M3-M4) loop at residue 381 (β2-CFP-M). (5) CFP with an upstream c-myc epitope tag was inserted one amino acid upstream of the terminal codon of β2 (β2-CFP-C). B, Putative phosphorylation motifs in the M3-M4 intracellular loops of α4 and β2. Phosphorylation motifs were from ScanProsite (http://ca.expasy.org/cgi-bin/scanprosite) and from Pearson and Kemp (1991). Locations of insertion of YFP and CFP in the cytoplasmic loop sequences of α4 andβ2, respectively, are indicated by arrowheads. C, Putative trafficking motifs in the M3-M4 intracellular loops of α4 and β2.
Cyan fluorescent protein (CFP) (Clontech, BD Biosciences) was inserted in frame into the C terminus of β2. AgeI restriction site was introduced one residue upstream of the terminal codon of β2 by site-directed mutagenesis (QuickChange; Stratagene, La Jolla, CA) using the forward primer 5′-C TCA GCT CCC AGC TCC AAG ACC GGT TGA GGT CTC TCA TTT GCA G-3′ and the reverse primer 5′-C TGC AAA TGA GAG ACC TCA ACC GGT CTT GGA GCT GGG AGC TGA G-3′. To create the CFP insert with an upstream c-myc tag, the forward primer 5′-TTTT ACC GGT GAG CAG AAG CTG ATC TCA GAG GAG GAT CTG ATG GTG AGC AAG GGC GAG GAG CTG-3′ and the reverse primer 5′-AAAA CAG ATC CTC CTC TGA GAT CAG CTT CTG CTC ACC GGT CTT GTA CAG CTC GTC CAT GCC GAG-3′ were used in PCR to amplify pECFP-N1 (Clontech, BD Biosciences). Both insert and vector were cut with AgeI. The vector containing β2 was dephosphorylated with SAP and ligated to the insert.
YFP was introduced in frame into the BstEII site in the M3-M4 intracellular loop of α4. YFP with an upstream HA epitope tag was inserted after residue 426 of the α4 protein. The α4 vector was cut with BstEII and dephosphorylated. PEYFP-N1 was amplified by PCR using the forward primer 5′-TTT TGG TCA CCC TAT CCT TAT GAC GTC CCA GAC TAC GCC ATG GTG AGC AAG GGC GAG GAG CTG-3′ and the reverse primer 5′-AAAA GGC GTA GTC TGG GAC GTC ATA AGG ATA GG TGA CCT CTT GTA CAG CTC GTC CAT GCC GAG-3′. The YFP PCR product was cut with BstEII and ligated to the α4 vector.
CFP was inserted into the M3-M4 loop of β2. CFP with an upstream c-myc tag was introduced in frame into the PpuMI restriction site, which is at amino acid position 381 of β2. β2 was cut with PpuMI and dephosphorylated with SAP. The pECFP-N1 insert was amplified by PCR using the forward primer 5′-TTTT A GGT CCT GAG CAG AAG CTG ATC TCA GAG GAG GAT CTG ATG GTG AGC AAG GGC GAG GAG CTG-3′ and the reverse primer 5′-AAAA CAG ATC CTC CTC TGA GAT CAG CTT CTG CTC AGG ACC TTT CTT GTA CAG CTC GTC CAT GCC GAG-3′. The PCR-amplified CFP product was cut with PpuMI and ligated to the β2-containing vector. All cDNA constructs were verified by sequencing.
The long intracellular M3-M4 loop of both subunits contains several motifs that may play a role in receptor function: putative phosphorylation sites (Fenster et al., 1999; Guo and Wecker, 2002) and potential trafficking signals (Williams et al., 1998). In designing the subunits that contained fluorescent tags in the M3-M4 loop, we avoided regions that included phosphorylation motifs (PKC, cAMP-dependent protein kinase, tyrosine kinase, casein kinase, calmodulin-dependent kinase, cyclin-dependent kinase 5), although one of four putative calmodulin kinase motifs was disrupted in α4-YFP-M (Fig. 1 B). We also avoided putative endocytosis motifs (D'Hondt et al., 2000), endoplasmic reticulum (ER) retention motifs (Zerangue et al., 1999), and ER export signals (Ma et al., 2001, 2002) (Fig. 1C). We found no apparent post-Golgi surface-promoting signal. Also we avoided the negatively charged amphipathic helix that may line the permeation pathway (Miyazawa et al., 1999).
HEK293T cell transfection. HEK293T cells were maintained in DMEM high-glucose medium supplemented with 10% fetal calf serum, 2 mml-glutamine, 100 U/ml penicillin, and 100 μg/ml streptomycin. Cells were plated onto 35 mm Petri dishes with glass coverslip bottoms that were coated with 1% gelatin in PBS, incubated at 37°C in an incubator until they were 60-70% confluent, and then transiently transfected using either TransFast (Promega) or Lipofectamine 2000 (Invitrogen, Carlsbad, CA). In both cases, for each dish, 1 μg of cDNA was mixed with the transfection reagent and medium according to the manufacturer's protocol. Experiments were performed 2-3 d later.
Electrophysiology. The cells were visualized under Hoffman modulation contrast illumination with an inverted microscope [Olympus IMT-2, DPlan 10× 0.25 numerical aperture (NA) and MPlan 60× 0.70 NA)] under fluorescence illumination (Hg lamp) to identify cells transfected with GFP or the fluorescently tagged nicotinic receptors. Patch electrodes (3-6 MΩ) were filled with pipette solutions containing (in mm): 88 KH2PO4, 4.5 MgCl2, 0.9 EGTA, 9 HEPES, 0.4 CaCl2, 14 creatine phosphate (Tris salt), 4 Mg-ATP, 0.3 GTP (Tris salt), pH 7.4 with KOH. The extracellular solution (ECS) was (in mm): 150 NaCl, 4 KCl, 2 CaCl2, 2 MgCl2, 10 HEPES, and 10 d-glucose, pH 7.4. Atropine (1 μm) was included in the ECS to block muscarinic ACh receptors. In patch recordings of midbrain neurons, sodium channels, NMDA, AMPA, and GABAA receptors were blocked by 0.5 μm TTX, 50 μm AP5, 10 μm CNQX, and 20 μm bicuculline. Standard whole-cell recordings were made using an Axopatch 1-D amplifier, low-pass filtered at 2-5 kHz, and digitized on-line at 20 kHz (pClamp 8; Axon Instruments, Foster City, CA). Series resistance was compensated 80%, and the membrane potential was held at -60 mV. Recorded potentials were corrected for junction potential.
ACh was delivered using a two-barrel glass theta tube (outer diameter ∼200 μm; pulled from 1.5 mm diameter theta borosilicate tubing) connected to a piezo-electric translator (Burleigh LSS-3100, Fishers, NY). Each barrel of the theta tube was fed from a 12-way manifold. This allowed up to 12 different solutions to be fed in either the control or agonist barrel. Agonists were applied for 50 msec, which was triggered by pCLAMP 8 software. The voltage input to the high-voltage amplifier (Burleigh PZ-150M) used to drive the piezo translator was filtered at 150 Hz by an eight-pole Bessel filter (Frequency Devices, Haverhill, MA) to reduce oscillations from rapid pipette movement. Solution exchange rates measured from open tip junction potential changes during application with 10% ECS were typically ∼300 μsec (10-90% peak time).
Calcium imaging. HEK293T cells were loaded in the dark for 1 hr with fura-2 AM (1.25 μm) in pluronic acid (0.01%). During imaging, cells were perfused continuously with extracellular solution. Images were obtained with an inverted fluorescence microscope (IX71 Olympus; Lambda LS 175 W Xe arc lamp; Sutter Instrument Co., Novato, CA). Ratio images were obtained by acquiring pairs of images at alternate excitation wavelengths (340/380 nm, Lambda 10-2 filter wheel, Sutter Instrument Co) with an 80 nm bandpass emission centered at 510 nm. Images were collected with a 40× oil immersion objective (UApo/340 1.35 NA) and captured (one pair per 2 sec) on a Photometrics Cascade CCD camera (16 bit resolution; Photometrics, Tucson, AZ) under the control of Slidebook 4.0 imaging software (Intelligent Imaging Innovations, Denver, CO).
ECSs with [methyllycaconitine (MLA) or dihydro-β-erythroidine (DHβE) + MLA] and without nicotinic receptor blockers were delivered via bath perfusion using a peristaltic pump. For imaging in midbrain neurons, sodium channels, NMDA, AMPA, and GABAA receptors were blocked by including 0.5 μm TTX, 50 μm AP5, 10 μm CNQX, and 20 μm bicuculline in the bath perfusate. The agonist ACh (300 μm) was delivered for either 2 or 5 sec using a U-tube. A silica tube (150 μm inner diameter and 360 μm outer diameter; TSP150375; Polymicro Technologies, Phoenix, AZ) emanated from the pore of the U-tube and directed agonist outflow. Negative pressure was constantly applied to the U-tube to prevent agonist leakage and desensitization of receptors. For this reason, agonists were applied for at least 2 sec to overcome the delay (∼500 msec) in delivery of agonist produced by the negative pressure. The agonist delivery via the U-tube was tested each day before and intermittently during the experiment by visual inspection of the output of phenol red added to the ECS.
Selection of optimal fluorescently labeled constructs in HEK293 cells. We compared the functional expression of the fluorescently tagged receptors with that of wild type (WT) by recording voltage-clamp currents induced by 300 μm ACh in HEK293T cells. This ACh concentration elicited currents from several of the fluorescently tagged receptor constructs (Fig. 2 A), and all of the responses were antagonized reversibly by DHβE (10 μm). At the peak of the response waveform, the WT α4β2 response was 396 ± 86 pA (Fig. 2 B). The α4-YFP-M β2 response (206 ± 62 pA) was 52% of the WT value. The α4 β2-CFP-M (613 ± 169 pA) and the (α4-YFP-M)(β2-CFP-M) responses (641 ± 275 pA) were actually larger than the WT response (155 and 162%, respectively), but not significantly so. Constructs with fluorescent proteins outside the M3-M4 loop function less well (Fig. 2 B). The N-terminal α4-YFP (two flanking linkers) β2 receptor displayed no observable ACh response. The peak N-terminal α4-YFP β2 response was much smaller than for WT, but nonetheless measurable (41 ± 12 pA). Inserting CFP into the C terminus of β2 reduced the ACh response by 80% (81 ± 15 pA), relative to the WT. We compared the waveforms of the (α4-YFP-M)(β2-CFP-M) and WT ACh-induced currents. We found no differences. The (α4-YFP-M)(β2-CFP-M) and WT responses had decay time constants of 183 ± 45 msec (n = 5) and 159 ± 32 msec (n = 6), respectively. Furthermore, the total charge carried by WT α4β2 and (α4-YFP-M)(β2-CFP-M) currents did not differ significantly (140 ± 55 and 103 ± 24 pC, respectively; p = 0.6; t test).

Whole-cell recordings and fura-2 recordings of Ca2+ accumulation for the various fluorescently tagged nicotinic receptor constructs expressed in HEK293T cells. ACh (300 μm) was applied every 60 sec (duration 50 msec). A, Exemplar ACh-induced currents of each of the fluorescently tagged chimeras. Currents were inhibited with continuous coapplication of the competitive antagonist DHβE (10 μm) and recovered during washing. B, Peak current response with 300 μm ACh of the fluorescently tagged and WT α4β2 receptors. Numbers represent mean ± SEM. Asterisks represent a significant difference (p < 0.05) as compared with WT. Ratiometric measurements (F340/F380) of fura-2 AM loaded in HEK293T cells show that intracellular calcium rises during a 5 sec application of 300 μm ACh for WT α4β2, α4-YFP-M β2, and α4 β2-CFP-M (C). Application of 300 μm ACh to cells expressing α4-YFP-N1 β2 and α4 β2-CFP-C showed no change in levels of intracellular calcium. Each trace represents a single cell. D, Box plot of peak calcium fluxes for each of the fluorescently labeled constructs. Bottom, middle, and top line of the box represents 25%, median, and 75%, respectively. Bottom error bar represents 5%, and the top error bar represents 95%. Asterisks represent a significant difference (p < 0.05) as compared with WT.
We also compared Ca2+ flux through the fluorescently tagged nAChR constructs by ratiometric imaging of fura-2 AM in HEK293T cells. We found essentially normal responses for the constructs with fluorescent proteins in the M3-M4 loop. Application of 300 μm ACh for 5 sec resulted in detectable rises in intracellular calcium for these M3-M4 loop constructs (Fig. 2C). The activation of WT α4β2 nAChRs produced a 9.4% (7.0, 20.5%) [median (25th, 75th percentile)] increase in intracellular Ca2+ (Fig. 2 D). The α4-YFP-M β2 receptor displayed a comparable increase in intracellular Ca2+ (7.4, 4.9, 10.9%). Cells expressing the α4 β2-CFP-M receptor showed increases in intracellular calcium of 15.1% (13.5, 19.3%).
On the other hand, cells with the N-terminal α4-YFP and C-terminal β2-CFP constructs displayed no significant ACh-induced Ca2+ increases. These results are consistent with the electrophysiological data and demonstrate that the insertion of fluorescent proteins in the N-terminal and C-terminal positions of α4 and β2 nicotinic subunits impairs the ACh response of the receptors.
To compare ACh sensitivity of the M3-M4 constructs (α4-YFP-M, β2-CFP-M) with that of the WT, we measured their ACh concentration-response relations (Fig. 3). In all cases, the ACh responses peaked at 1 mm and decreased at 3 mm (data not shown), presumably because of open channel block by ACh at high concentrations. The concentration-response relations were fitted with the sum of two Hill equations (Buisson and Bertrand, 2001). Similar to previous results (Buisson and Bertrand, 2001), for WT α4β2 the high-affinity EC50 was 1.9 ± 1.2 μm (mean ± SEM), and the low-affinity EC50 was 228 ± 85 μm (Fig. 3A). The higher- and lower-affinity components of the dose-response relations probably represent populations of nicotinic receptors with stoichiometry (α4)2(β2)3 and (α4)3(β2)2, respectively (Nelson et al., 2003). The fluorescently tagged nicotinic receptors showed minimal changes in the high- and low-affinity EC50 for ACh (Fig. 3B-D).

ACh dose-response relations for WT and fluorescently taggedα4β2 nAChRs. ACh dose-response relations for WT α4β2 (A), α4-YFP-M β2 (B), α4 β2-CFP-M (C), and (α4-YFP-M)(β2-CFP-M) (D) nicotinic receptor constructs. The top traces of each panel are the evoked currents (ACh in micromolar). The fluorescently tagged constructs resemble WT in their sensitivity to ACh.
Mesencephalic dopaminergic neuronal culture and transfection. Brain tissue containing primary mesencephalic neurons of the ventral tegmental area from embryonic day 14 BDF1 mouse embryos (Shimoda et al., 1992) was incubated in plating medium (Neurobasal, 2% B27, 0.5 mm glutamax, 5% horse serum) with 1 mg/ml papain at 37°C for 20 min. The digested tissue was mechanically dispersed, laid on 5% bovine serum albumin (Fraction V; Sigma, St. Louis, MO) in PBS, spun for 6 min at 300 × g, and resuspended in plating medium. Cells (∼150,000) were plated onto 35 mm Petri dishes with glass coverslip bottoms (MatTek Corp., Ashland, MA) that were coated with polyethyleneimine (CC-4195; BioWhittaker, Walkersville, MD) in borate buffer (CC-4196; BioWhittaker) and laminin (Sigma).
To transfect neurons, 1 μg of each cDNA was mixed with 120 μg of Nupherin-neuron (Biomol Research Laboratories, Plymouth Meeting, PA) in 400 μl of Neurobasal medium without phenol red; 3 μl of Lipofectamine 2000 was mixed in 400 μl of Neurobasal media. The two solutions were incubated for 15 min at room temperature, combined, and incubated for another 45 min at room temperature. The medium of the mesencephalic cultures was replaced with plating medium without serum, and the transfection medium was added. The culture dishes were spun at 250 × g for 5 min on a swinging bucket centrifuge and incubated for 30 min at 37°C. Then the transfection mixture was removed and replaced with the original medium. Experiments were performed on the cells 1-8 d after transfection.
Immunocytochemistry. Mesencephalic cultures were washed in PBS and fixed in chilled 4% paraformaldehyde in PBS. Cultures were rinsed twice for 10 min with PBS and then permeabilized with 0.25% Triton X-100 in PBS for 5 min. Cultures were rinsed twice for 5 min with PBS and blocked with 10% donkey serum (Jackson ImmunoResearch Laboratories, West Grove, PA) in PBS for 30 min at 37°C. The primary antibody was diluted in 3% donkey serum in PBS and incubated for 1 hr at 37°C. Cultures were then washed three times for 5 min with PBS. The secondary antibody was diluted in 3% donkey serum in PBS and incubated for 1 hr at 37°C. Finally, cultures were washed three times for 5 min with PBS.
The following primary and corresponding secondary antibodies and their dilutions were used in this study: rabbit anti-microtubule-associated protein 2 (MAP2) polyclonal antibody at 1:500 (AB5622; Chemicon, Temecula, CA), CY5-conjugated donkey anti-rabbit (Jackson ImmunoResearch Laboratories), mouse anti-dephosphorylated tau monoclonal antibody at 1:500 (MN1010; Pierce Endogen), CY5-conjugated donkey anti-mouse (Jackson ImmunoResearch Laboratories) at 1:500, guinea pig anti-α4 nAChR polyclonal antibody at 1:50 (AB5590; Chemicon), Alexa Fluor 546-conjugated goat anti-guinea pig at 1:100 (A11074; Molecular Probes, Eugene, OR), rabbit anti-tyrosine hydroxylase (Pel-Freez, Rogers, AR) at 1:50, CY5-conjugated donkey anti-rabbit (Jackson ImmunoResearch Laboratories) at 1:100.
Direct confocal fluorescent imaging. Mesencephalic neuronal cultures were processed for immunocytochemistry and then imaged with an upright LSM 510 Meta laser-scanning confocal microscope (Zeiss) using an Achroplan IR 63× 0.9 NA water immersion objective. Pinhole diameter was ∼1 Airy Unit. Images were collected at a 12-bit intensity resolution over 1024 × 1024 pixels at a pixel dwell time of 6.4 μsec. Z-stacks of images were acquired with a Z step size that ranged between 0.7 and 1.4 μm. The 458 nm laser line was used to excite CFP, the 514 laser line was used to excite YFP, and the 633 nm laser line was used to excite CY5. CFP images were acquired using a 458 nm dichroic mirror and a bandpass filter of 475-495 nm. YFP fluorescence was collected using a 514 nm dichroic mirror and a long-pass filter of 530 nm. CY5 fluorescence was collected using a 633 dichroic mirror and a long-pass filter of 650 nm.
Confocal FRET images. Cultured mesencephalic neurons or HEK293T cells 2 d after transfection were visualized at room temperature in ECS. During the imaging sessions, 2 mm ascorbic acid was included in the ECS to prevent damage to dendrites during photobleaching.
A series of lambda stack X-Y images were collected from an upright LSM 510 Meta laser scanning confocal microscope using an Achroplan IR 63× 0.9 NA water immersion objective (Zeiss). For details, see Lansford et al. (2001) and Dickinson et al. (2001). Images were collected over a spectrum of wavelengths between 462.9 and 602 nm with bandwidths of 10.7 nm during excitation of CFP with the 458 nm laser line of an argon laser. Therefore, each pixel of the X-Y image has a complete spectral emission intensity between 462.9 and 602 nm, which is defined as the lambda stack. Pinhole was 1.32 Airy Units and a Z resolution of ∼2.0 μm. Images were collected at a 12-bit intensity resolution over 512 × 512 pixels at a pixel dwell time of 12.8 μsec. FRET was recorded by examining the dequenching of CFP during incremental photobleaching of YFP by the 514 nm argon laser line. Lambda stacks were acquired at various time points before and after photobleaching of YFP. These time points included 0, 0.13, 0.26, 0.52, 1.05, 1.57, 2.09, 6.81, and 12.05 min, which corresponded to 0, 1, 2, 4, 8, 12, 16, 52, and 92 complete photobleaching scans.
Although there is significant overlap in the emission spectra of YFP and CFP, we were able to separate the fluorescence contribution of each fluorescent protein at each pixel using a linear unmixing algorithm based on the spectral signatures of YFP and CFP created from reference lambda stack images of cells expressing either soluble YFP or soluble CFP, respectively (Dickinson et al., 2001; Lansford et al., 2001). These unmixed YFP and CFP images were analyzed for FRET efficiency.
Background fluorescence for both CFP and YFP was determined as the mean fluorescence intensity from an area containing cells that did not express the constructs, and it was subtracted from the overall intensity. Mean fluorescence intensities of CFP and YFP were determined by tracing the outer perimeter of the cell, the neuronal soma, or dendrite with a region of interest. In the case of FRET calculated for cell membrane surface receptors with the application of 1 μm phorbol 12,13 myristate acetate (PMA) (Sigma), however, mean fluorescence intensity was calculated for only the outer shell of fluorescence of the cell and did not include the cell interior. Mean fluorescence intensities were determined using ImageJ software v1.29u (National Institutes of Health, http://rsb.info.nih.gov/ij/). Fluorescence intensities of CFP and YFP at various time points after photobleaching were normalized to time 0 (100%). FRET efficiency (E) was calculated:
 1IDA represents the normalized fluorescence intensity of CFP (100%) in the presence of both donor and acceptor. ID represents the normalized fluorescence intensity of CFP in the presence of donor only. The ID value was extrapolated from a scatter plot of the percentage increase of CFP versus the percentage decrease of YFP for each cell.
Statistics. Data are reported as mean ± SE or median with the 25th and 75th percentiles for parametric and nonparametric data, respectively. Significant differences (at p < 0.05) were determined between two groups using a t test for continuous data meeting parametric assumptions of normality and equal variance. Otherwise the Mann-Whitney rank sum test was used for nonparametric data. To compare significant differences between more than two groups of data meeting assumptions of normality and equal variance, a one-way ANOVA was performed followed by a Tukey test for all pair-wise comparisons. If the groups of data did not meet the parametric assumptions of normality and equal variance, then a Kruskal-Wallis one-way ANOVA on ranks was performed using the Dunn's method as post hoc pair-wise analysis.
Results
Incubation in nicotine upregulates function
Untransfected ventral midbrain cultures were incubated in 1 μm nicotine for periods of 1-6 d. Blood levels of nicotine in smokers usually range between 125 and 275 nm, occasionally reaching 500 nm (Rowell, 2002); however, brain levels of nicotine are approximately three times higher than in blood (Rowell, 2002), comparable with the 1 μm value in our experiments (Rowell and Li, 1997). We then measured fura-2 signals in these cultures to monitor changes in functional nAChRs. These signals were measured in the presence of atropine, tetrodotoxin, CNQX, AP5, and bicuculline, so that the Ca2+ signals mostly represent direct influx rather than the amplifying effects of other channels. We focused on data measured at 2.75 and 4.75 sec after the start of a 2 sec ACh pulse, to concentrate on fluxes linked most directly to the receptor activation. Furthermore, we noted that MLA blocked the fura-2 signals by ∼29% (grand average of >300 cells under all conditions), indicating that MLA-insensitive components of Ca2+ flux dominate the signals. Most researchers believe that MLA-sensitive components are primarily α7-mediated (Kawai and Berg, 2001; Alkondon and Albuquerque, 2002) and that the DHβE sensitive signals arise in part via α4- and β2-containing receptors (Buisson et al., 1996; Marks et al., 1999). Signals were indeed blocked further by ∼32% by (MLA + DHβE).
We found statistically significant upregulation of the MLA-insensitive response to 300 μm ACh after 2 d and after 4-6 d of nicotine incubation (Fig. 4), but not after just 1 d of nicotine exposure (data not shown). We also found statistically significant upregulation of the MLA-sensitive response to 300 μm ACh at 2 d (Fig. 4). There was a residual ACh-elicited response after block with MLA and DHβE that showed no significant difference in functional expression with nicotine incubation. These data extend results obtained previously for α7 receptors in cortical cultures (Kawai and Berg, 2001) and show for the first time that midbrain neurons display upregulated nAChR-dependent Ca2+ influx during chronic exposure to nicotine.

Upregulation of nAChR functional responses by incubation in nicotine. Average of fura-2 recording traces of cultured ventral midbrain neurons at 2 d (A) and 4-6 d (C) after control or 1 μm nicotine treatment and elicited by a 300 μm pulse (2 sec) of ACh. Traces are shown for responses in the presence of no nicotinic receptor blockers (None) as well as MLA or (MLA + DHβE). Bar charts in B and D summarize the fura-2 changes in the plots above (A, C)at time points 2.75 and 4.75 sec after the start of ACh application for all of the conditions, with and without nicotinic receptor blockers, and with and without chronic nicotine incubation. Bar charts at day 2 show a significant increase in functional response in both the MLA- and DHβE-sensitive components with nicotine incubation (B). Days 4-6 show a significant upregulation in functional response of only the DHβE-sensitive nicotinic component (D).
Although the average block by (MLA + DHβE) was 61%, the (MLA + DHβE)-insensitive responses were found in some 60% of cells. In general, we found that the (MLA + DHβE)-resistant responses persisted longer than MLA + DHβE-sensitive components, which are represented primarily by the 4.75 sec time scale summarized in Figure 4, B and D. These observations agree with reports that the (MLA + DHβE)-insensitive nicotinic responses, which are found in the VTA and substantia nigra, have slower kinetics and are activated by longer applications of ACh (∼2000 msec) (Wooltorton et al., 2003). These results also are consistent with observations that mouse brain displays two classes of nicotinic responses that are not blocked by α-bungarotoxin: DHβE-sensitive and DHβE-resistant responses (Marks et al., 1999). The DHβE-sensitive component is likely α4β2. The DHβE-resistant receptor is widely distributed, contains the β2 subunit, but is not α4β2 (Marks et al., 1999).
The upregulation of apparent α4β2-receptor responses during chronic nicotine encouraged us to study α4β2 subunit assembly in individual cells. We chose FRET analysis because FRET permits the study of subunit assembly in subcellular compartments of living cells.
Correct localization of the M3-M4 fluorescent α4 and β2 constructs expressed in midbrain neurons
We inserted YFP and CFP at various locations into the α4 and β2 subunits, respectively (see Materials and Methods) (Fig. 1). The constructs with the fluorescent protein inserted into the intracellular M3-M4 loop of the α4 and β2 nicotinic receptors showed relatively normal function and expression levels, as judged by ACh-induced currents (Fig. 2), by ACh-induced Ca2+ accumulation (see Materials and Methods) (Fig. 2), and by dose-response relations (Fig. 3), and were used for these experiments. We used the Nupherin-Neuron system, which produces good expression in hippocampal cultures (Slimko et al., 2002), for efficient transient expression of the fluorescent constructs in ventral midbrain cultures. We found highly significant increases in nicotinic responses of the transfected neurons (Fig. 5).

Fluorescently tagged nicotinic receptors transfected in midbrain neurons produce agonist-induced currents. Recordings from neurons (embryonic day 14 <14 d in culture). A, Whole-cell recording in an untransfected neuron shows that 300 μm ACh (50 msec pulse duration) evokes small endogenous current (13 ± 7 pA). Whole-cell recordings of neurons transfected with the fluorescently labeled nicotinic receptors all show a significantly larger ACh-evoked current (B-D). Inset in D is a bar graph summarizing the results for neurons transfected with (α4-YFP)(β2-CFP) versus nontransfected.
These increased responses at the whole-cell level do not address the following question: are the fluorescent subunits expressed in the same locations as WT α4β2 receptors? In designing the fluorescent subunits, we avoided placing the fluorescent moieties in regions that might compromise putative phosphorylation sites, potential trafficking signals, and the negatively charged amphipathic helix that may line the permeation pathway (Miyazawa et al., 1999). To determine whether the fluorescently labeled nAChR constructs in fact were targeted correctly to subcellular neuronal regions, we compared the subcellular localization of fluorescently tagged α4β2 receptors with that of endogenous α4-containing receptors. In ventral midbrain cultures transfected with α4-YFP-M β2, α4 β2-CFP-M, or a combination of the two fluorescent subunits, the receptors were localized mainly in the soma and dendrites of neurons and mostly excluded from axons. The distribution of α4-YFP-M or β2-CFP-M overlapped with the somatodendritic marker MAP2 (Fig. 6A,B,D), whereas neither α4-YFP-M nor β2-CFP-M colocalized with the axonal marker dephospho-tau (data shown only for α4-YFP-M) (Fig. 6C). Fluorescently tagged α4 or β2 were distributed evenly within the somata and dendrites, and most receptors were excluded from the nucleus (Fig. 6A-D). No strong surface fluorescence was evident, although the electrophysiological experiments confirmed the presence of functional surface receptors (Fig. 5A).

Localization of α4β2 receptors in mecencephalic neurons. A-D, Projections of a confocal stack of images of midbrain neurons transfected with fluorescently labeled α4 or β2 nAChRs. α4 nAChRs are localized in the soma and dendrites (A, B, white arrowheads) and overlap with MAP2 (red) staining. α4 nAChRs are absent from axons as indicated by absence of staining in a process containing soluble nonfusion CFP (blue) but negative for MAP2 (B, yellow arrowheads). C, Also α4 nAChRs (green) do not overlap with the axonal marker dephosphorylated tau (C, red). D, β2 nAChRs (green) are also found in soma and dendrites (white arrowheads) of neurons (red). E, Wide-field fluorescence images of untransfected midbrain neurons that are stained with anti-α4 antibody show similar staining of endogenous α4 nAChRs located primarily in soma and dendrites. F, Tyrosine hydroxylase immunoreactivity identifies one of the α4-containing neurons as dopaminergic.
Immunocytochemistry was performed on untransfected midbrain neurons using an anti-α4 antibody for endogenous α4-containing nAChRs (Fig. 6 E). Staining patterns resembled those of the transfected α4-YFP-M. Endogenous α4 nAChRs were also localized mainly in the soma and dendrites. Double labeling with tyrosine hydroxylase indicated that some α4-containing neurons were dopaminergic. Therefore, the fluorescently tagged nicotinic receptor constructs express in the correct subcellular regions.
Incubation in nicotine upregulates levels of α4 nAChR subunits
In transfected cultured midbrain neurons, we assessed the level of the fluorescently tagged α4 subunits in individually identified neurons over a 24 hr period. We found that neurons incubated in 1 μm nicotine showed a significant increase in α4 subunit fluorescence in the dendrites (143 ± 17%), whereas the soma showed only a slight increase (115 ± 31%) (Fig. 7). In contrast, controls without nicotine showed a decrease in α4 expression in both soma and dendrites (22 and 43%, respectively) over a 24 hr period, probably because of the transient nature of expression of the nicotinic receptor with transfection. Therefore the dendrites of cells incubated in nicotine show a highly significant 2.5-fold greater α4 receptor level than control cells not incubated in nicotine. We found similar increases in the CFP fluorescence levels from the β2 receptor subunits that were cotransfected with the α4-YFP receptors; however, because the YFP moieties in the α4 subunits quench the β2-CFP fluorescence (see below) and therefore distort the quantitative data, the β2-CFP data are not presented in detail. The data suggest that the functional upregulation of DHβE-sensitive and MLA-resistant responses is contributed by increased α4β2 nAChRs in nicotine-treated neurons. Because in this set of experiments transfected neurons overexpress nicotinic receptors, we expected that the upregulation would be accelerated and would thus appear earlier than the functional upregulation for the endogenous receptors (Fig. 4).

Incubation in nicotine upregulates levels of α4 nAChR subunits. We followed the expression levels of fluorescently labeled α4 nAChR subunits in individual identified midbrain neurons twice, once before and once 24 hr after treatment in either control or nicotine solution. A, Images show α4-YFP fluorescence in nicotine and control treated neurons at 0 and 1 d after treatment. A ramp of grayscale values is indicated below each image pair. The decrease of fluorescence in the control cell (left-hand panel) was larger than average. B, Bar graphs showing that nicotine (1 μm) treatment resulted in a significant increase (∼143%) in α4-YFP subunit expression in dendrites and a smaller relative increase (∼115%) in soma of cultured neurons.
FRET signals are large, reveal surface translocation, and generalize to heteromeric glutamate-gated chloride (GluCl) channels but retain specificity for correctly assembled receptors
We measured FRET between the CFP and YFP moieties of the (α4-YFP-M)(β2-CFP-M) receptors in both HEK293T cells (Fig. 8) and midbrain neurons (see Fig. 10). We first describe the results for HEK293T cells. Photobleaching the acceptor YFP dequenched the CFP fluorescence in nearly all cells, over a time course of ∼2 min (Fig. 8A,C-F). We fitted exponential time courses to the initial phase of either the increase in CFP fluorescence (τ = 0.37 ± 0.09 min) or the decrease in YFP fluorescence (τ = 0.36 ± 0.03 min). On average, the time constants for YFP bleach and for CFP dequench differed by <1%, as expected if the YFP bleach and the CFP dequench arise from the same process. Occasionally there were longer components to the bleaching and dequench processes (Fig. 8F), possibly arising from slight photobleaching of CFP, although we have not systematically analyzed this. To quantify FRET between the nicotinic subunits, we constructed a scatterplot of the photobleach-induced changes in CFP and YFP fluorescence of each cell during the entire 12 min of bleaching (Fig. 8G) and then fitted a regression line to the scatterplot. The slope of the regression line ranged between 0.08 and 1.12 in these experiments on α4β2 nAChRs.

FRET between (α4-YFP-M) (β2-CFP-M) subunits transfected in HEK293T cells and translocation of assembled α4β2 receptors by C kinase. A, Confocal images showing greater dequenching of CFP in 1 μm PMA-treated cells than in untreated cells during YFP photobleaching. PMA-treated cells also show stronger fluorescence intensity of α4β2 nAChRs near the cell surface membrane. B, PMA-treated cells show larger ACh-induced currents than untreated cells. Plots of YFP and CFP intensities during photobleaching in untreated (C, E) and PMA-treated cells (D, F). Scatterplot (G) and bar graphs (H) show that PMA-treated cells display greater FRET than untreated cells. The slopes were used to calculate FRET efficiency (H), which was significantly greater in the PMA-treated cells than the untreated cells.

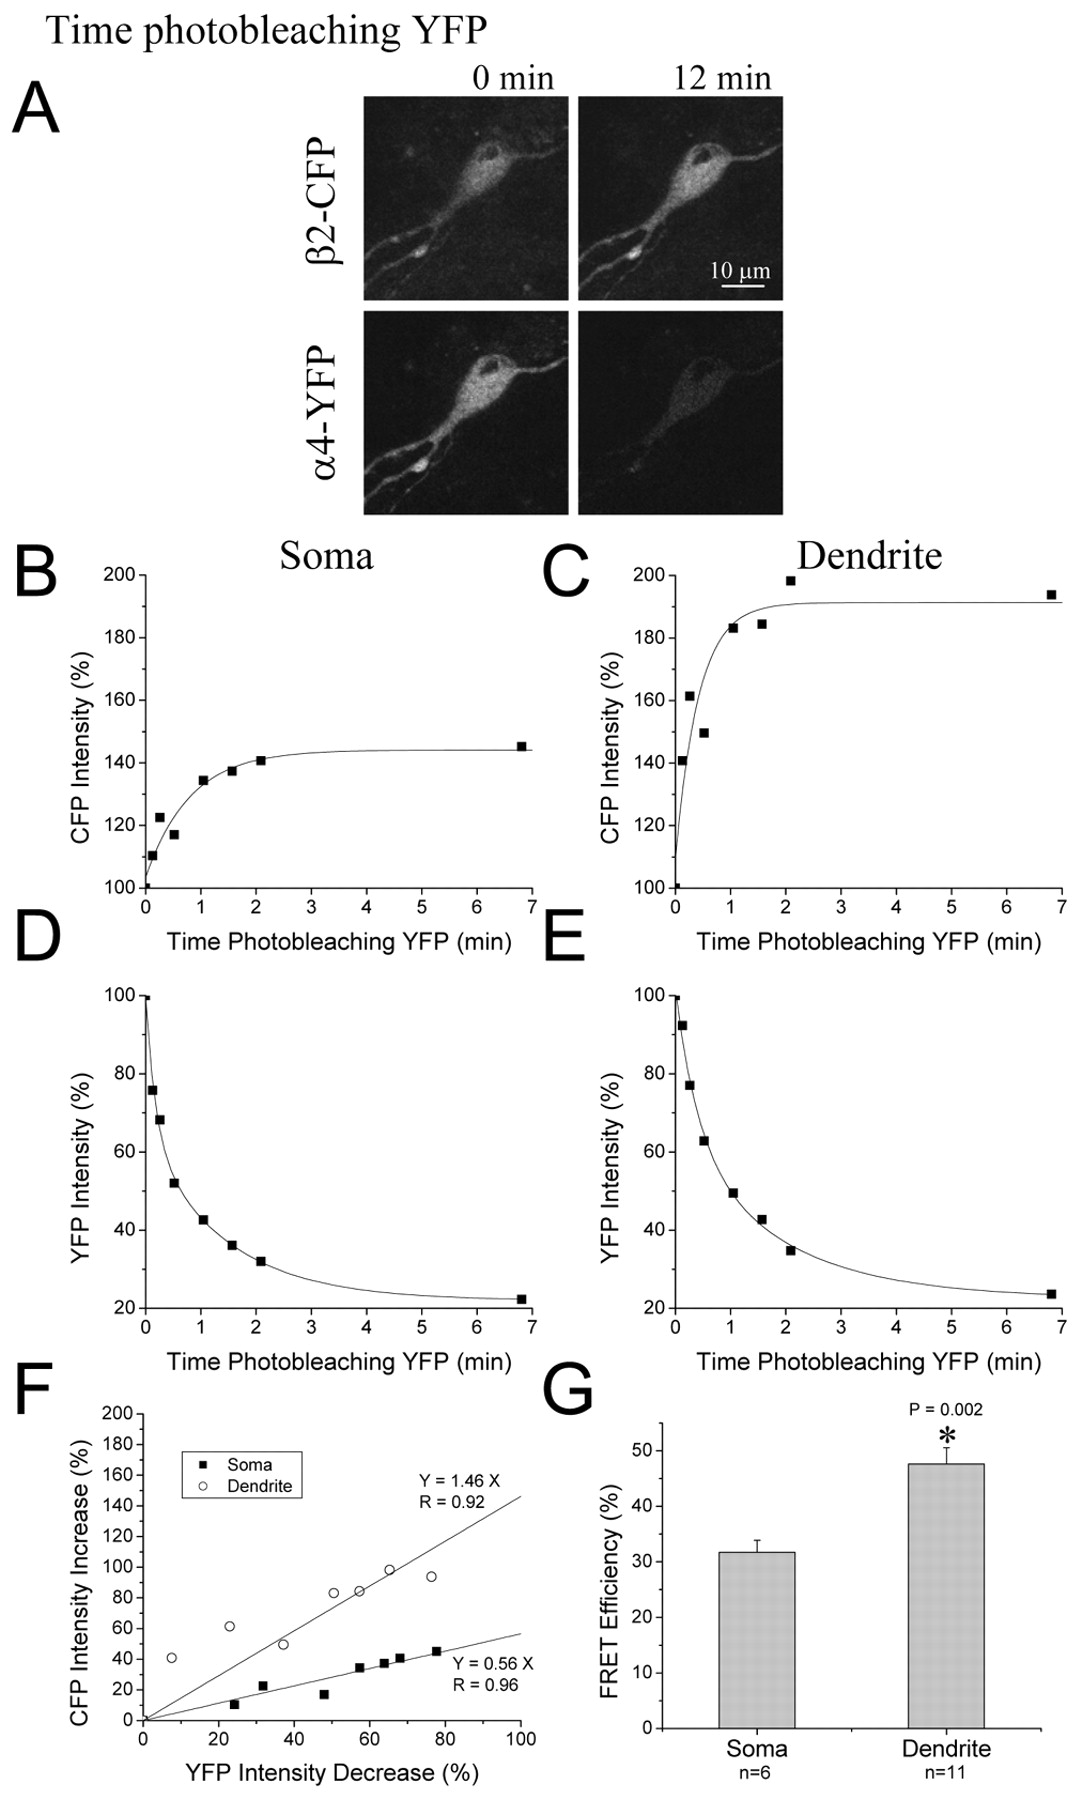
Dendritic α4β2 receptors display greater FRET than somatic receptors. FRET between (α4-YFP-M)(β2-CFP-M) subunits transfected in ventral midbrain neurons. A, Images showing increases in CFP fluorescence over time, whereas YFP fluorescence decreases with photobleaching. B-E, Plots of percentage of intensity change in CFP and YFP fluorescence over photobleaching time of YFP indicate greater dequenching of CFP between (α4-YFP-M)(β2-CFP-M) subunits expressed in dendrites as compared with soma. Scatterplot (F) and bar chart (G) show greater FRET in dendrites than soma in neurons. The slopes of the scatterplots were used to calculate FRET efficiency (G) between α4 and β2, which was significantly greater in dendrites than soma. Therefore, α4β2 receptors in dendrites show a higher degree of assembly than in the soma.
We also exposed transfected HEK293T cells cotransfected with PKCγ to PMA. Transfected (α4-YFP-M)(β2-CFP-M) nAChRs in HEK293T cells displayed modest surface expression; however, incubation in 1 μm PMA (a PKC activator) for ≥30 min robustly translocated α4β2 nAChRs to the vicinity of the cell surface (Fig. 8A). Electrophysiological experiments confirmed that PMA increased surface nAChR function, because PMA also increased the ACh response by threefold (Fig. 8B) at [ACh] levels that mostly saturate the dose-response relation.
The PMA-treated cells displayed greater FRET efficiency, defined by the slope of the scatterplot, from 0.30 ± 0.06 in the untreated cells to 0.60 ± 0.10 in the PMA-treated cells. According to Equation 1, these values imply a FRET efficiency of 22 ± 4% for the untreated cells and 36 ± 4% for the PMA-treated cells, respectively (significantly different at p = 0.017; t test) (Fig. 8H). Therefore, FRET efficiency was greater for the surface than the intracellular α4β2 receptors (Table 1). These data show a larger proportion of assembled receptors on or near the cell surface than in the interior, stimulated by PKC.
Calculations of FRET efficiencies between fluorophore pairs
GluCl is a member of the nicotinic receptor superfamily, consisting of α and β subunits. We studied GluClα-CFP and GluClβ-YFP constructs (Slimko and Lester, 2003), with the fluorescent tags in the M3-M4 intracellular loops. Coexpression of the GluClα-CFP and GluClβ-YFP subunits showed dequenching of CFP in response to YFP photobleaching (Fig. 9A,C,E). FRET efficiency between the α and β GluCl subunits (23 ± 3%) was similar to that between the α4-YFP-M and β2-CFP-M.

Lack of FRET between GluClα and α4 nAChR subunits. A, Confocal images showing dequenching of CFP between (GluClβ-YFP)(GluClα-CFP) and not between (α4-YFP-M)(GluClα-CFP) during YFP photobleaching. Plots of YFP and CFP intensities during photobleaching in cells with (α4-YFP-M)(GluClα-CFP) (B, D) and cells with (GluClβ-YFP)(GluClα-CFP) (C, E). F, Scatterplot showing absence of FRET with (α4-YFP-M)(GluClα-CFP) but presence of FRET between (GluClβ-YFP)(GluClα-CFP). The slopes were used to calculate FRET efficiency (G).
The large FRET efficiencies (∼25%) that we reported are consistent with that found for other heteromeric ion channels (Riven et al., 2003). We anticipated these relatively large signals because the two channel types studied here are heteromultimers consisting of the two subunit types, so that all subunits of each individual channel molecule are either donors or acceptors. Nonetheless, some knowledgeable colleagues were surprised at these FRET efficiencies, especially in view of the data reported in Figure 8 and below (Fig. 10) showing that even larger efficiencies occur in specific compartments and after pharmacological manipulations. Therefore we report additional observations that support these measurements. (1) Measurements performed with the α4 and β2 constructs in a separate lab, using the three-cube system, verified the FRET ratios that we observed (James Fisher and Baljit S. Khakh, personal communication). (2) We have also constructed the reciprocal constructs, α4-CFP and β2-YFP, and we find similarly large measures of FRET (J. Revie, unpublished data). Comparably large FRET efficiencies are also measured in homomeric ion channels when a large excess of acceptor is used, but presumably at the expense of overall signal amplitude (Glauner et al., 1999).
We wished to use the fluorescent subunits to monitor properly assembled receptors. To test the idea that FRET assesses assembled receptors, with no contribution from isolated α4 and β2 subunits, we exploited the fact that GluCl subunits do not form heteromers with nicotinic receptor subunits. We asked whether a FRET signal occurred when a nicotinic receptor subunit (α4-YFP-M β2) was coexpressed with a GluCl receptor subunit (GluClα-CFP). Coexpression of the GluClα-CFP and α4-YFP-M β2 subunits produced little or no reduction in the CFP signal when YFP was photobleached (Fig. 9A,B,D). These experiments show that the FRET observed between α4-YFP-M and β2-CFP-M provides a sensitive assay for assembled nicotinic receptors.
Dendritic receptors show a higher percentage of assembly than somatic receptors
The results presented in Figures 8 and 9 show that FRET between transfected functional, fluorescently labeled α4 and β2 nAChR subunits provides a sensitive, specific assay for correctly assembled α4β2 receptors. We therefore studied FRET between the α4-YFP-M and β2-CFP-M nAChR subunits in transfected midbrain cultures (Fig. 10). As in HEK cells, we found robust FRET. We compared FRET in the dendrites with that in the soma. Photobleaching of YFP indicated a stronger dequenching of CFP fluorescence in the dendrites than the soma. The average slope of the scatterplots of CFP increases versus YFP decreases in the dendrites was significantly greater (p < 0.01) than that in the soma, corresponding to respective FRET efficiencies of 48 ± 3 and 32 ± 2%, respectively.
Incubation in nicotine upregulates assembly of somatic α4β2 receptors
These results show that FRET between transfected functional, fluorescently labeled α4 and β2 nAChR subunits can address the following question: does nicotine incubation increase the assembly of α4β2 receptors in midbrain neurons? We assessed assembly of α4β2 receptors under conditions of nicotine incubation in cultures transfected with the fluorescent α4β2 receptors. In each of two experiments, we observed significant increases in receptor assembly even after 1 d of nicotine incubation. When measured only in the soma, FRET was 27 ± 3% in control cells and 37 ± 2% in incubated cells. Transfected cells express much higher receptor levels than untransfected cells (Fig. 5); it was therefore not surprising to find significant changes in receptor assembly even after 1 d of nicotine incubation, although untransfected cells required at least 2 d of incubation with nicotine to show increased responses to agonist (Fig. 4).
We next asked whether the upregulation of functional receptors by nicotine incubation is also contributed by increased assembly of receptors in the dendrites of the cultured midbrain neurons. We found no significant nicotine-induced differences in dendritic FRET signals, in contrast to the FRET increase that we found in the soma (Fig. 11).

Incubation in nicotine increases FRET in the soma. FRET between (α4-YFP-M)(β2-CFP-M) subunits transfected in ventral midbrain neurons. A, Images showing increases in CFP fluorescence over time, whereas YFP fluorescence decreases with photobleaching. B-E, Plots of percentage of intensity change in CFP and YFP fluorescence over photobleaching time of YFP indicate greater dequenching of CFP between (α4-YFP-M)(β2-CFP-M) subunits expressed in soma of neurons exposed to nicotine as compared with unexposed controls. Scatterplot (F) and bar chart (G) show greater FRET and therefore greater α4β2 subunit assembly in the soma of nicotine-incubated neurons as compared with the soma of unexposed control neurons.
Discussion
This study shows, for the first time, that nicotine incubation upregulates functional responses, both α7-like and α4β2-like, in individual midbrain neurons (Fig. 4). By measuring FRET within assembled α4β2 receptors, we also show directly that nicotine incubation upregulates assembly of receptors in individual midbrain neurons and that this upregulation occurs primarily in the somatic compartment rather than in processes (Fig. 11), which already have the highest level of assembled receptors that we have noted in this series of experiments. In addition, measurements of fluorescence levels indicated increased levels of α4 nAChR subunits in midbrain neurons treated with nicotine (Fig. 7). The conclusions about local assembly were enabled by the large FRET signals between the fluorescently tagged α4 and β2 subunits in the heteromeric α4β2 receptor. Our observation that comparable FRET occurs between coassembled GluClα-CFP and GluClβ-YFP (Li et al., 2002; Slimko et al., 2002), but not between GluCl and nAChR subunits, rules out FRET caused by nonspecifically dimerized fluorescent proteins (Zacharias et al., 2002). FRET provides a good metric for detecting receptor assembly within the nicotinic receptor superfamily.
Fluorescent α4 and β2 subunits
Functional properties have been reported for several GFP-tagged members of the nicotinic superfamily of ligand-gated channels (Bueno et al., 1998; Chapell et al., 1998; David-Watine et al., 1999; Kittler et al., 2000; Gensler et al., 2001; Fucile et al., 2002; Palma et al., 2002). This is the first such report for α4β2 nicotinic receptors, and large amounts of new quantitative data were made possible by the LSM Meta laser scanning confocal microscope, which has an array of photodetectors that simultaneously yield a full spectrum at each pixel, allowing the experimenter to deconvolve the CFP and YFP spectra without excessive photobleaching (Dickinson et al., 2001; Lansford et al., 2001).
Evidently α4β2 ACh receptor function is retained when fluorescent proteins are inserted into the α4 or β2 intracellular M3-M4 loop. The M3-M4 loop constructs displayed normal subcellular localization, ACh-induced currents, and ACh-induced Ca2+ fluxes. Our results are consistent with those of previous reports that the insertion of fluorescent proteins into the M3-M4 cytoplasmic loop of nAChR superfamily members produces a normally functioning receptor, whereas placement of the fluorescent tags at the N or C terminus results in a partial or complete loss of function (Kittler et al., 2000; Gensler et al., 2001).
When transfected into midbrain neurons, the fluorescently tagged nicotinic receptor subunits are located in soma and dendrites. They are undetectable in axons, although our fluorescent methods have the sensitivity to detect axonal localization of other membrane proteins (Chiu et al., 2002). The receptors appear to be distributed homogenously throughout the cytoplasm but are excluded from the nucleus. There was no strong expression on the surface and no punctate clustering as found for NMDA, AMPA, or nicotinic α7 receptors (Naisbitt et al., 1999; Ehlers, 2000; Kawai et al., 2002). Importantly, our results are consistent with previous immunohistochemical staining for α4 and β2 in the ventral tegmental area and substantia nigra of the rat brain (Arroyo-Jimenez et al., 1999; Jones et al., 2001). α4 and β2 nAChR subunits are also located on dopaminergic nerve terminals as determined by immunoprecipitation, ligand binding, and immunoelectron microscopy, but the expression of nicotinic receptors at presynaptic terminals may be lower than the detection limit of fluorescence microscopy (Zoli et al., 1995; Arroyo-Jimenez et al., 1999; Jones et al., 2001). Despite the apparent absence of presynaptic nAChRs, the endogenous and fluorescently tagged α4 nAChRs display identical localization patterns in cultured midbrain neurons.
Structural interpretation of the FRET experiments
The highest FRET efficiency that we have measured, for α4β2 expressed in neuronal dendrites, is 48 ± 3%. The distance between two fluorophores (R) may be calculated:
 2 where the Förster distance (Ro) for the combination of YFP and CFP is 49.2 Å (Patterson et al., 2000). By Equation 2, this value corresponds to a distance of 50 ± 1 Å separating single CFP and YFP moieties embedded within the α4 and β2 M3-M4 intracellular loops. According to the structural studies of the Torpedo nAChR, the intracellular loops are rather closer, 30-40 Å (Miyazawa et al., 1999). We are impressed that a FRET experiment averaging molecules in a living cell yields data within even a factor of 2 of the expectation from structural studies.
Nonetheless, it is worth considering factors that could influence this estimate. (1) The fluorescent protein variants consist of β-cans, 25 Å in diameter and 40 Å in length (Ormo et al., 1996), and the fluorophores are within these added structures. (2) The M3-M4 intracellular loop varies in length, and presumably size, among nAChR subunits (in aa): α4, 271; β2, 138; α1, 112; β1, 123; γ, 151, and δ, 141. (3) The intact protein is a pentamer, and we do not know the stoichiometry of α4 and β2 subunits in our preparation (Zwart and Vijverberg, 1998; Nelson et al., 2003). When an individual β2-CFP subunit absorbs a blue photon, this energy can be transferred to at least one other CFP moiety and at least two α4-YFP moieties, each at a specific orientation and distance. We do not have a satisfactory theory to treat these multiple interactions. (4) The canonical Förster distance (Ro) of 49 Å assumes that the relative dipole orientation factor κ2 is 0.67, but this parameter could plausibly range from 0.1 to 3. Therefore a FRET efficiency of 48% corresponds to corrected distances ranging from 36 to 64 Å. For instance, if we assume that the donor and acceptor transition moments of CFP and YFP are coplanar at adjacent vertices of a pentagon, or orthogonal to the vertices, the implied distances are 41 Å (κ2 = 0.2) or 54 Å (κ2 = 1), respectively.
Increased receptor assembly in response to several factors
We have used the FRET signals to conclude that the fraction of α4 and β2 subunits in assembled complexes varies with several factors. First, this fraction is greater in the dendrites of midbrain neurons than in their somata. This observation is consistent with the notion that nAChRs are assembled in the soma before being exported to the dendrites, which therefore contain mostly assembled receptors. Either there is little dendritic synthesis of α4β2 receptor subunits (Steward and Schuman, 2001), or dendritically synthesized subunits are quite efficiently incorporated into fully assembled receptors.
The ER presumably contains incompletely assembled nAChRs. For muscle nAChRs, the ER retention motifs prevent partially assembled or unassembled nAChR subunits from reaching the cell membrane surface (Keller et al., 2001). The formation of a full pentameric muscle nAChR occludes the ER retention motif, permitting the export of the receptors to the cell surface. We believe that α4β2 nAChRs may be assembled in the same way. If we assume (1) that the FRET efficiency in dendrites represents only fully assembled receptors, (2) that zero FRET efficiency corresponds to unassembled receptors, and (3) that there is a linear interpolation between these two extremes, then in the intracellular somatic compartment 67% of the subunits are assembled into nAChRs. We are unaware of any possible distortions that could arise in FRET measurements from differential rotational or lateral mobility or anchoring of nAChRs in various compartments (Stya and Axelrod, 1983, 1984; Yuan and Axelrod, 1995).
Second, this is the first report that C kinase increases nAChR function, and also the first report that this may occur via surface translocation. We do not know the mechanism of the action of PKCγ on increasing surface α4β2 nAChRs, or even whether there is direct phosphorylation of α4β2 nAChRs; however, phosphorylation at key residues may inhibit recognition of an ER retention sequence in α4β2 nAChRs. A similar mechanism was reported for NMDA receptors (Scott et al., 2001) and GluR4 (Correia et al., 2002). On the other hand, PKC activation can also stimulate membrane proteins to translocate from surface to intracellular. Activation of PKC results in internalization of GABAA receptors (Chapell et al., 1998), GABAC receptors (Filippova et al., 1999), and dopamine and serotonin transporters (Qian et al., 1997; Pristupa et al., 1998).
There is greater FRET within α4β2 receptors near the surface than those located intracellularly in HEK293T cells. This conclusion rests on the observations that PKCγ activation by the PMA translocated α4β2 nAChRs to the perimeter of HEK293T cells and increased the peak amplitude of the ACh response threefold (Fig. 8). We cannot conclude, of course, that all translocated receptors both enter the surface membrane and respond to ACh, but the qualitative agreement between these two observations certainly suggests that increased plasma insertion of assembled α4β2 receptors accounts at least in part for the increased ACh-induced currents. A single fluorescent label would suffice for the conclusion that PKC translocates receptors to the surface, but the FRET measurements show in addition that this translocation involves predominantly assembled receptors, in agreement with the increased agonist-induced currents.
Third, of direct importance to the mechanism of nicotine addiction, we show four aspects of the response to chronic incubation with nicotine. (1) Such incubation is associated with increases in function of receptors the pharmacology of which agrees with the α4β2 subtype. This observation derives from conventional Ca2+-sensitive recording with fura-2 in untransfected cultures (Fig. 4). (2) Using fluorescent nAChRs transfected in cultures, we also detected that nicotine significantly induced increased levels of α4β2 nAChR subunits in the dendrites, but not significantly in the somata (Fig. 7). (3) We measure FRET between these fluorescent subunits to show that this increase also biases the α4β2 receptor population toward assembled receptors (Fig. 11). (4) We find that this increased assembly involves primarily somatic rather than dendritic receptors, which already show a high level of assembly (Fig. 11). A reasonable but still hypothetic mechanism that ties together these events is that nicotinic incubation would increase the assembly of receptors in the soma, and that these assembled receptors are then transported to the dendrites. Alternatively, nicotine would inhibit the reverse processes: removal from dendrites and disassembly in the soma. The nicotine-induced upregulation of receptor binding is not produced by events at the transcriptional level (Marks et al., 1992); our measurements emphasize an additional posttranslational event, more efficient assembly, which in turn results in increased surface expression of nicotinic receptors. The upregulation by 1 μm nicotine that we measure is similar to the ∼40% upregulation of α7 receptor responses by 100 μm nicotine in cortical cultures, the only other example of nicotine-induced functional upregulation measured in intact neurons (Kawai and Berg, 2001).
Our results generally support the idea that, in response to nicotine incubation, cells upregulate nAChRs faster if they initially express higher receptor levels. HEK cells stably expressing α4β2 or α3β2 nAChRs produce ∼2 or >1 nA agonist-induced current, respectively (Wang et al., 1998; Buisson and Bertrand, 2001). In response to incubation in nicotine, both receptor types are upregulated within 7-9 hr. Our cultures with transfected fluorescently labeled α4 and β2 subunits express ∼100 pA of ACh-induced current (Fig. 5), and such cells upregulate receptor protein within 1 d during nicotine incubation (Fig. 7). Untransfected midbrain neurons express rather small endogenous ACh-induced currents (13 ± 7 pA) at 2 weeks in culture (Fig. 5) (although responses increase to 245 ± 100 pA at 4-5 weeks in culture; data not shown); we did not observe functional upregulation of such native nicotinic receptors in untransfected midbrain neurons until day 2. Therefore, the signal transduction events caused by the action of nicotine on native α4β2 receptors at 2 weeks in culture is certainly weaker, and presumably slower, than for the case of the clonal cell lines and transfected cultures.
It has long been suspected that the signal for nicotine-induced increases in receptor binding involves a transduction pathway that begins with Ca2+ flux through activated receptors (Buisson and Bertrand, 2002). This pathway is rendered more likely by our observation that, at least in clonal cell lines, activated PKC induces both translocation and increased assembly of receptors (Fig. 8). Previous ideas about nicotine-induced upregulation of receptors have suggested cycling of receptors between surface and cytoplasm (Buisson and Bertrand, 2002). The present measurements and other recent data (Wang et al., 1998; Nelson et al., 2003) emphasize that assembly of receptors may be a dynamic process that plays a role in addition to translocation.
Footnotes
This work was supported by National Institutes of Health Grants NS11756 and HD37105 and the California Tobacco-Related Disease Research Program (TRDRP). R.N. was supported by a postdoctoral fellowship from the TRDRP (10FT-0174) and the Elizabeth Ross Fellowship. We thank Bruce Cohen and Julian Revie for critical evaluation of this manuscript, Eric Slimko for providing the GluClβ-YFP GluClα-CFP cDNAs, Donghong Ju, Alexa Mundy, Matthew Abramian, and Kai Sung for technical help, Qi Huang for writing some of the data analysis programs, and James Fisher for performing several three-cube FRET experiments.
Correspondence should be addressed to Henry A. Lester, California Institute of Technology, Division of Biology, M/C 156-29, 1200 East California Boulevard, Pasadena, CA 91125. E-mail: lester{at}caltech.edu.
Copyright © 2003 Society for Neuroscience 0270-6474/03/2311554-14$15.00/0


