


Abstract
Through immunocytochemistry with the use of antibodies against A1 adenosine receptors (A1Rs) and confocal microscopy, we show that stimulation of A1Rs by the agonist (R)-phenylisopropyladenosine [(R)-PIA] caused a rapid (5–15 min) aggregation (clustering) of receptor molecules on the surface of DDT1MF-2 cells. Internalization of the chronically stimulated receptor was slower and occurred concomitantly, with a time-dependent decrease (50%) in the number of cell surface [3H](R)-PIA binding sites. The reduction of binding sites was due partly (30%) to internalization and partly (20%) to the presence of desensitized cell surface receptor molecules that were unable to bind the ligand. Chronic exposure of DDT1MF-2 cells to 50 nm (R)-PIA produced functional desensitization, as deduced from second messenger production assays. Quantification of the content of A1Rs by immunoblotting and flow cytometry in cells pretreated with 50 nm (R)-PIA indicates a time-dependent slow down-regulation of the receptor. Receptor clustering and agonist-induced receptor phosphorylation, which occurred in serine and tyrosine, were simultaneous. The finding that activators of protein kinase A or C were able to induce functional desensitization of A1Rs, phosphorylate A1Rs in serine and threonine, and trigger clustering of the receptor suggests that phosphorylation of A1Rs in serine/threonine is involved in desensitization-related events.
The ubiquitous nucleoside adenosine exerts multiple physiological actions via specific receptors, four of which (A1, A2a, A2b, and A3) have been cloned (see Ref. 1 for a review). A1Rs are functionally coupled to members of the pertussis toxin-sensitive family of G proteins, Gi1, Gi2, Gi3, and Go (2, 3). Activation of A1Rs regulates several membrane and intracellular proteins, such as adenylate cyclase, Ca2+ channels, K+ channels, and phospholipase C (see Ref. 1 for a review). The smooth muscle cell line DDT1MF-2 from hamster vas deferens expresses the A1Rs in a stable manner (4). Equilibrium parameters for agonist binding to these cells are similar to those found in intact tissue preparations. On the other hand, the number of receptors for each cell is high (B max = 0.16 pmol/mg of protein, which represents ∼100,000 receptors/cell). These cells are thus more suitable than transfected cells for the study of A1R function. In fact, overexpression of protein molecules in transfected cells may lead to artifactual results in experiments designed to elucidate receptor physiology.
Chronic agonist stimulation of certain receptors induces desensitization (an attenuated response to stimulation) and down-regulation (internalization and reduction in the number of receptor molecules per cell). Among G protein-coupled receptors, desensitization and down-regulation have been extensively studied in cell systems expressing β-adrenergic receptors (see Ref. 5 for a review). On the basis of these studies, it has been suggested that after a short period of agonist exposure, the receptors uncouple from G proteins due to phosphorylation catalyzed by receptor-specific kinases (e.g., β-adrenoceptor-associated receptor kinase-1 and -2) and/or kinases regulated by second messengers (e.g., PKA). Phosphorylation of the receptor by specific kinases increases the affinity of the receptor for cytosolic factors (arrestins), whereas phosphorylation by PKA impairs the ability of the receptor to interact with G proteins (6-8). Receptor internalization or sequestration are phenomena by which a receptor translocates to intracellular compartments. Ligand-induced sequestration has been described for β2-adrenergic receptors in several cell lines, but the molecular mechanisms are not fully understood (9-12). Internalization is usually incomplete, and it alters the resensitization process, as occurs in the case of muscarinic receptors (13, 14). However, through the use of immunocytochemical techniques, Smit et al. (15) demonstrated that immunoreactivity against histamine H2 receptors tagged at the amino terminus completely disappears after 1 hr of agonist treatment. The authors also show that histamine causes internalization of the receptor in stably transfected human embryonic kidney 293 by a cAMP-independent pathway. Furthermore, Berry et al. (16) demonstrated a rapid and almost complete agonist-induced internalization of 5-hydroxytryptamine2A receptor via the endosome pathway.
Desensitization of adenosine receptors has been characterized by pharmacological and molecular approaches in a variety of model systems (10, 17-21). Desensitization and down-regulation of A1Rs and A2a adenosine receptors in DDT1MF-2 cells follow two distinct pathways (22). Pretreatment of cells with high doses of agonist results in a rapid loss of agonist-stimulated adenylate cyclase activity with no change in receptor number or affinity for the ligand. In contrast, desensitization of A1Rs follows a decrease in the number of receptors in membrane preparations and seems to be mediated by receptor phosphorylation (22). Further characterization of desensitization mechanisms of canine A2aadenosine receptors indicates that agonist-stimulated receptor phosphorylation may induce short term desensitization by impairing receptor/Gs coupling. In addition, long term desensitization is mediated by down-regulation of the receptor and up-regulation of inhibitory G proteins (17). In this report, the distribution of A1Rs in DDT1MF-2 cells was studied by immunocytochemistry using two antipeptide antibodies against A1Rs. Desensitization mechanisms of A1Rs have been analyzed using a set of techniques that include confocal microscopy, ligand binding, and immunoblotting. The results provide direct evidence of agonist-induced cell surface A1R aggregation and subsequent receptor desensitization and internalization. Moreover, the level of phosphorylation of the receptor, in serine, threonine, or tyrosine, has been analyzed in cells treated chronically with the agonist.
Experimental Procedures
Materials.
[3H](R)-PIA (36Ci/mmol), myo-[3H]inositol (85 Ci/mmol), and the enhanced chemiluminescence immunoblotting detection system were purchased from Amersham (Nuclear Iberica, Madrid, Spain). [32P]Orthophosphate was from New England Nuclear Research Products (Boston, MA). DPCPX was from Research Biochemicals (Natick, MA). (R)-PIA, phenylmethylsulfonyl fluoride, pepstatin, leupeptin, chymostatin, antipain, fluorescein isothiocyanate, rhodamine isothiocyanate, PMA, Clφ-cAMP, and Fura-2 AM were obtained from Sigma Chemical (St. Louis, MO). Calf adenosine deaminase, which was filtered through Sephadex G-25 before all assays, and electrophoresis reagents were obtained from Boehringer-Mannheim (Barcelona, Spain). Sephadex G-25 fine grade and Protein A/Sepharose CL4B were from Pharmacia LKB Biotechnology (Uppsala, Sweden). All other products were of the best grade available and purchased from Merck (Darmstadt, Germany). Deionized water further purified with a Millipore Milli-Q system (Bedford, MA) was used throughout the study.
Antibodies.
Antipeptide antisera against A1Rs were generated by immunization of female New Zealand White rabbits with the use of Bio-Kit facilities (Barcelona, Spain) and characterized as described previously (23). The peptides used for immunization correspond to a 19-amino acid sequence of the third intracellular loop of A1Rs (PC11 antibody) and a 14-amino acid sequence of the second extracellular loop of A1Rs (PC21 antibody). The antiserum generated was purified by affinity chromatography using the specific peptide coupled to Sepharose CL4B. Sheep anti-rabbit IgG-fluorescein F(ab′)2 fragment and horseradish-peroxidase-conjugated goat anti-rabbit IgG were purchased from Boehringer-Mannheim. Purified anti-phospho-serine (clone 1C8 plus 4A3) and anti-phospho-threonine (clone 1E11) monoclonal antibodies were purchased from BIOMOL (Hamburg, Germany), and anti-phospho-tyrosine monoclonal antibody (clone PT-66) was from Sigma Chemical.
Cell cultures, membrane preparation, and protein determination.
DDT1MF-2 smooth muscle cells, originally isolated from a steroid-induced leiomyosarcoma of Syrian hamster vas deferens (4), were cultured (37° in 5% CO2) in DMEM. CACO-2 cells, an epithelial cell line derived from human colon carcinoma, were cultured in DMEM. CHO cells were cultured in DMEM/Ham’s F-12 nutrient mixture (1:1 v/v) medium, and Jurkat cells, derived from human T leukemia, were grown in RPMI 1640 medium (all media were from Whittaker, Walkersville, NY). Media were supplemented with 1% nonessential amino acids, 2 mm l-glutamine, 1 mm sodium pyruvate, and 10% (v/v) fetal calf serum (CACO-2, CHO, and Jurkat cells) or 5% (v/v) fetal calf serum and 5% (v/v) horse serum (DDT1MF-2 cells). All sera were from GIBCO (Grand Island, NY). For desensitization and sequestration experiments, DDT1MF-2 cells were grown in the absence or presence of 50 nm (R)-PIA and/or 50 nm DPCPX, 50 μm Clφ-cAMP, or 10 nm PMA. After the indicated incubation time, cells were washed in cold PBS; then, binding experiments, immunoblotting, determination of [3H]inositol phosphate accumulation, intracellular calcium determination, and/or immunocytochemistry assays were performed.
Cell membranes from DDT1MF-2, CHO, CACO-2, and Jurkat cells were obtained by centrifugation after disruption of cells with a Polytron homogenizer (Kinematica, PTA 20 TS rotor, setting 4; Brinkmann Instruments, Westbury, NY) for three 5-sec periods. The buffer used was 50 mm Tris·HCl, pH 7.4. Nuclei and cell debris were separated by centrifugation (900 × g, 4°). Membranes were then separated at 105,000 × g(90 min, 4°). The pellet was resuspended in 50 mmTris·HCl buffer for immediate use.
Protein was measured by the bicinchoninic acid method (Pierce Chemical, Rockford, IL), as described by Sorensen and Brodbeck (24).
Radioligand-binding experiments and analysis of binding data.
For agonist binding to intact cells, cells pretreated as indicated above were harvested and resuspended (1 × 10⁶ cells/ml) in assay medium (serum-free DMEM buffered with 20 mm HEPES, pH 7.4). Cells were preincubated with 0.2 units/ml ADA for 30 min at 4°. Aliquots (0.1 ml) were then added to 96-well microtiter plates containing [3H](R)-PIA (eight concentrations of 0.01–200 nm; experiments performed in triplicate) in a final volume of 0.2 ml. Nonspecific binding was defined as that occurring in the presence of a 500-fold excess of DPCPX. Binding was carried out at 4° for 4 hr. In the case of membranes, suspensions were incubated with 0.2 unit/ml adenosine deaminase (30 min, 25°) before the addition of the radioligand (12 nm final concentration). Binding, performed in 96-well microtiter plates, was carried out at 20° for 2.5 hr. Binding was stopped by a rapid filtration over glass-fiber filters (GF/C filters; Whatman, Maidstone, UK) in a Brandel cell harvester (Brandel Biomedical Research and Development Laboratories, Gaithersburg, MD). Filters were then washed in 5 ml of ice-cold PBS (cells) or Tris·HCl buffer (membranes). Filters were transferred to scintillation vials, and 10 ml of scintillation fluid (Formula-989; New England Nuclear Research Products) was added. Vials were shaken overnight and counted using a Packard 1600 TRI-CARB scintillation counter with 50% of efficiency.
Data from saturation isotherms were analyzed by nonlinear regression as described previously (25).
Second messenger determination.
For intracellular calcium measurement, cells (106 cells/ml) were loaded with 5 μm Fura-2 AM for 30 min at 37°. For short term desensitization, loaded cells were washed and incubated (5 min, 37°) in HBSS (1.2 mm CaCl2, 20 mm HEPES, pH 7.4) containing the indicated reagents [50 nm (R)-PIA, 50 μm Clφ-cAMP, or 10 nm PMA]. It should be noted that for long term desensitization, reagents [50 nm (R)-PIA or 50 nm DPCPX] were incubated for 48 hr before the loading step. In all cases, cells were washed and subsequently incubated in HBSS containing 0.2 unit/ml ADA. Calcium peak induction was achieved by the addition of (R)-PIA. (R)-PIA concentration was 50 nm for short term desensitization and 1 nm to 10 μm for long term desensitization. Calcium concentration was determined at 30° in a dual-wavelength Shimadzu RF-5000 spectrofluorophotometer (Shimadzu Europe, Duisberg, Germany) by using the excitation wavelength ratio of 334/366 nm with emission cutoff at 500 nm. Free calcium concentration was calculated as described previously (26).
For the phosphoinositide assay, cells (0.5–1 × 10⁵/ml) were grown (40–48 hr) in inositol-free medium (DMEM supplemented with 5% horse serum and 5% fetal calf serum, both dialyzed against inositol-free DMEM) containingmyo-[3H]inositol (5 μCi/ml). Washed cells, subsequently incubated with the indicated reagents, were collected; washed exhaustively in prewarmed (37°) PBS containing 0.5 mm MgCl2 and 0.9 mmCaCl2; and incubated (106/0.2 ml of PBS) in PBS containing 10 mm LiCl and 0.2 unit/ml ADA for 10 min. The phosphoinositide production was initiated by the addition of 0.1 ml of prewarmed PBS containing (R)-PIA (concentration, 50 nm for short term desensitization and 1 nm to 10 μm for long term desensitization). After 30 min, the assay was ended by perchloric acid protein precipitation (30 min on ice). Neutralized samples (4 m KOH, 1 m Tris, 60 mm EDTA) were centrifuged for 20 min at 3000 ×g, and the aqueous phase was loaded into a Poly-Prep chromatography column (BioRad, Hercules, CA) containing 1 g of an anion exchange resin (AG 1-Xi; 200–400 mesh; formate form). The total inositol phosphate pool was eluted according to the method of Berridgeet al. (27), and the radioactivity was measured.
Immunostaining experiments.
For flow cytometry measurements, pretreated cells were harvested, rinsed in PBS, and then fixed in 4% paraformaldehyde in PBS for 15 min or fixed and permeabilized (4°, 1 hr) in 70% ethanol/30% PBS. Cells were washed in PBS containing 20 mm glycine (buffer A) to quench the aldehyde groups. After a 30-min incubation in buffer A containing 1% bovine serum albumin (buffer B), cells were incubated first with anti-A1Rs (PC21 or PC11; 40 μg/ml) for 1 hr at 37°, washed, and stained with fluorescein-conjugated anti-rabbit IgG antibody. As control, an irrelevant rabbit IgG was used. Stained cells were analyzed with an EPICS Profile flow cytometer (Coulter, Hialeah, FL). Mean fluorescein fluorescence from 5000 cells was measured, and the mean value of triplicate experiments was presented as percentage of control cells.
For immunofluorescence staining, cells growing onto glass coverslips were incubated in the absence or presence of 50 nm(R)-PIA, 50 μm Clφ-cAMP, or 10 nm PMA in complete medium for 5, 15, or 45 min. They were then rinsed in PBS, fixed in 4% paraformaldehyde in PBS for 15 min, and washed in buffer A. After a 30-min incubation with buffer B, immunofluorescence staining was performed by applying a fluorescein-conjugated rabbit anti-A1Rs (PC21 antibody; 100 μg/ml, 60 min at 37°). The coverslips were rinsed for 30 min in buffer B and mounted with immunofluorescence medium (ICN Biomedicals, Costa Mesa, CA).
To analyze receptor internalization by immunocytochemistry, cells growing onto glass coverslips in the presence of a fluorescein-conjugated rabbit anti-A1Rs (PC21 antibody; 5 μg/ml), were incubated with or without 50 nm(R)-PIA and 50 μm Clφ-cAMP or 10 nm PMA in a complete medium for 5, 12, 24, 48, and 72 hr and then rinsed in PBS. At this step, it is important to note that fluorescein-conjugated PC21, which was interacting with membrane receptor in nonfixed cells, was removed, and only internalized fluorescein-conjugated PC21 remained in the preparation. Cells were then fixed in 4% paraformaldehyde in PBS for 15 min and washed twice in PBS containing 20 mm glycine. The coverslips were mounted as described above. The efficiency of the labeling for cells grown in the presence of fluorescein-conjugated PC21 and fixed afterward is lesser than that for cells fixed and then treated with fluorescein-conjugated PC21 (compare Figs.1 and 3).

Modulation by (R)-PIA, PMA, or Clφ-cAMP of the distribution of cell surface A1Rs. Cells were treated with serum-free DMEM in absence (a) or presence of 50 nm (R)-PIA (b),10 nm PMA (c), or 50 μm Clφ-cAMP (d) for 15 min. After treatment, nonpermeabilized cells were fixed (4% paraformaldehyde) for 15 min and washed in PBS/20 mm glycine. The immunofluorescence staining was performed as indicated in Experimental Procedures using a fluorescein-conjugated rabbit anti-A1R (PC21 antibody; 100 μg/ml), and fluorescence on the cell surface was observed with a confocal microscope. A reconstruction obtained by superimposition of a number of images corresponding to horizontal sections of the cells is shown. Scale bars on bottom right, 10 μm.
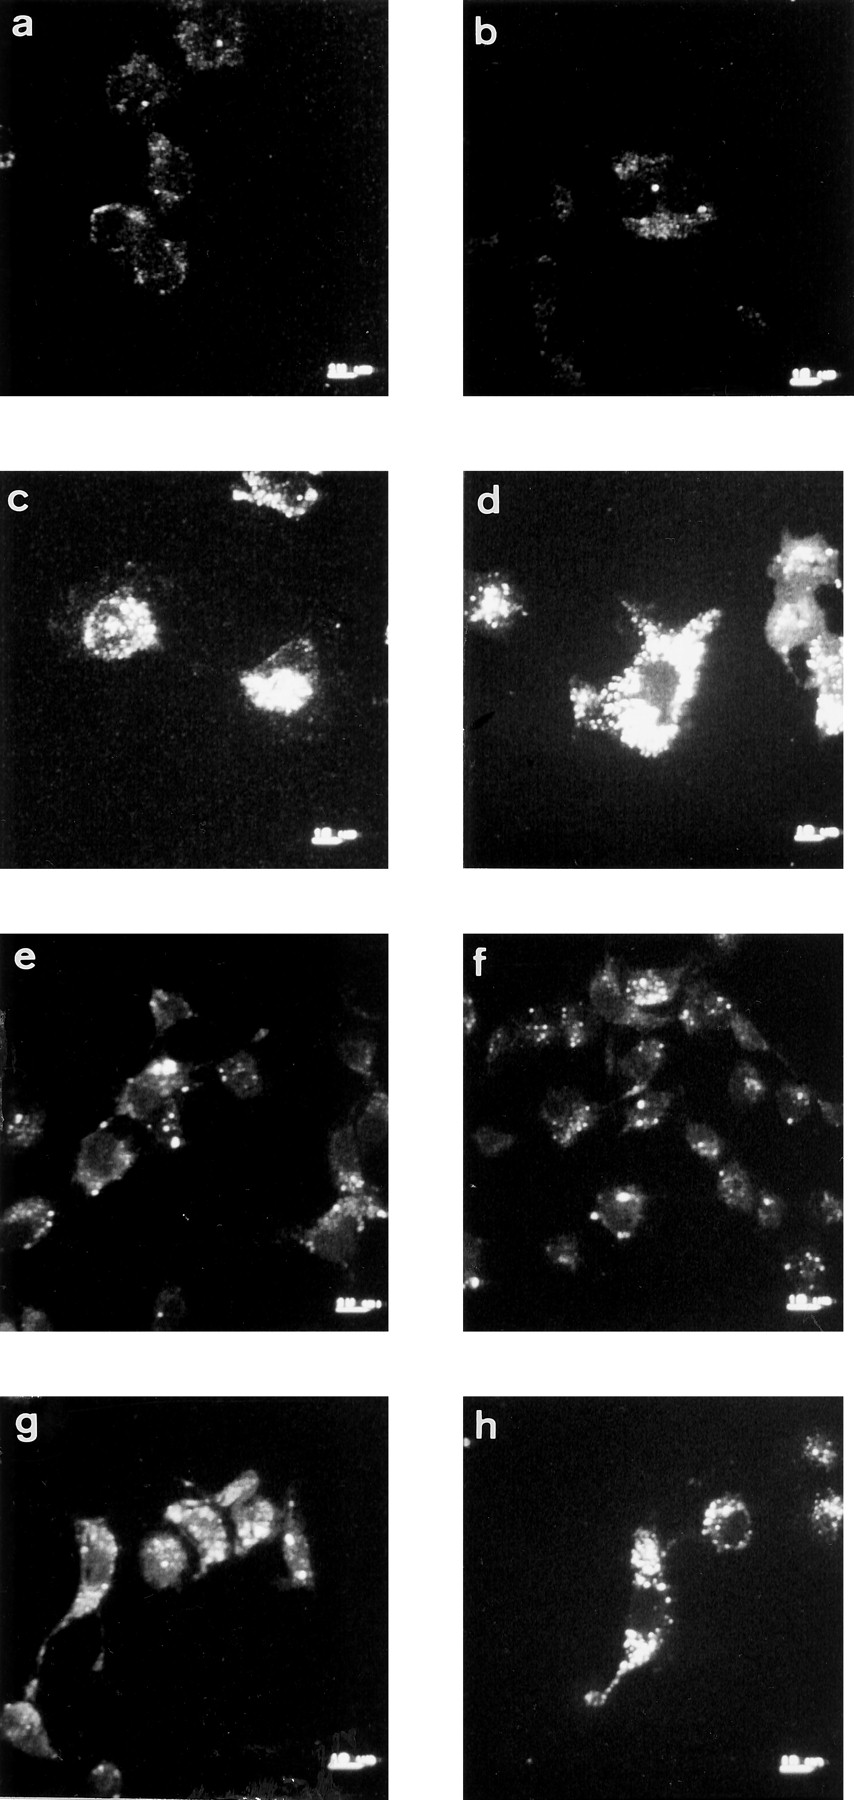
Internalization of cell surface A1Rs induced by (R)-PIA, PMA, or Clφ-cAMP. Cells were grown in DMEM containing a fluorescein-conjugated rabbit anti-A1R (PC21 antibody; 5 μg/ml) in the absence (a and b) or presence of 50 nm (R)-PIA (c and d), 10 nm PMA (e and f), or 50 μm Clφ-cAMP (g and h) for 12 (a, c, e, and g) or 24 (b, d, f, and h) hr. After treatment, cells were fixed, mounted in immunofluorescence medium, and observed with confocal microscopy. Images correspond to a horizontal section at the middle of the cell. Scale bars on bottom right, 10 μm.
Confocal microscope observations were made with a Leica TCS 4D (Leica Lasertechnik GmbH, Heidelberg, Germany) confocal scanning laser microscope adapted to an inverted Leitz DMIRBE microscope.
Phosphorylation, autoradiography, and immunoblotting.
Cells (50 × 106), harvested and washed twice in phosphate-free DMEM, were incubated at 37° for 2 hr with 10 ml of phosphate-free DMEM, and 20 mm HEPES, pH 7.4, containing 1 mCi of [32P]orthophosphate, to label the intracellular ATP pool. After 32P incorporation, cells were washed twice with DMEM to remove unincorporated radioactivity. Loaded cells were resuspended (1 × 10⁶ cells/ml) in DMEM and incubated at 37° for 5 min with the indicated reagents. Cells were harvested and washed twice in ice-cold PBS before disruption and solubilization for 1 hr on an ice bath with 0.5 ml of lysis buffer [1% (v/v) Nonidet P-40, 20 mm HEPES, pH 7.4, 100 mm NaCl, 1 mmNa3VO4, 50 mmNaF, 1 mm phenylmethylsulfonyl fluoride, 10 μg/ml concentrations of leupeptin, pepstatin, chymostatin, and antipain]. The solubilized preparation was centrifuged at 80,000 ×g for 90 min, and the solubilized material (1 mg of protein/ml) was processed for immunoprecipitation, SDS-PAGE, and autoradiography as described previously (23).
For immunoblotting with anti-phospho-amino acid antibodies, cells were first stimulated at 37° in DMEM and then lysed as described above. Immunoprecipitation of A1Rs was carried out using the PC11 antibody. SDS-PAGE and immunoblotting were performed, as described previously (23), using anti-phospho-tyrosine (dilution, 1:2000), anti-phospho-serine (0.5 μg/ml), or anti-phospho-threonine antibody (1 μg/ml).
Statistical analysis.
Statistical comparisons were made using a two-tailed Student’s t test.
Results
Agonist-induced clustering and internalization of cell surface A1Rs.
The distribution of A1Rs on the DDT1MF-2 cell surface was determined by immunofluorescence staining using PC21 antibody directed against a sequence of the second extracellular loop of A1Rs. The receptor distribution in nonpermeabilized cells, fixed with paraformaldehyde, was analyzed by confocal microscopy. An image corresponding to receptor distribution on the surface of these cells is shown in Fig. 1a. Confirmation that cells were not permeabilized was obtained through the lack of intracellular labeling when a section of the cell was analyzed and through the absence of specific labeling when using PC11 antibody, which is directed against an intracellular loop of the receptor (not shown). The antibody did not lead to specific labeling in cells that do not express A1Rs (Jurkat or CHO cells), whereas the labeling was present in CACO-2 cells, which express the receptor (Fig. 2). In comparison with DDT1MF-2 cell membranes [0.41 ± 0.03 pmol [3H](R)-PIA bound/mg of protein], the specific [3H](R)-PIA binding in Jurkat or CHO cell membranes was negligible (0.001 ± 0.001 and 0.003 ± 0.002, respectively), whereas it was moderate in CACO-2 cell membranes (0.06 ± 0.01). After DDT1MF-2 cell exposure to the A1R agonist (R)-PIA (50 nm), bright punctate accumulations of antigen appeared, which is suggestive of receptor clustering in some parts of the membrane. Clustering appeared at short times (5 min) and was more evident after 15 or 45 min of (R)-PIA treatment (Fig. 1b). Confocal analysis of cells using fluorescein-conjugated PC21 antibody also indicated internalization of the receptor in response to chronic exposure to 50 nm (R)-PIA. Confocal microscopy permits scanning of multiple thin (1 μm) parallel sections through individual cells and facilitates optical separation of cytosolic from plasma membrane fluorescence. No significant receptor internalization was observed after 5 hr of incubation with 50 nm(R)-PIA (not shown). However, after 12 or 24 hr, cells showed a large number of internalized receptors in small intracellular vesicles (Fig. 3, c and d). No increase in receptor internalization was observed after 72 hr of (R)-PIA treatment; thus, the chronic exposure of cells to the adenosine agonist (R)-PIA led to a time-dependent translocation of A1Rs to intracellular stores, which was evident at 5–12 hr and maximal at 12–48 hr of treatment.

Expression of A1Rs in CACO, Jurkat, and CHO cells. Cells, growing onto glass coverslips (a, CACO-2) or in suspension (b, Jurkat; c, CHO) were washed twice in PBS, fixed (4% paraformaldehyde) for 15 min, and washed in PBS/20 mmglycine. The immunofluorescence staining was performed as indicated in Experimental Procedures using a fluorescein-conjugated rabbit anti-A1R (PC21 antibody; 100 μg/ml), and fluorescence on the cell surface was observed with confocal microscopy. Representative images corresponding to a horizontal section at the middle of the cell are shown. Scale bar on bottom left, 10 μm.
Phosphorylation of A1Rs in DDT1MF-2 cells.
To analyze whether protein phosphorylation occurs in parallel to A1R clustering and internalization, the level of phosphorylation of A1R molecules was analyzed in naı̈ve cells or in cells pretreated with the agonist. Phosphorylation was induced by a 5-min treatment with 50 nm (R)-PIA in DDT1MF-2 cells metabolically labeled with32Pi in serum-free medium. After the assay, A1R molecules were immunoprecipitated using the affinity-purified specific anti-A1R antibody PC11, which immunoprecipitates photoaffinity-labeled A1Rs in porcine brain cortex (28) and in DDT1MF-2 cells (29). The immunoprecipitate from untreated cells, analyzed by SDS-PAGE and autoradiography, gave rise to a single phosphorylated band of 36 kDa corresponding to the A1Rs. No phosphorylated material of 36 kDa was immunoprecipitated using an irrelevant rabbit IgG. Under similar conditions, (R)-PIA induced a rapid increase in phosphorylation. Phosphorylation of A1Rs was also observed when cells were treated with a PKC activator, PMA, or a PKA activator, Clφ-cAMP (Fig.4).

Increase in basal phosphorylation of A1Rs induced by ligand or activators of protein kinases.32P-loaded cells were preincubated for 5 min, in the presence of 0.2 unit/ml adenosine deaminase, with vehicle (Control), 50 nm (R)-PIA, 50 μm Clφ-cAMP, or 10 nm PMA. A1Rs were immunoprecipitated and resolved by SDS-PAGE. Arrow, electrophoretic band (36 kDa) corresponding to A1Rs. Receptor phosphorylation was quantitatively analyzed with a Computing Densitometer (Molecular Dynamics, Sunnyvale, CA) and expressed as percentage of the basal level of receptor phosphorylation seen in control cells. Data are mean ± standard error from three separate experiments. ∗, p < 0.01; ∗∗,p < 0.005 compared with control.
Immunoprecipitates were also analyzed by immunoblotting using monoclonal antibodies against phospho-tyrosine, phospho-serine, or phospho-threonine (see Experimental Procedures). Activation of PKA or PKC led to phosphorylation of A1Rs in serine and threonine. In contrast, ligand-induced activation of A1Rs led to phosphorylation of the receptor in tyrosine and, to a lesser extent, serine (Fig.5). Therefore, A1Rs are susceptible to phosphorylation by various kinases depending on the stimulus.

Immunodetection of phospho-amino acids in A1Rs. Cells were treated (10 min), in the presence of 0.2 unit/ml adenosine deaminase, with vehicle (Control), 50 nm (R)-PIA, 50 μm Clφ-cAMP, or 10 nm PMA. After cell lysis, A1Rs were immunoprecipitated and treated as described in Experimental Procedures. Immunoblots were analyzed with anti-phospho-tyrosine, anti-phospho-serine, or anti-phospho-threonine. Arrow, electrophoretic band (36 kDa) corresponding to A1Rs.Top, quantitative densitometric analysis of film from a representative experiment performed in triplicate using a Computing Densitometer (Molecular Dynamics). ∗, p < 0.02; ∗∗, p < 0.01; ∗∗∗, p< 0.001 compared with control.
To test whether receptor phosphorylation could be related to receptor clustering, immunocytochemical detection of A1Rs was performed on the surface of nonpermeabilized cells treated with Clφ-cAMP or PMA. Both compounds induced cell surface clustering of A1Rs (Fig. 1, c and d). In experiments using fluorescein-conjugated PC21 antibody receptor internalization induced by the PKA or PKC activators was detected (Fig. 3, e–h).
Desensitization and down-regulation of A1Rs.
The thermodynamic characteristics of functional A1Rs present on the cell surface were examined after agonist or antagonist pretreatment. Analysis of the equilibrium binding of [3H](R)-PIA to untreated DDT1MF-2 cells is consistent with one low affinity state for the receptor (Table1). It has been suggested that the absence of high affinity sites in intact cells is due to a high cellular concentration of GTP, which uncouples receptor from G proteins (4). After a 48-hr exposure to 50 nm (R)-PIA or 50 nm DPCPX, the equilibrium constant for [3H](R)-PIA binding did not change (Table 1). On the other hand, maximum binding decreased in (R)-PIA-treated cells, whereas it increased in DPCPX-treated cells (Table 1).
Equilibrium dissociation constant and maximum binding of [3H]-(R)-PIA to DDT1MF-2 cells after 48-hr exposure to (R)-PIA or DPCPX
To analyze the receptor distribution in cells treated with agonists or antagonists, a set of binding experiments with radioligands and quantification of A1Rs molecules by immunoblotting and flow cytometry using antibodies against A1Rs were performed. Preincubation of DDT1MF-2 cells with 50 nm(R)-PIA resulted in a time-dependent reduction in [3H](R)-PIA-specific binding sites. The loss was already evident after 3 hr of preincubation but reached a maximum (50%) at 48 and 72 hr (Fig. 6A). In contrast, chronic exposure of the cells to the adenosine receptor antagonist DPCPX (50 nm) resulted in an increase in [3H](R)-PIA-specific binding sites, which peaked (30%) at 24 hr and did not change during the following 24 hr of treatment. Furthermore, the antagonist DPCPX (50 nm) counteracted the agonist-induced loss of binding sites (Fig. 6A). To determine whether the variation of [3H](R)-PIA binding sites correlated with the presence of receptor molecules at the plasma membrane, flow cytometry experiments using the antibody PC21, directed against an extracellular epitope of A1Rs, were performed in nonpermeabilized cells pretreated with the agonist or antagonist. The lack of label when using the PC11 antibody, which was raised against an intracellular epitope of A1Rs, indicates that the plasma membrane was intact; therefore, the label obtained by using PC21 antibody is a direct measurement of the number of cell surface A1Rs (Fig. 6B). The 30% increase in [3H](R)-PIA binding sites in cells pretreated for 48 hr with 50 nm DPCPX correlated with a similar increase in intensity of fluorescence at the surface level (Fig. 6B, left). This is a characteristic feature of antagonist-induced up-regulation of A1Rs. On the other hand, the decrease in [3H](R)-PIA binding sites found in cells pretreated for 48 hr with 50 nm (R)-PIA (50%) was higher than the decrease in fluorescence intensity (30%, Fig. 6B, left). These results suggest that after (R)-PIA treatment of the cells, 30% of the receptor molecules disappear from the cell surface and the remaining 20% of cell surface A1Rs molecules are unable to bind ligands.
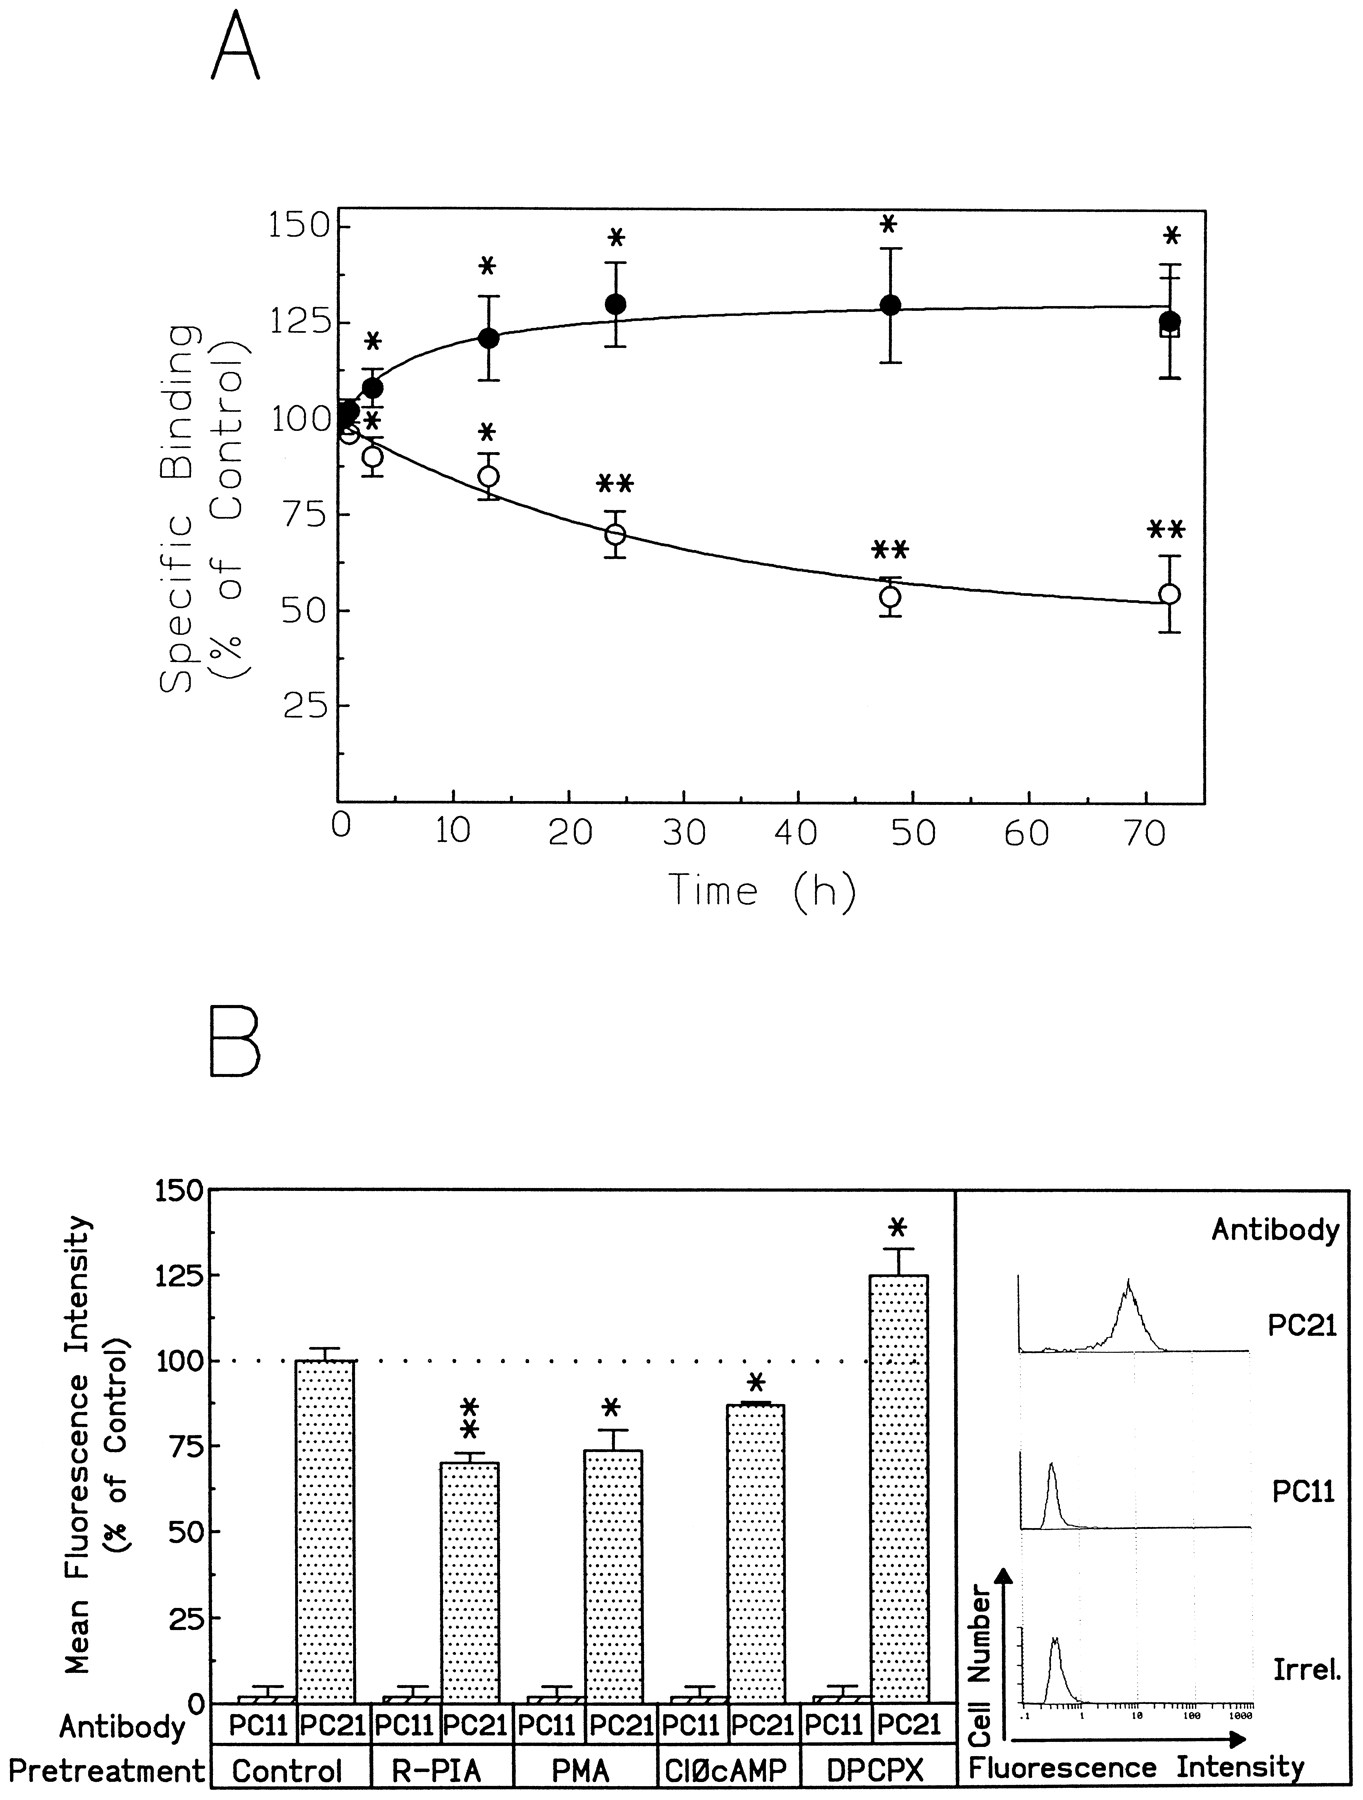
Ligand-induced modulation of the A1R cell surface expression. A, Binding experiments with cells preincubated with 50 nm (R)-PIA or 50 nmDPCPX. The concentration of the ligand [3H](R)-PIA was 5 nm. Data are mean ± standard deviation of four separate experiments performed in triplicate. ∗, p < 0.05; ∗∗,p < 0.005 compared with binding at zero time. B, Flow fluorocytometry of surface A1Rs. Untreated cells (control) or cells preincubated with 50 nm(R)-PIA, 50 nm DPCPX, 10 nm PMA, or 50 μm Clφ-cAMP for 48 hr were washed, fixed, and analyzed as described in Experimental Procedures. As a control, an irrelevant (Irrel.) rabbit IgG was used.Left, mean fluorescein fluorescence from 5000 cells was measured, and the mean ± standard deviation value of triplicate determinations was presented as percentage of control cells. ∗,p < 0.05; ∗∗, p < 0.01 compared with control. Right, intensity of A1R fluorescence in nonpermeabilized cells (representative experiment).
To determine whether the (R)-PIA-induced disappearance of A1Rs from the cell surface was due to a down-regulation of the receptor, the total number of A1Rs molecules present in DDT1MF-2 cells pretreated with 50 nm(R)-PIA or 50 nm DPCPX was quantified by immunoblotting. After 48 hr of agonist treatment, a 20% decrease in A1R label was observed, whereas a 30% decrease was seen after 72 hr of treatment (Fig.7A). The agonist-induced reduction in receptor molecules detected by immunoblotting appeared later than the reduction detected by [3H](R)-PIA-specific binding assays. The 20% down-regulation (reduction in the number of receptor molecules per cell) of A1Rs after 48 hr of 50 nm (R)-PIA treatment was confirmed by flow cytometry using permeabilized cells and either of the two antibodies, PC21 and PC11, which recognize an extracellular and an intracellular epitope, respectively, of A1Rs (Fig. 7B). On the other hand, pretreatment of cells with the antagonist had no effect on the total number of A1Rs molecules detected by immunoblotting.

Down-regulation of A1Rs in DDT1MF-2 cells. A, Cells were grown in the absence or presence of 50 nm (R)-PIA or 50 nm DPCPX for the indicated time. Cells were then washed twice in cold PBS before disruption by treatment with SDS-PAGE sample buffer. Equal amounts of protein (20 μg of protein) were applied to each lane and electrophoresed in SDS-containing buffer. Immunoblotting was performed using PC11 antibody as described in Experimental Procedures. Arrow, electrophoretic band (36 kDa) corresponding to the A1Rs. The amount of receptor was quantitatively analyzed with a Computing Densitometer (Molecular Dynamics) and expressed as percentage of the amount found in control cells. Data are mean ± standard deviation from three separate experiments. ∗, p < 0.05 compared with control. B, Flow fluorocytometry of total A1Rs in permeabilized cells. Untreated cells (control) or cells preincubated with 50 nm (R)-PIA or 50 nm DPCPX for 48 hr were washed, fixed, permeabilized, and analyzed by flow cytometry as described in Experimental Procedures. As a control, an irrelevant rabbit IgG was used. Left, mean fluorescein fluorescence from 5000 cells was measured, and the mean ± standard deviation value of triplicate determinations was presented as percentage of control cells. ∗, p < 0.05 compared with control. Right, intensity of A1R fluorescence in permeabilized cells (representative experiment).
Functional consequences of desensitization.
Experiments of second messenger production were carried out to analyze the effect of desensitization on signaling via A1Rs. In DDT1MF-2 cells, (R)-PIA increased the level of [3H]inositol phosphates and mobilized intracellular calcium in a concentration-dependent manner, with EC50 values of 8 ± 2 and 11 ± 2 nm, respectively (Table 2). Chronic treatment (48 hr) with 50 nm (R)-PIA reduced the agonist-induced [3H]inositol phosphate accumulation and calcium peak by 35% without changing the EC50 values (Table 2). On the other hand, no significant changes were observed in agonist-induced second messenger production after 50 nm DPCPX pretreatment of cells (Table2). These results indicate that the DPCPX-induced appearance of A1Rs on the cell surface was not related to potentiation of signal transduction events in response to a saturating concentration of agonist.
Agonist-induced [3H]inositol phosphate accumulation and calcium mobilization in cells pretreated with (R)-PIA or DPCPX
The effect of activators of PKA or PKC in functional short term desensitization of A1Rs was analyzed at 5 min of preincubation with Clφ-cAMP or PMA. The results were compared with those obtained after preincubation with 50 nm(R)-PIA. Treated cells were washed, and A1Rs were activated using 50 nm(R)-PIA. In all cases, treated cells responded less to the stimuli than did cells preincubated with buffer alone. Quantitatively, the effect of pretreatment with either Clφ-cAMP or PMA was higher than the effect of 5-min pretreatment with the agonist in both calcium mobilization and inositol phosphate accumulation (Fig.8). These results indicate that functional short term desensitization of A1Rs can be mimicked by activation of serine/threonine kinases.

Agonist-induced [3H]inositol phosphate accumulation and calcium mobilization in cells pretreated with (R)-PIA, Clφ-cAMP, or PMA. For intracellular calcium measurement, cells loaded with 5 μm Fura-2 AM for 30 min at 37°, washed, and resuspended in HBSS for 30 min were preincubated (5 min at 37°) with 50 nm(R)-PIA, 50 μm Clφ-cAMP, or 10 nm PMA. Cells, extensively washed, were resuspended in HBSS containing 0.2 unit/ml ADA, and calcium peak induction was achieved by the addition of 50 nm (R)-PIA. For the phosphoinositide assay, cells (0.5–1 × 10⁵/ml) were grown (40–48 hr) in inositol-free medium containingmyo-[3H]inositol (5 μCi/ml). Cells were then incubated with 50 nm (R)-PIA, 50 μm Clφ-cAMP, or 10 nm PMA for 5 min at 37°; washed twice in prewarmed (37°) PBS containing 0.5 mm MgCl2, 0.9 mm CaCl2; and incubated (10 min) with 10 mm LiCl containing 0.2 unit/ml ADA. The phosphoinositide production was initiated by the addition of prewarmed PBS containing (R)-PIA (50 nm final concentration), 10 mm LiCl, and 0.2 unit/ml ADA. After 30 min, the assay was ended by perchloric acid protein precipitation (30 min on ice), and total inositol phosphates were determined as described in Experimental Procedures. Decreases in second messenger production were expressed as percentages respect to a control of (R)-PIA-induced second messenger production performed in cells preincubated with medium alone [i.e., in the absence of (R)-PIA, Clφ-cAMP, or PMA]; cells for these control assays were subjected to a similar treatment (washes and resuspensions) as cells incubated in the presence of (R)-PIA, Clφ-cAMP, or PMA. Data are mean ± standard deviation of three separate experiments performed in triplicate. ∗, p < 0.05; ∗∗,p < 0.01.
Discussion
In the study of G protein-coupled receptors, attenuation of agonist binding and agonist-induced signaling is classically observed after chronic agonist stimulation of the receptor (30). This attenuation is known as desensitization and is absolutely required to achieve the refractory period that follows long term exposure to an agonist. In addition to a rapid functional uncoupling between binding and second messenger generation, there is a slower event, which results in the unavailability of binding sites caused by internalization or sequestration of the receptor. DDT1MF-2 cells constitute a natural cell model in which chronic activation of A1Rs with agonist produces a decrease in total receptor number, which is associated with a functional desensitization in terms of A1R-mediated inhibition of adenylate cyclase activity (22). In the current study, the redistribution of receptors between cell surface and intracellular compartments was studied in agonist-treated cells. The generation of antibodies against A1Rs able to detect receptor molecules by immunostaining made this study possible. Using these antibodies in immunocytochemical experiments analyzed by confocal microscopy and flow cytometry, we show that chronic activation of A1Rs induces a rapid receptor clustering on the DDT1MF-2 cell surface that is followed by receptor internalization. The agonist-induced internalization was detected by the presence of small intracellular vesicles containing fluorescein-conjugated anti-A1R antibody complexes. To determine whether A1Rs sequestering into intracellular compartments led to receptor degradation, immunoblotting assays were used to quantify the total content of the receptor in DDT1MF-2 cells treated or not treated with (R)-PIA. Results (Fig. 7) indicate that there is an agonist-induced loss in the total content of A1Rs (down-regulation), which is slower than the agonist-induced internalization. These findings agree with the hypothesis that some of the internalized G protein-coupled receptors are targeted for degradation, whereas others are recycled back to the cell surface (29). As occurs with 5-hydroxytryptamine2A receptors, which in response to the agonist are internalized via the endosome pathway (16), (R)-PIA-induced internalization of A1Rs is prevented by the antagonist (Fig. 6A) and does not occur at 4° (not shown).
The disappearance of binding sites from the cell surface at 48 hr of agonist treatment was only partly due to receptor internalization. In fact, the reduction of [3H](R)-PIA binding sites was higher than the decrease in fluorescence intensity due to cell surface receptors detected by flow cytometry. Because this discrepancy is not due to changes in theKd value for (R)-PIA binding before and after the chronic activation of A1Rs (Table 1), these results indicate the presence of cell surface receptors in a state of unresponsiveness [i.e., receptor molecules that do not bind (R)-PIA and are not coupled to the signal transduction machinery]. The presence of these desensitized cell surface receptors is predicted by the cluster-arranged cooperative model, which accounts for the kinetic of binding to A1Rs (31). The model consists of two different conformations of the receptor in an equilibrium that depends on the ligand concentration. According to this model of negative cooperativity, high concentrations of agonists would lead to undetectable binding sites due to a very low affinity of some of the receptor molecules for the ligand (31).
The results presented here also show that incubation of DDT1MF-2 cells with the A1R agonist (R)-PIA induced a rapid increase in receptor phosphorylation, which correlated with the ligand-induced clustering of the receptor at the surface of DDT1MF-2 cells (Figs. 1b, 3, and 4). Functional uncoupling of G protein-coupled receptors often seems to be triggered by phosphorylation (see Ref. 5for a review). There are, however, exceptions, such as secretin receptors, whose major mechanism of desensitization consists of phosphorylation-independent receptor internalization (32). Interestingly, substitution by alanine of candidate residues for phosphorylation of α2a-adrenergic receptors by β-adrenergic receptor kinase abolished the effect of epinephrine on adenylate cyclase activity without affecting internalization (33). In the case of A1Rs, it is likely that phosphorylation (in serine/threonine and/or tyrosine) is related to short term clustering and desensitization and/or to internalization. This hypothesis is deduced from the fact that activators of PKA or PKC mimicked the effect of the chronic activation of A1Rs in clustering, functional desensitization, and sequestration of the receptors in intracellular vesicles (Figs. 1,3, and 8). Despite a similar effect in internalization, the activators of PKA and PKC led to a more extensive desensitization than the A1R agonist. This may be due to the need of phosphorylation in threonine for an efficient short term desensitization. In fact, (R)-PIA does not lead to significant levels of phospho-threonine-containing A1Rs (Fig. 5). Potential phosphorylation sites for PKC and PKA are found in the third intracellular loop of the receptor (28); a single consensus sequence for PKA phosphorylation is also present in the second intracellular loop (28). On the other hand, A1R is a putative substrate for β-adrenergic receptor kinase (34) and, perhaps, for other G protein-coupled receptor kinases.
The β1- and β2-adrenergic receptors desensitize faster than β3-adrenergic receptors. This different behavior has been attributed to the susceptibility of the carboxyl-terminal region of these proteins to phosphorylation by serine/threonine kinases. Thus, β3-adrenergic receptors do not contain serine or threonine in their carboxyl-terminal end (35, 36). Similarly, mutation of carboxyl-terminal threonine residues in human m3 muscarinic receptor modulates the extent of sequestration and desensitization (13). Interestingly, the absence from A1Rs of serine and threonine residues near the carboxyl terminus, which are present in several G protein-coupled receptors, does not prevent a rapid ligand-induced desensitization. However, the lack of serine/threonine residues in the carboxyl-terminal cytoplasmic tail would be related to the slow internalization of A1Rs after cell exposure to (R)-PIA or activators of PKA or PKC. In fact, the major difference between A1Rs and other G protein-coupled receptors is the slow kinetics of agonist-induced internalization (sequestration). For most receptors, this is rapid, usually maximal at 30 min, whereas for A1Rs, maximal internalization occurs between 12 and 48 hr after agonist treatment. We have evidence that internalization of A1Rs in DDT1MF-2 cells does not take place by means of clathrin-coated vesicles but may be mediated by other components of the endosomal pathway.2
Agonist-stimulated phosphorylation of adenosine receptors in tyrosine has not been reported previously. To our knowledge, there is only one other member of the family of G protein-coupled receptors, the type 1 angiotensin II receptor, whose basal level of tyrosine phosphorylation is enhanced by the agonist (37). Although it cannot be ruled out that tyrosine phosphorylation is involved in short term desensitization, the fact that serine/threonine kinases mimic the ligand-induced clustering and functional desensitization of the receptor makes the involvement of tyrosine phosphorylation in these events unlikely. Mechanistically, activation of a protein tyrosine kinase by ligands of G protein-coupled receptors might be mediated by the βγ subunits of G proteins (38). This is a novel mechanism by which signal transduction via G protein-coupled receptors can be linked to mitogen-activated protein kinase activation (38, 39). Classic pathways of mitogen-activated protein kinase activation require interaction of SH2-containing proteins with phospho-tyrosine residues present in receptors with tyrosine kinase activity or in receptors associated with Src-related tyrosine kinases. By analogy, the physiological role of tyrosine phosphorylation of A1Rs might be related to signaling via SH2-containing proteins.
Acknowledgments
We thank Robin Rycroft (Serinevei d’Assessorament de la Universitat de Barcelona) for excellent technical assistance in preparation of the manuscript. We thank Catalina Relaño (Servei de Cultius Celulars) and Susana Castel and Jaume Comas (Serveis Cientı́fico-Tècnics) for their technical assistance.
Footnotes
- Received February 18, 1997.
- Accepted July 23, 1997.
-
Send reprint requests to: Prof. Rafael Franco, Departament de Bioquı́mica i Biologia Molecular, Facultat de Quı́mica, Martı́ i Franquès, 1, 08028 Barcelona, Spain. E-mail: r.franco{at}sun.bq.ub.es
-
↵1 Current affiliation: MRC Anatomical Neuropharmacology Unit, University of Oxford, Oxford OX1 3TH, UK.
-
↵2 R. Franco, unpublished observations.
-
This work was supported by Comisión Interministerial de Ciencia y Tecnologica Grants PB91/0263 and PB94/0941 and Comissió Interdepartamental de Recerca i Innovació Tecnológica/Comisión Interministerial de Ciencia y Tecnologica Grant QFN93/4423. F.C. and C.S. contributed equally to this work.
Abbreviations
- A1R
- A1 adenosine receptor
- ADA
- adenosine deaminase
- PKA
- protein kinase A
- PKC
- protein kinase C
- HBSS
- Hanks’ balanced salt solution
- DMEM
- Dulbecco’s modified Eagle’s medium
- PBS
- phosphate-buffered saline
- CHO
- Chinese hamster ovary
- HEPES
- 4-(2-hydroxyethyl)-1-piperazineethanesulfonic acid
- AM
- acetoxymethyl ester
- (R)-PIA
- (R)-phenylisopropyladenosine
- DPCPX
- 1,3-dipropyl-8-cyclopentylxanthine
- PMA
- phorbol-12-myristate-13-acetate
- Clφ
- chlorophenyl
- SDS
- sodium dodecyl sulfate
- PAGE
- polyacrylamide gel electrophoresis
- The American Society for Pharmacology and Experimental Therapeutics


