


Abstract
Mobilization of intracellular Ca2+ is a critical cellular response to lysophosphatidic acid (LPA) in many cell types. Recent identification of endothelial differentiation gene (Edg) 2 and Edg4 as subtypes of G protein-coupled receptors for LPA allowed examination of the Ca2+ mobilization mediated specifically by each subtype. To reduce endogenous background levels while enhancing recombinant receptor-specific signals, the aequorin luminescence method was used to quantify cytoplasmic Ca2+ levels. In TAg-Jurkat T cells transiently co-transfected with apoaequorin and human Edg2 or Edg4 cDNA, LPA dose-dependently increased light emission triggered by increased Ca2+ bound to aequorin.N-Palmitoyl-l-serine-phosphoric acid andN-palmitoyl-l-tyrosine-phosphoric acid, which had been previously shown to be antagonists for Xenopus laevis LPA receptors, did not antagonize the Ca2+-mobilizing effects of Edg2 and Edg4. Surprisingly, they acted as agonists or partial agonists for Edg2 and Edg4. The Ca2+ mobilization by Edg2 and Edg4 was further characterized in stable transfectants of rat HTC4 hepatoma cells. By using the fura-2 fluorescence method, a difference in the kinetics of Ca2+ flux with Edg2 and Edg4 was observed. With Edg2, but not Edg4, the initial increase in the Ca2+ concentration was followed by a sustained influx of extracellular Ca2+. The coincident production of inositol phosphates and the inhibition of Ca2+ mobilization by the phospholipase C inhibitor U73122 strongly suggested that Edg2 and Edg4 mobilize Ca2+ through inositol trisphosphate generated by phospholipase C activation. Pertussis toxin almost completely blocked LPA-induced Ca2+mobilization by Edg2 but only partially blocked that by Edg4, which suggests that Edg2 transduces Ca2+ mobilization largely through pertussis toxin-sensitive Gi proteins, whereas Edg4 requires both Gi and Gq.
LPA (1-acyl-2-hydroxy-sn-glycero-3-phosphate) generated by phospholipase cleavage of membrane phospholipids has diverse biological activities (Moolenaar, 1995). LPA elicits numerous cellular responses in many types of cells, including proliferation and differentiation, morphological changes, chemotaxis, aggregation, and tissue invasion (Moolenaar, 1995). The biochemical signaling events that mediate the cellular effects of LPA include stimulation of phospholipases, mobilization of intracellular Ca2+, inhibition of adenylyl cyclase, activation of phosphatidylinositol 3-kinase, and activation of the Ras-Raf-MAP kinase cascade and Rho GTPases (Moolenaaret al., 1997).
It has been demonstrated that specific GPCRs present in many types of cells mediate cellular effects of LPA. The cloning of cDNAs encoding three structurally distinct GPCRs for LPA was recently reported. A mouse cDNA termed vzg-1 was isolated and shown to encode one such GPCR (Hecht et al., 1996). When overexpressed in neocortical neuronal cells, the Vzg-1 receptor mediated LPA-induced morphological changes, adenylyl cyclase inhibition, and increases in [3H]LPA binding sites. Our laboratory identified human Edg2, encoded by edg-2, as a functional receptor for LPA (An et al., 1997b). The amino acid sequences of the mouse Vzg-1 and human Edg2 proteins are 96% identical, suggesting that these are the same LPA receptor in the two different species. More recently, we identified a novel subtype of LPA receptor, termed Edg4 (An et al., 1998). Edg4 is highly similar in amino acid sequence to Edg2 (46% identical), but their mRNAs have different tissue distributions. Similar to Edg2, Edg4 mediates transcriptional activation of the serum response element-driven reporter gene through pathways involving both Gi protein and Rho GTPase (An et al., 1998). A third GPCR for LPA (termed PSP24), with low overall sequence similarity to Vzg-1/Edg2 and Edg4, was cloned from Xenopus laevis oocytes (Guo et al., 1996). Expression of PSP24 in X. laevis oocytes potentiated oscillatory Cl− currents in response to LPA, which could be attenuated by specific antisense oligonucleotides. PSP24 may represent a subfamily of LPA receptors very different from the Edg subfamily with respect to primary sequences, ligand binding specificities, tissue distribution, and functions.
One of the most well documented cellular activities of LPA is its mobilization of intracellular Ca2+. Extracellular addition of LPA results in increases in [Ca2+]i in many cell types, including fibroblasts, platelets, vascular smooth muscle cells, neuronal cells, astrocytes, mesangial cells, many tumor cells, andX. laevis oocytes (Watson et al., 1985; Jalinket al., 1990; Durieux et al., 1992; Inoueet al., 1995; Jalink et al., 1995; Xu et al., 1995; Keller et al., 1997; Seewald et al., 1997). LPA-induced Ca2+ mobilization can be transduced through both PTX-sensitive and PTX-insensitive G protein activation of PLC. However, Ca2+mobilization has not been shown to be mediated by any specific subtype of the newly cloned LPA receptors. In fact, doubts have been raised concerning Edg2 as an LPA receptor because of its undetectable Ca2+ responses in COS cells, Sf9 cells, andX. laevis oocytes (Moolenaar et al., 1997; Hookset al., 1998; Zondag et al., 1998). Therefore, it is imperative to directly investigate whether recombinant Edg2 and Edg4 act as LPA receptors and transduce Ca2+ signals for LPA.
In the present study, we expressed Edg2 and Edg4 in two types of cultured mammalian cells and measured their abilities to mediate LPA-induced increases in [Ca2+]i, using two different methods. For the first time, we demonstrated that both Edg2 and Edg4, when transiently transfected in human TAg-Jurkat T cells or stably transfected in rat HTC4 hepatoma cells, were capable of mobilizing intracellular Ca2+. Furthermore, kinetic characteristics of and biochemical signaling prerequisites for Edg2- and Edg4-mediated Ca2+ mobilization were further elucidated in the HTC4 stable transfectants.
Materials and Methods
Chemicals.
1-Oleoyl-2-hydroxy-sn-glycero-3-phosphate and PA were obtained from Avanti Polar Lipids (Alabaster, AL). LPC, LPE, LPG, LPS, S1P, and fatty acid-free human serum albumin were purchased from Sigma Chemical Co. (St. Louis, MO). cLPA was a generous gift from Dr. S. Kobayashi (Science University of Tokyo). Alkenyl-GP, NPSPA, and NPTyrPA were kindly provided by Dr. G. Tigyi (University of Tennessee). SuperFect transfection reagent for transient transfection was from Qiagen (Hilden, Germany). LipofectAmine, OPTI-MEM medium, and Geneticin (G418 sulfate) were from Gibco-BRL (Gaithersburg, MD). The enzyme-linked cAMP assay kit was from PerSeptive Biosystems (Framingham, MA). Jurkat leukemic T cells containing the simian virus 40 virus large T antigen (TAg-Jurkat) were obtained from Dr. J. Crabtree (Stanford University). Rat hepatoma HTC4 cells, cell culture media, and fetal bovine serum were from the University of California-San Francisco Cell Culture Facilities. An apoaequorin expression construct targeted to the cytoplasm (cytAEQ/pcDNA1), coelenterazine f, and fura-2/acetoxymethyl ester were from Molecular Probes (Eugene, OR). U73122, U73343, and PTX were purchased from Calbiochem (La Jolla, CA).myo-[3H]Inositol (specific activity, 80 Ci/mmol) was from Amersham (Arlington Heights, IL). Dowex AG-1X8 resin (200–400 mesh) was obtained from Bio-Rad (Richmond, CA).
Transient transfection of TAg-Jurkat cells and measurement of [Ca2+]i using the aequorin luminescence method.
TAg-Jurkat T cells were co-transfected with the apoaequorin expression plasmid (cytAEQ/pcDNA1) and receptor cDNA constructs, at a 1:5 ratio, using SuperFect reagent. The sequences of expression plasmids for Edg2 and Edg4 (Edg2/EF3 and Edg4/EF3, respectively) and the control vector pCDEF3 were previously reported (An et al., 1998). After 10 hr of transfection incubation in OPTI-MEM medium, cells were washed once with RPMI 1640 medium and incubated with 5 μm coelenterazine f in RPMI 1640 medium for 2 hr at 37°. Cells were then washed twice and resuspended in PBS (containing 1 mmCaCl2) at 2 × 10⁶cells/ml. Light emission resulting from Ca2+binding to the apoaequorin-coelenterazine complex was recorded by luminometry. To obtain kinetic data, aliquots of 2 × 10⁵ cells in 0.1 ml were transferred to 96-well plates, which were placed on an EG&G Berthold microplate luminometer (model LB96V). LPA and other phospholipids, dissolved in 0.1 ml of PBS containing 0.1 mg/ml human serum albumin, were added to the cells through an automated injector. Light emission was recorded every 3 sec for 60 sec, beginning immediately after the injection. To obtain integrated luminometric data, a Turner Design 20/20 luminometer was used to record light emission for 15 sec, beginning immediately after injection of LPA.
Stable transfection of HTC4 cells and measurement of [Ca2+]i using the fura-2 fluorescence method.
Rat hepatoma HTC4 cells were transfected with receptor cDNA expression construct Edg2/EF3 or Edg4/EF3 or control vector pCDEF3, containing the Geneticin-resistance gene, using LipofectAmine. Selection for stable transfectants was begun 2 days after transfection, using 10% fetal bovine serum-supplemented Dulbecco’s modified Eagle medium containing 500 μg/ml Geneticin. Geneticin-resistant colonies were isolated after an additional 14 days and cloned through limiting dilution. Levels of specific edg mRNA in each HTC4 cell transfectants were assessed by Northern blot analyses.
Quantification of [Ca2+]iand [cAMP]i in HTC4 cell transfectants expressing each subtype of LPA receptor was performed as previously described (An et al., 1994). For [Ca2+]i assays, HTC4 transfectants were cultured overnight in 100-mm dishes at approximately 75% confluency. Cells were trypsinized, washed, loaded with 2.5 μm fura-2/acetoxymethyl ester in PBS (containing 1 mm CaCl2) for 40 min at 37° in the dark, washed, and resuspended in PBS. Cuvettes containing 1 × 10⁶ fura-2-loaded cells in 1.5 ml were positioned in a Perkin Elmer LS 50B fluorometer. Fluorescence was recorded before and after addition of LPA and other phospholipids, dissolved in PBS with 0.1 mg/ml human serum albumin. The values of [Ca2+]i (in nanomolar) were calculated from the ratio of the fluorescence intensities at 340 and 380 nm. For [cAMP]i assays, transfectants cultured in 24-well plates (approximately 3 × 10⁵ cells/well) were washed with PBS, preincubated for 10 min at 37° in 0.5 ml of PBS containing 1 mm 3-isobutyl-1-methylxanthine, and exposed to 100 nm LPA, in the presence or absence of 10 μmforskolin, for 15 min at 37°. The reactions were terminated by aspiration of the medium and addition of 75% ice-cold ethanol. The amounts of cAMP extracted from each well were quantified by enzyme-linked immunoassay, according to the procedure recommended by the manufacturer.
Measurement of [3H]IP formation.
HTC4 cell transfectants expressing each subtype of LPA receptor were incubated overnight in six-well plates (1 × 10⁶cells/well). Cells were washed with HEPES-buffered Hanks’ balanced saline solution, pH 7.4, and incubated for 4 hr with 10 μCi ofmyo-[3H]inositol in Hanks’ balanced saline solution. Cells were then washed and incubated for 10 min with 10 mm LiCl and 1 mm myo-inositol. After treatment with 100 nm LPA, the incubation was stopped at the indicated times with 5% trichloroacetic acid on ice. Cell lysate supernatants were then extracted three times with water-saturated ether and neutralized with 0.2 m Tris buffer, pH 8.0. [3H]IPs were separated on Dowex AG-1X8 columns and measured according to published procedures (Berridge and Irvine, 1984). To assess the involvement of PTX-sensitive G proteins, some aliquots of cells were incubated for 6 hr in the presence of 50 ng/ml PTX before determination of LPA-induced changes in [Ca2+]i, IP formation, and [cAMP]i.
Results
Most cultured lines of mammalian cells express endogenous LPA receptors, resulting in high background values in measurements of Ca2+ mobilization by recombinant LPA receptors using the conventional fluorescence indicator method. We applied a different method, which uses the photoprotein apoaequorin from coelenterate jellyfish (Aequorea victoria). Apoaequorin forms a bioluminescent complex with the luminophore coelenterazine. Upon binding to Ca2+, this aequorin complex releases luminescence with an emission maximum of 466 nm, which can be detected by luminometry. The cDNA for apoaequorin can be expressed in mammalian cells, allowing sensitive detection of recombinant GPCR-mediated intracellular Ca2+ mobilization (Button and Brownstein, 1993; Brini et al., 1995). When transiently coexpressed with the GPCR cDNAs in the same subpopulation of cells, aequorin preferentially recorded Ca2+signals mediated by the recombinant GPCRs. We used this advantage to record Ca2+ mobilization elicited by cloned Edg2 and Edg4, with high signal/background ratios.
We chose the TAg-Jurkat cells because of their higher yields of expression plasmids containing the simian virus 40 replication origin and their relatively lower background responses. When used in the fura-2 fluorescence indicator assay, untransfected TAg-Jurkat cells responded to LPA with small but significant increases in [Ca2+]i contributed by endogenous receptors (data not shown). Transient transfection of Edg2 and Edg4 LPA receptors could not further elevate the Ca2+ responses (data not shown). However, when used in the aequorin luminescence assay, untransfected TAg-Jurkat cells showed only minimal responses to LPA and cells co-transfected with Edg2 and Edg4 showed significant increases in light emission resulting from Ca2+ binding to aequorin (Fig.1A). In Edg2 and Edg4 transfectants, light emission increased immediately after LPA addition, peaked at approximately 9–12 sec, and then gradually returned to base-line levels within 60 sec. The magnitude of LPA-induced light emission in Edg4-transfected cells was consistently greater than that in Edg2-transfected cells (Fig. 1A). As controls, the vector-transfected TAg-Jurkat T cells were stimulated with antiserum C305, a monoclonal antibody against the T cell receptor β chain (Fig. 1B). The time course of light emission elicited by C305 showed a longer delay than that evoked by LPA, which is consistent with the slow kinetics of calcium mobilization through T cell receptor activation observed using the fluorescence indicator method (Weiss and Imboden, 1987). Ionomycin at 1 μm generated a large increase in light emission, which gradually returned to base-line levels in 2 min (Fig. 1B).

Kinetics of LPA-elicited aequorin luminescence in Edg2 and Edg4 transient TAg-Jurkat cell transfectants. TAg-Jurkat T cells were co-transfected with cytAEQ/pcDNA1 and control vector or Edg2 or Edg4 cDNA construct, at a 1:5 ratio, for 10 hr using SuperFect reagent. After incubation with 5 μm coelenterazinef for 2 hr at 37°, cells were washed, resuspended in PBS, and applied to 96-well plates (2 × 10⁵ cells in 0.1 ml/well). Light emission resulting from Ca2+ binding to aequorin was recorded every 3 sec with an EG&G Berthold microplate luminometer, after automated injection of the indicated stimulants. A, Light emission (in relative light units) of vector, Edg2, and Edg4 transfectants after injection of 100 nm LPA at time 0; B, light emission of control vector transfectants after injection of a 1/1000 dilution of C305 ascites [anti-T cell receptor (anti-TCR)] or 1 μm ionomycin.
LPA-induced increases in aequorin luminescence triggered by elevated [Ca2+]i were LPA concentration-dependent (Fig. 2A). The EC50 values for Edg2 and Edg4 were 20 ± 3.2 and 18 ± 2.5 nm (mean ± standard error, three experiments), respectively, and the maximal responses were achieved with >200 nm LPA. The specificities of Edg2 and Edg4 were examined using several naturally occurring phospholipids with structures similar to that of LPA (Fig. 2B). At 1 μm, PA had significant effects in Edg4-transfected cells (p < 0.01, Student t test) but not in Edg2-transfected cells. Other phospholipids (LPG, LPC, LPE, LPS, and S1P) at 1 μm failed to induce significant responses for either Edg2 or Edg4 (Fig. 2B).

Concentration dependence and specificity of the effects of LPA and other phospholipids on Edg2- and Edg4-mediated increases in aequorin luminescence. Aequorin light emission of TAg-Jurkat cell transfectants with vector, Edg2, or Edg4 was recorded for 15 sec, beginning immediately after injection of the indicated phospholipids, with a Turner Design 20/20 luminometer. Each data point depicts the mean ± standard error of triplicate determinations from one representative experiment of three. A, Various concentrations of LPA from 1 to 1000 nm; B, 100 nm LPA or 1000 nm concentrations of other phospholipids (PA, LPG, LPC, LPE, LPS, and S1P). Data are expressed as fold increases in relative light units (r.l.u.).
Several analogs of LPA that elicited or blocked LPA-induced responses in platelets, X. laevis oocytes, and yeast have been synthesized and characterized (Sugiura et al., 1994; Liliomet al., 1996a, 1996b; Erickson et al., 1998). Tigyi and colleagues demonstrated that cLPA and alkenyl-GP were agonists and NPSPA and NPTyrPA were antagonists at the X. laevis LPA receptors (Liliom et al., 1996a, 1996b;Erickson et al., 1998). We examined the abilities of these compounds to increase [Ca2+]i-dependent aequorin luminescence in Edg2- and Edg4-transfected TAg-Jurkat cells (Fig. 3). At 1 μm, cLPA, alkenyl-GP, and NPSPA evoked increases in [Ca2+]i in Edg2 and Edg4 transfectants. NPTyrPA at 1 μm did not generate any significant response. NPTyrPA at 1 μm also failed to block the responses to 0.1 μm LPA, when added together with LPA (Fig. 3) or 30 sec before LPA (data not shown). Therefore, neither NPSPA nor NPTyrPA antagonized the Ca2+-mobilizing effect of LPA mediated by Edg2 or Edg4 human LPA receptors. This observation is supported by the recent finding that NPSPA acted as an agonist in Ca2+mobilization and adenylyl cyclase inhibition in cultured human cells (Hooks et al., 1998).
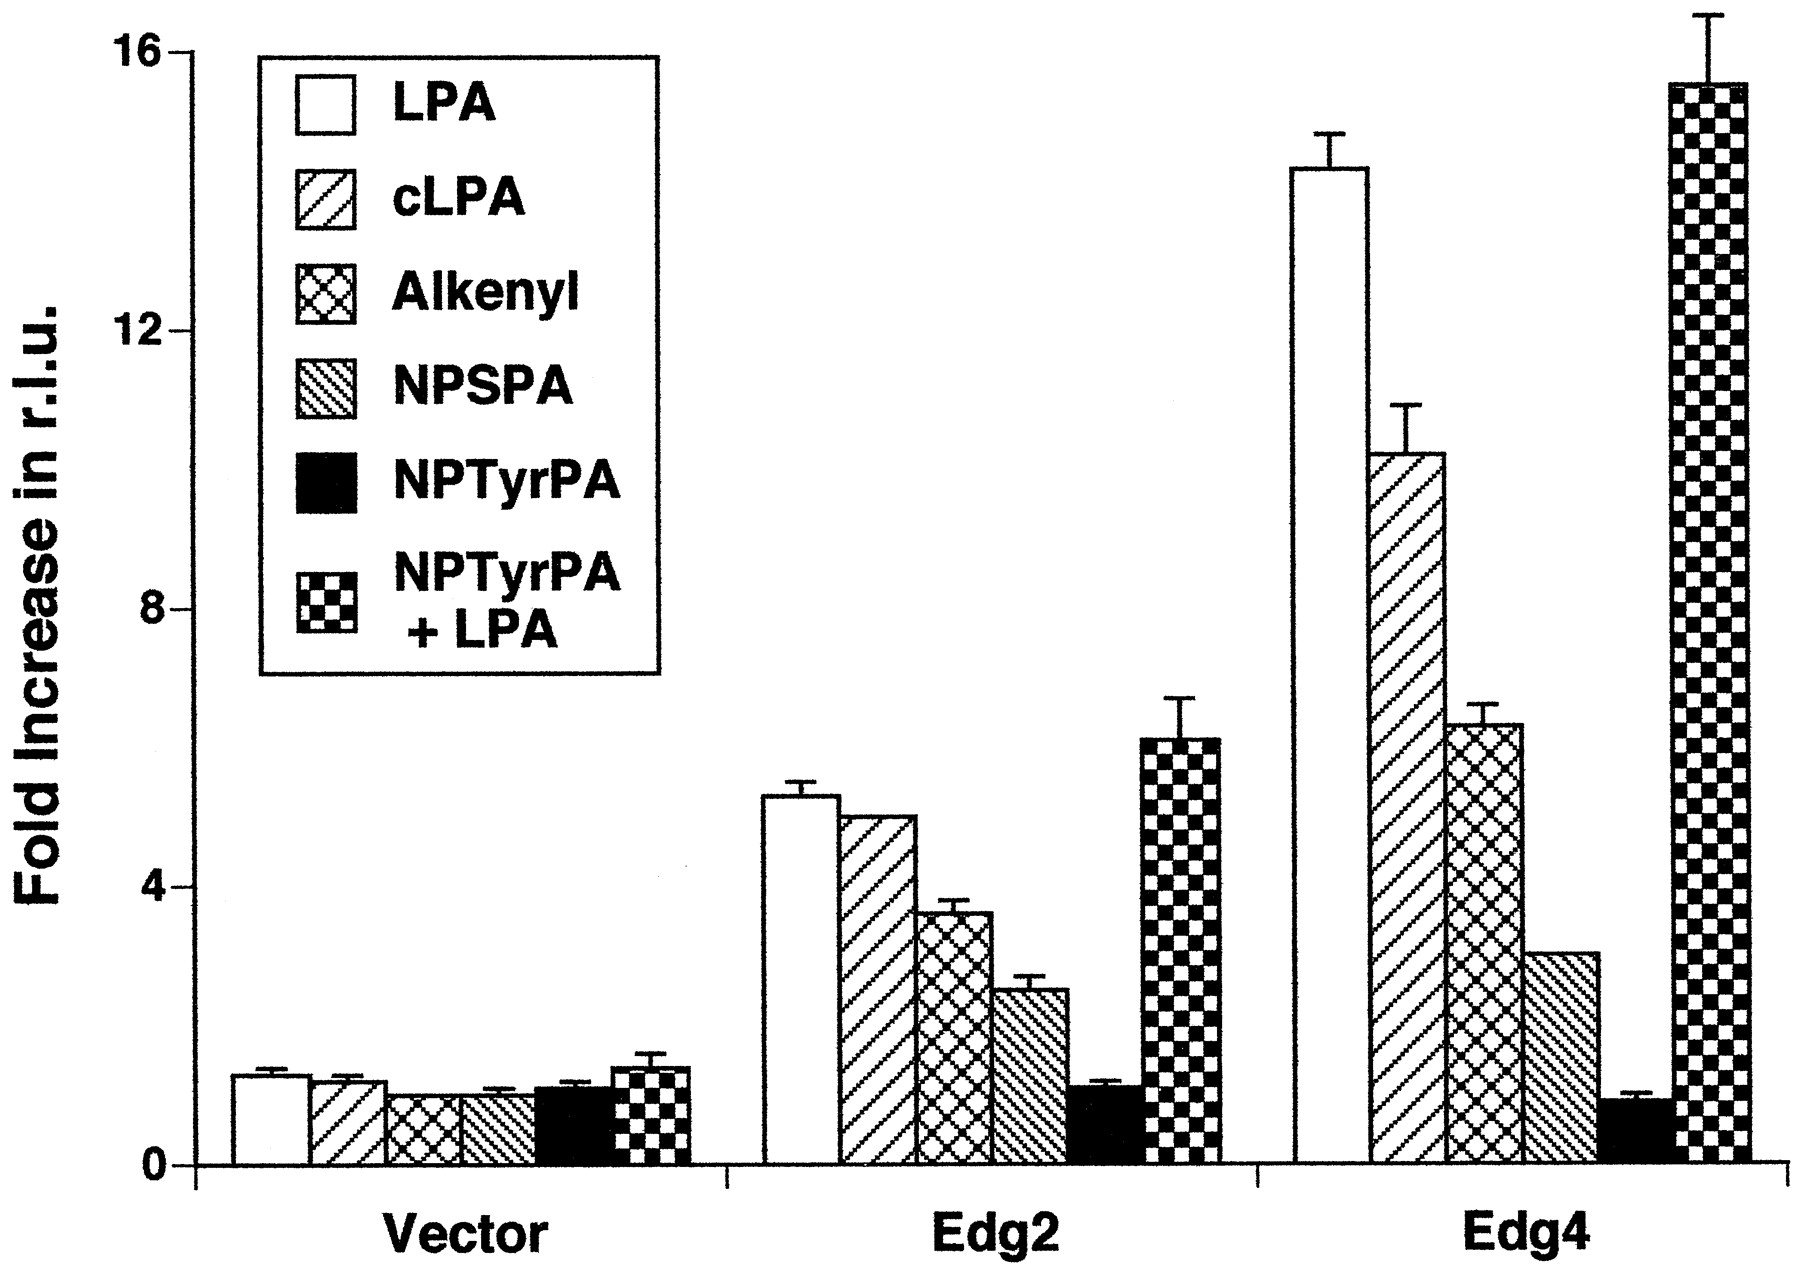
Effects of LPA and its synthetic analogs on Edg2- and Edg4-mediated increases in aequorin luminescence. Aequorin light emission of TAg-Jurkat cell transfectants with vector, Edg2, or Edg4 was recorded for 15 sec, beginning immediately after injection of the indicated ligands, with a Turner Design 20/20 luminometer. Concentrations were 100 nm for LPA and 1000 nmfor the other analogs. NPTyrPA + LPA, 1000 nm NPTyrPA added together with 100 nm LPA. Data are expressed as fold increases in relative light units (r.l.u.). Each data point depicts the mean ± standard error of triplicate determinations from one representative experiment of three. Alkenyl, alkenyl-glycerol phosphate.
To further study the characteristics and mechanisms of Ca2+ mobilization elicited by the recombinant Edg2 and Edg4 LPA receptors, we established cell lines stably expressing Edg2 and Edg4. A rat hepatoma cell line, HTC4, was selected after an extensive search for a cell line possessing the lowest level of endogenous LPA receptors detectable by Ca2+response measurements and [3H]LPA binding assays. We found that untransfected and vector-transfected HTC4 cells cultured at 75% confluency showed very small background increases in [Ca2+]i in response to LPA at <10 nm (125 ± 15% of control levels in 24 experiments). In contrast, stably transfected cell lines expressing Edg2 or Edg4 showed much larger increases in [Ca2+]i in response to LPA. When stimulated with 10 nm LPA, representative clones of Edg2 and Edg4 transfectants showed 283 and 433% increases in [Ca2+]i, respectively (Fig. 4, Table1).

Measurement of [Ca2+]iwith the fluorescence indicator fura-2 in HTC4 cells stably transfected with Edg2 (A) or Edg4 (B). HTC4 transfectants were loaded with fura-2, and fluorescence was recorded after stimulation with 10 nmLPA (arrows). Right, 3 mmEGTA was added 1 min before the addition of LPA; left, no EGTA was added. Data shown are representatives of more than six experiments, each from three different stable cell lines for each receptor.
Effects of LPA and other phospholipids on Edg2- and Edg4-mediated increases in [Ca2+]i in HTC4 stable transfectants
PA at 100 nm generated significant [Ca2+]i increases in Edg4-transfected cell lines (Table 1), consistent with the results obtained in the aequorin luminescence assay (Fig. 2B). Structurally similar phospholipids (LPG, LPC, LPE, LPS, and S1P) at 100 nm failed to generate any responses (data not shown). Consistent with the aequorin assay results (Fig. 3), cLPA, alkenyl-GP, and NPSPA were agonists for Edg2 and Edg4, because they elicited significantly greater responses than in control cells (Table 1). NPTyrPA at 100 nm did not elicit any changes by itself nor did it block responses induced by 10 nm LPA, when the compounds were added together (Table 1). Therefore, neither NPSPA nor NPTyrPA is an antagonist for Edg2 or Edg4 human LPA receptors.
A difference in the kinetic curves for Ca2+ flux with the Edg2 and Edg4 transfectants was observed (Fig. 4). This difference existed in all cell lines for each receptor examined, despite the broad range of magnitudes of [Ca2+]i increases, suggesting that it is not the result of different levels of control responses. For Edg2, the curve maintained a plateau after an initial increase that lasted for >8 min. For Edg4, maximal increases in [Ca2+]i returned to the base-line levels within 2 min after the transient rise. To determine the sources of Ca2+ mobilized by Edg2 and Edg4, changes in [Ca2+]i were measured after chelation of extracellular Ca2+. Incubation with EGTA (final concentration, 3 mm) for 1 min before LPA addition reduced the peak heights slightly. More significantly, chelation of extracellular Ca2+eliminated the persistent plateau for Edg2 (Fig. 4), suggesting that the sustained increase resulted from an influx of extracellular Ca2+.
It has been well established that Ca2+mobilization from internal stores elicited by GPCR activation is mediated through IP3 generated by PLCβ breakdown of phosphatidylinositol phosphates (Berridge, 1993; Clapham, 1995). Previously, it was shown that LPA mobilized Ca2+ through activation of phosphoinositide-specific PLC in various cultured mammalian cells (Moolenaar, 1995). To determine whether cloned Edg2 and Edg4 LPA receptors activated PLC, we measured production of radiolabeled IPs and IP3 after LPA stimulation. Treatment of Edg2 and Edg4 transfectants with 100 nm LPA for 30 min significantly increased cellular formation of total IPs (Fig.5A). Treatment of Edg2 and Edg4 transfectants with 100 nm LPA for 1 and 5 min also significantly increased IP3 production (Fig. 5B). The magnitudes of the increases in both total IPs and IP3 were greater in Edg4 than Edg2 transfectants, parallel to the magnitudes of the increases in [Ca2+]i (Table 1). The peak of the increase in IP3 was delayed, relative to that of [Ca2+]i, presumably because of accumulation of IPs in the presence of 10 mm LiCl. Pretreatment with 3 μmconcentrations of the PLC inhibitor U73122 for 2 min markedly attenuated LPA-induced increases in [Ca2+]i in both Edg2 and Edg4 transfectants (Fig. 6). U73343, an inactive compound used as a control for U73122, did not significantly change the magnitude of Ca2+ responses (Fig. 6).

Effects of LPA on [3H]IP formation in HTC4 cells stably transfected with vector, Edg2, or Edg4. HTC4 cell transfectants in six-well plates were loaded with 10 μCi ofmyo-[3H]inositol. After treatment with 100 nm LPA in the presence of 10 mm LiCl, the incubation was stopped at the indicated times with 5% trichloroacetic acid. [3H]IPs were separated on Dowex AG-1X8 columns and counted. A, Formation of total IPs in 30 min. The basal levels were 942 ± 59 cpm for vector, 1502 ± 204 cpm for Edg2, and 1742 ± 50 cpm for Edg4 (mean ± standard error, quadruplicate wells). ∗, p < 0.05; ∗∗,p < 0.01 (Student t test). B, Formation of IP3 before and 1 and 5 min after LPA addition.Data points, mean ± standard error of quadruplicate samples obtained from one representative experiment of three.

Effects of U73343, U73122, and PTX on LPA-induced Ca2+ mobilization in HTC4 cells stably transfected with Edg2 (A) or Edg4 (B). HTC4 transfectants loaded with fura-2 were stimulated with 10 nm LPA (arrows), and fluorescence was recorded. U73343 (left) and U73122 (center) were added to final concentrations of 3 μm 2 min before LPA addition. PTX treatment (right) was at 50 ng/ml for 6 hr. Data shown are representative of more than six experiments.
To assess the involvement of PTX-sensitive G proteins in LPA-induced Ca2+ mobilization by Edg2 and Edg4, transfectants were pretreated with 50 ng/ml PTX for 6 hr. This PTX pretreatment almost completely eliminated LPA-induced Ca2+mobilization in Edg2 transfectants (Fig. 6A) and greatly attenuated the responses in Edg4 transfectants (Fig. 6B). The levels of inhibition of Ca2+ responses by PTX in Edg2 and Edg4 transfectants were 84 ± 7 and 57 ± 8% (mean ± standard error, six experiments), respectively, which are significantly different (p < 0.05). This difference in PTX sensitivity between Edg2 and Edg4 was also observed for LPA-induced IP formation (Fig. 7A). PTX treatment almost completely blocked 100 nm LPA-induced total IP formation with Edg2 (91% inhibition) but only partially blocked it with Edg4 (51% inhibition). As controls, PTX treatment of the same cells only slightly suppressed [Ca2+]i increases and IP formation stimulated by 10 μm ATP (data not shown and Fig. 7A), which can mobilize intracellular Ca2+ predominantly through Gq-coupled purinergic receptors (Parr et al., 1994). The coupling of Edg2 and Edg4 to Gi protein in HTC4 transfectants was further confirmed by the observation that LPA suppressed [cAMP]i levels elevated by 10 μmforskolin and that this suppressive effect of LPA on adenylyl cyclase was eliminated by PTX treatment (Fig. 7B).

Inhibition of LPA-induced IP formation and adenylyl cyclase suppression by PTX in Edg2- and Edg4-transfected HTC4 cells. Each bar depicts the mean ± standard error of quadruplicate wells from one representative experiment of three. A, HTC4 cell stable transfectants in six-well plates were pretreated without or with 50 ng/ml PTX for 6 hr before stimulation with agonists, namely 100 nm LPA for Edg2 and Edg4 and 10 μmATP for vector-transfected cells (Vec/ATP). Total IP formation in 30 min was measured as in Fig. 5A. B, HTC4 cell transfectants treated without or with PTX were stimulated with 10 μm forskolin (FSK) or forskolin plus 100 nm LPA for 15 min. The amounts of cAMP from 3 × 10⁵ cells in each well were determined with an enzyme-linked immunoassay kit. ∗∗∗, p< 0.01; ∗∗, p < 0.05 (Studentt test), statistically significant differences for PTX-treated groups, compared with the respective forskolin/LPA-treated groups.
Discussion
Members of the Edg subfamily of GPCRs have been identified as receptors for LPA (Hecht et al., 1996; An et al., 1997b, 1998) and S1P (An et al., 1997a; Leeet al., 1998; Zondag et al., 1998). Human Edg2 and Edg4, which have similar amino acid sequences, were shown to be two subtypes of LPA receptors (An et al., 1997b, 1998). Both Edg2 and Edg4 couple to Gi to inhibit adenylyl cyclase (Hecht et al., 1996) (Fig. 7B) and to Rho to activate serum response element-driven transcription (An et al., 1997b, 1998; Fukushima et al., 1998). Edg2 has also been linked to the yeast pheromone response pathway, leading to activation of a mitogen-activated protein kinase pathway (Ericksonet al., 1998). Although LPA-induced intracellular Ca2+ mobilization has been well documented in many cell types, no report has attributed this effect to cloned Edg2 or Edg4. In fact, because it has not been possible to detect Ca2+ responses transduced by Edg2 in COS cells, Sf9 cells, and X. laevis oocytes, doubts have been raised concerning the identity of Edg2 as an LPA receptor (Moolenaar et al., 1997; Zondag et al., 1998; Hooks et al., 1998).
Many of the difficulties of characterizing cloned LPA receptors are the result of background responses in many cultured cells that obscure the activity of the expressed recombinant receptors. To overcome these difficulties, we used the aequorin luminescence method to monitor increases in [Ca2+]imediated by recombinant Edg2 and Edg4. We found that both Edg2 and Edg4, when overexpressed in Jurkat cells, were capable of mobilizing intracellular Ca2+, although Edg4 transfectants consistently showed greater increases than did Edg2 transfectants. Because we were unable to quantify the expression levels of Edg2 and Edg4 proteins in these Jurkat cell transfectants, it was not possible to compare the intrinsic activities of these two receptors.
The mechanism of Ca2+ mobilization by Edg2 and Edg4 was further characterized in stable transfectants of HTC4 cells, which exhibit minimal background responses to LPA. LPA-induced production of IP3 and inhibition of Ca2+ flux by the PLC inhibitor U73122 strongly suggested that IP3 generated by PLC is responsible for Edg2- and Edg4-mediated Ca2+mobilization (Figs. 5B and 6). Ca2+ mobilization and IP formation were almost completely blocked by PTX with Edg2 but were only partially inhibited with Edg4 (Figs. 6 and 7A). This implies that the two LPA receptors may couple differentially to G proteins to transduce PLC-mediated increases in [Ca2+]i. For Edg2, PTX-sensitive Gi protein is mainly responsible for transducing this effect, because it is well established that Gβγ subunits of PTX-sensitive Gi proteins activate PLCβ (Clapham, 1995). For Edg4, both Giβγ and Gqα may be involved. A difference in the kinetics of Ca2+ flux with Edg2 and Edg4 was also observed. With Edg2, but not with Edg4, the initial increase was followed by a sustained influx of extracellular Ca2+ (Fig. 4). However, this sustained plateau with Edg2 was not observed in the aequorin luminescence assay (Fig.1A). This difference between the two assays may be the result of cell type specificity in Edg2-mediated Ca2+ flux.
Using Edg2- and Edg4-mediated Ca2+ mobilization as functional measures, we tested the activities of several natural phospholipids and synthetic analogs of LPA. We found that the ligand specificities and rank orders of potency were similar for Edg2 and Edg4. LPA was by far the most potent natural ligand of the phospholipids tested. Surprisingly, NPSPA and NPTyrPA, which had been previously shown to be competitive antagonists at X. laevisLPA receptors (Liliom et al., 1996a), did not antagonize the responses of human Edg2 and Edg4 (Fig. 3). They were either agonists or partial agonists for Edg2 and Edg4. This observation is supported by the recent finding that NPSPA acted as an agonist in Ca2+ mobilization and adenylyl cyclase inhibition in cultured human cells (Hooks et al., 1998). The great divergence in amino acid sequences between the cloned human LPA receptors (Edg2 and Edg4) and the cloned X. laevis LPA receptor (PSP24) may be the structural basis for this difference in ligand selectivity.
When the aequorin luminescence method was used, the same ligand specificity and rank order of potency were observed as with the fura-2 fluorescence method (Fig. 2, Table 1). The aequorin luminescence method can be used for comparison of potencies and structure-activity relationships of ligands. The high sensitivity and high throughput of the aequorin method may make this a valuable assay for large-scale screenings for agonists or antagonists for specific subtypes of LPA receptors.
Acknowledgments
We are grateful to Yvonne Kong for technical assistance, Dr. G. Tigyi (University of Tennessee-Memphis) and Dr. S. Kobayashi (Science University of Tokyo) for LPA analogs, and Drs. David Saffen (University of Tokyo), Kedan Lin (University of California, San Francisco), and Jianxin Bao (University of California, San Francisco) for suggestions regarding the manuscript.
Footnotes
- Received April 29, 1998.
- Accepted July 20, 1998.
-
Send reprint requests to: Dr. Songzhu An, Division of Immunology and Allergy, Department of Medicine, Box 0711, Room UB-8, University of California, San Francisco, CA 94143-0711. E-mail:songzhu{at}itsa.ucsf.edu
-
This work was supported in part by research grants from the American Heart Association (Grant-in-Aid 96007190 to S.A.) and the National Institutes of Health (Grant HL31809 to E.J.G.).
Abbreviations
- LPA
- lysophosphatidic acid
- [Ca2+]i
- intracellular calcium concentration
- Vzg
- ventricular zone gene
- Edg
- endothelial differentiation gene
- GPCR
- G protein-coupled receptor
- NPSPA
- N-palmitoyl-l-serine-phosphoric acid
- NPTyrPA
- N-palmitoyl-l-tyrosine-phosphoric acid
- PLC
- phospholipase C
- IP3
- inositol-1,4,5-trisphosphate
- PTX
- pertussis toxin
- PA
- dioleoylphosphatidic acid
- LPC
- lysophosphatidylcholine
- LPS
- lysophosphatidylserine
- LPG
- lysophosphatidylglycerol
- LPE
- lysophosphatidylethanolamine
- S1P
- sphingosine-1-phosphate
- cLPA
- oleoyl-cyclic-2,3-phosphate-lysophosphatidic acid
- IP
- inositol phosphate
- alkenyl-GP
- alkenyl-glycerol phosphate
- EGTA
- ethylene glycol bis(β-aminoethyl ether)-N,N,N′,N′-tetraacetic acid
- HEPES
- 4-(2-hydroxyethyl)-1-piperazineethanesulfonic acid
- [cAMP]i
- intracellular cAMP concentration
- PBS
- phosphate-buffered saline
- The American Society for Pharmacology and Experimental Therapeutics


