


Abstract
Human organic anion transporter 3 (hOAT3/SLC22A8) is predominantly expressed in the proximal tubules of the kidney and plays a major role in the urinary excretion of a variety of organic anions. The promoter region of hOAT3 was characterized to elucidate the mechanism underlying the tissue-specific expression of hOAT3. The minimal promoter of hOAT3 was identified to be located approximately 300 base pairs upstream of the transcriptional start site, where there are canonical TATA and hepatocyte nuclear factor (HNF1) binding motifs, which are conserved in the rodent Oat3 genes. Transactivation assays revealed that HNF1α and HNF1β markedly increased hOAT3 promoter activity, where the transactivation potency of HNF1β was lower than that of HNF1α. Mutations in the HNF1 binding motif prevented the transactivation. Electrophoretic mobility shift assays demonstrated binding of the HNF1α/HNF1α homodimer or HNF1α/HNF1β heterodimer to the hOAT3 promoter. It was also demonstrated that the promoter activity of hOAT3 is repressed by DNA methylation. Moreover, the expression of hOAT3 was activated de novo by forced expression of HNF1α alone or both HNF1α and HNF1β together with the concomitant DNA demethylation in human embryonic kidney 293 cells that lack expression of endogenous HNF1α and HNF1β, whereas forced expression of HNF1β alone could not activate the expression of hOAT3. This suggests a synergistic action of the HNF1α/HNF1α homodimer or HNF1α/HNF1β heterodimer and DNA demethylation for the constitutive expression of hOAT3. These results indicate that the tissue-specific expression of hOAT3 might be regulated by the concerted effect of genetic (HNF1α and HNF1β) and epigenetic (DNA methylation) factors.
Tubular secretion plays a significant role in the urinary excretion of many compounds together with filtration in the glomeruli. Cumulative evidence suggests that organic anion transporter 1 (OAT1/SLC22A6) and organic anion transporter 3 (OAT3/SLC22A8) are predominantly involved in the tubular secretion of anionic drugs and drug metabolites as well as endobiotics at the basolateral membrane of the kidney proximal tubules (Van Aubel et al., 2000; Hasegawa et al., 2002, 2003; Robertson and Rankin, 2005; Sekine et al., 2006). Generation of Oat1 and Oat3 null mice confirmed an essential role for these transporters in the renal transport (Sweet et al., 2002; Eraly et al., 2006). In contrast to the functional characterization of these transporters, the regulatory mechanism of the basal expression of OAT1 and OAT3 remains to be elucidated.
In the present study, we focused on hepatocyte nuclear factor 1 (HNF1), consisting of two isoforms, HNF1α and HNF1β, as a key regulator of OAT3 expression. HNF1 is a homeodomain-containing factor that is expressed in the epithelia of a variety of organs, including liver, kidney, intestine, stomach, and pancreas (Blumenfeld et al., 1991; Mendel and Crabtree, 1991; Tronche and Yaniv, 1992). In the kidney, expression of HNF1α is confined to the proximal tubules, whereas that of HNF1β is observed along the tubular epithelial cells throughout the entire nephron (Lazzaro et al., 1992; Pontoglio et al., 1996). HNF1 is functionally composed of three domains: an N-terminal dimerization domain, a homeobox-like DNA-binding domain, and a C-terminal transactivation domain. Both the dimerization domain and the DNA-binding domain of HNF1α and HNF1β show high homologies, enabling them to form heterodimers as well as homodimers and to recognize the same DNA sequences (Mendel et al., 1991). In contrast, their transactivation domains are more divergent, and HNF1α is a more potent transactivator than HNF1β (Rey-Campos et al., 1991).
HNF1α is involved in the regulation of a number of hepatic genes, including albumin, α1-antitrypsin, and α- and β-fibrinogen (Mendel and Crabtree, 1991; Tronche and Yaniv, 1992), and also some of the transporters expressed predominantly in liver (Jung et al., 2001; Shih et al., 2001). The importance of HNF1α in kidney proximal tubules has become apparent after studies using two lines of HNF1α-null mice as well as conventional in vitro studies (Pontoglio et al., 1996; Lee et al., 1998). One line of HNF1α-null mice suffers from renal Fanconi syndrome, a defect in renal proximal tubule reabsorption, leading to glucosuria, aminoaciduria, phosphaturia, and polyuria. Indeed, HNF1α plays an essential role in the expression of sodium glucose cotransporter 2 and sodium/phosphate cotransporter 1, which are involved in the reabsorption of filtered glucose and phosphate from the urine, respectively (Pontoglio et al., 2000; Cheret et al., 2002).
In contrast to HNF1α, the role of HNF1β in adult animals remains unclear, because the homologous inactivation of the HNF1β gene results in embryonic lethality at embryonic day 7.5 as a result of a defect in visceral endoderm differentiation (Barbacci et al., 1999; Coffinier et al., 1999). However, more recently, HNF1β was shown to be essential for the formation of a functional bile duct system and several hepatic metabolic functions, by means of the conditional gene-targeting technique (Coffinier et al., 2002). HNF1β is also involved in the regulation of kidney-specific Ksp-cadherin promoter (Bai et al., 2002), and kidney-specific inactivation of HNF1β leads to a renal polycystic phenotype (Gresh et al., 2004).
Because multiple CpG dinucleotides, primary targets of DNA methylation in the vertebrate genome, are located in the putative promoter region of hOAT3 (Fig. 1), we also focused on the role of DNA methylation in regulation of hOAT3 expression. DNA methylation is one of the mechanisms underlying the epigenetic control of gene expression (Bird, 2002). Methylation of the CpG dinucleotides in the promoter region can evoke the condensed structure of chromatin in the neighboring region through the recruitment of chromatin remodeling factors, such as methyl CpG binding proteins and histone deacetylases, which prevents transactivation by most of the transcription factors. Therefore, there is an inverse correlation between gene expression and DNA methylation in the promoter region. During the last decade, the role of DNA methylation in mammalian embryogenesis, differentiation, and progression of cancer has been highlighted. More recently, DNA methylation has been recognized to regulate the tissue-specific expression of many genes (Shiota, 2004). Whether these epigenetic mechanisms are involved in the regulation of transporter genes has remained largely unknown.
In the present study, we report the isolation of the hOAT3 promoter and demonstrate the involvement of HNF1α and HNF1β in basal transcriptional activity. In addition, these studies revealed that DNA methylation is involved in the gene suppression of hOAT3, and transcriptional activation of hOAT3 by HNF1α and HNF1β requires concomitant DNA demethylation of the promoter.
Materials and Methods
Materials. All reagents were purchased from Wako Pure Chemicals (Osaka, Japan) unless stated otherwise.

Multiple alignment of the putative proximal promoter of human, mouse, and rat OAT3. Nucleotide sequences of the 5′-flanking region of human (top), mouse (middle), and rat (bottom) OAT3 genes were aligned using Genetyx-Mac version 10 (Genetyx, Tokyo, Japan), so that the maximal homology of sequences among species could be obtained. Nucleotide numberings are relative to the transcriptional start sites (nt +1, arrow). Homologous sequences among species are boxed. Representative consensus binding motifs for putative regulatory elements are shaded with the respective transcription factors given above the sequence, and CpG dinucleotides in each sequence are reverse-colored.
Isolation of the 5′-Flanking Region of the hOAT3 and mOat3 Gene. The transcriptional start site of the hOAT3 gene was identified using the public database Database of Transcriptional Start Sites (http://dbtss.hgc.jp/), with the ref sequence identification for hOAT3 (GenBank accession number NM_004254). DNA fragments of varying length from the 5′-flanking region of the hOAT3 gene were generated by polymerase chain reaction (PCR) using human genomic DNA as a template and the following primer sets: forward, -1471, -644, or -308, and reverse +6 (Table 1). The primers were designed according to the sequence of the 5′-flanking region of the hOAT3 gene, and the number indicates the position of the primers relative to the transcriptional start site. The forward primers contained an artificial KpnI site and the reverse primers contained an artificial HindIII site. The resulting PCR products (-1471/+6, -644/+6, and -308/+6) were digested with KpnI and HindIII after subcloning into pGEM-T Easy vector (Promega, Madison, WI) and ligated into pGL3-Basic vector (Promega) predigested with KpnI and HindIII, yielding the following promoter constructs: -1471/+6-Luc, -644/+6-Luc, and -308/+6-Luc. The -35/+6-Luc construct was generated by in vitro annealing of the sense (-35/+6) and antisense (+6/-35) oligonucleotides (Table 1) followed by ligation into the pGL3-Basic vector that had been predigested with KpnI and HindIII. The mOat3 promoter fragment was PCR-amplified from mouse genomic DNA using the following primers: forward (-156) and reverse (+6) (Table 1). The amplified product was ligated into the pGL3-Basic vector as in the case of hOAT3, yielding the mOat3-Luc promoter construct. The sequence identity of all the constructs with the respective genomic sequences was verified by DNA sequencing. Plasmid DNA was prepared using the GenElute Plasmid Midiprep kit (Sigma-Aldrich, St. Louis, MO).
Oligonucleotides used for the production of promoter fragments, plasmid construction, mobility shift assays, site-directed mutagenesis, RT-PCR, and quantitative PCR
Regarding the oligonucleotides used for the mobility shift assays and site-directed mutagenesis, the HNF1 recognition motif in the hOAT3 promoter region is underlined. Bold type indicates the difference in the sequence of the per and mut compared with wt sequence found in the hOAT3 promoter.
Plasmid Constructions. To generate HNF1α and HNF1β expression vectors, the coding regions of human HNF1α and HNF1β were amplified by PCR using primers containing HindIII and EcoRI restriction sites and inserted into the same sites of pcDNA3.1(+) vector (Invitrogen, Carlsbad, CA). The sequences of primers used for the amplification of HNF1α and HNF1β are listed in Table 1. The entire sequences were verified by DNA sequencing.
Site-Directed Mutagenesis. The mutated promoter fragment (-308/+6-HNF1mut) having a 4-base pair disrupted HNF1 motif was generated using the QuikChange XL site-directed mutagenesis kit (Stratagene, La Jolla, CA) using internal mutated oligonucleotides (Table 1). The introduction of the mutations was verified by DNA sequencing.
In Vitro Methylation of Plasmid DNA. Reporter constructs of the hOAT3 promoter were methylated in vitro with 3 U of SssI methylase (New England Biolabs, Beverly, MA) for each microgram of DNA in the presence of 160 μM S-adenosylmethionine at 37°C for 3 h. Completion of the methylation was confirmed by resistance to HpaII digestion (data not shown).
Cell Culture and Transfections. HepG2 and Caco-2 cell lines were maintained in a culture medium consisting of Dulbecco's modified Eagle's medium with 4500 mg/l glucose (Invitrogen) supplemented with 10% fetal bovine serum (Sigma-Aldrich), nonessential amino acids, 100 U/ml penicillin, and 100 μg/ml streptomycin (Invitrogen). The HEK293 cell line was maintained in a culture medium consisting of Dulbecco's modified Eagle's medium with 1000 mg/l glucose supplemented with 10% fetal bovine serum, 100 U/ml penicillin, and 100 μg/ml streptomycin. Cells were seeded in 24-well culture plates (0.5 × 10⁵ cells/well) 1 day before transfection. HepG2 and Caco-2 cells were transfected with 0.5 μg of the corresponding promoter construct and 0.05 μg of the internal standard pRL-SV40 vector (Promega) to normalize the transfection efficiency using Lipofectamine 2000 (Invitrogen) according to the manufacturer's instructions. HEK293 cells were transfected with 0.5 μg of the corresponding promoter and 0.05 μg of pRL-SV40 using FuGENE 6 (Roche Diagnostics, Indianapolis, IN). For cotransfection assays with HEK293 cells, 0 to 0.5 μg of HNF1α and HNF1β expression vectors or empty pcDNA3.1(+) vector was added to the transfection reaction. Then, 48 h after transfection, cells were lysed with passive lysis buffer, and the luciferase activities were assayed using the dualluciferase reporter system (Promega) and quantified in a Lumat LB 9507 luminometer (Berthold, Bad Wildbad, Germany). The promoter activity was measured as the relative light units of firefly luciferase per unit of Renilla reniformis luciferase.
Preparation of Nuclear Extracts. Nuclear extracts were prepared from 1.0 × 10⁷ of HepG2, Caco-2, and HEK293 cells. Cell centrifugation and the subsequent steps to recover the nuclear proteins were all performed at 4°C. Cells were scraped off the plates, suspended in 0.5 ml of phosphate-buffered saline, and centrifuged at 1500g for 5 min. The cellular pellet was resuspended in 150 μl of buffer A (10 mM HEPES, pH 7.9, 10 mM KCl, 0.2 mM EDTA, 0.4% Nonidet P-40, 1 mM DTT, 0.5 mM phenylmethylsulfonyl fluoride, and 1% protease inhibitor cocktail; Sigma-Aldrich). After a 10-min incubation on ice, cells were centrifuged at 4°C and 3000 rpm for 5 min. The pellet was resuspended in 150 μl of buffer A and centrifuged at 4°C and 3000 rpm for 5 min, and this process was repeated twice. The supernatant was removed, and the nuclear pellet was resuspended in 200 μl of buffer B (20 mM HEPES, pH 7.9, 400 mM NaCl, 2 mM EDTA, 1 mM DTT, 0.5 mM phenylmethylsulfonyl fluoride, and 1% protease inhibitor cocktail) and incubated on ice for 30 min. The tube was centrifuged at 4°C and 10,000 rpm for 20 min, and the supernatant was recovered as the nuclear extract. Protein concentrations were measured by the method of Lowry et al. (1951).
Electrophoretic Mobility Shift Assay. The double-stranded oligonucleotide probes were obtained by hybridizing single-stranded complementary oligonucleotides with sense sequences as shown in Table 1. Digoxigenin-11-ddUTP was incorporated into each 3′ end using a Dig Gel Shift kit, 2nd Generation (Roche Diagnostics). Sequence wt corresponds to the wild-type HNF1 sequence found in the hOAT3 promoter, and per corresponds to the perfect consensus sequence for HNF1, whereas mut denotes the wild-type sequence mutated within the HNF1 recognition motif. For EMSA, 5 μg of nuclear extracts from HepG2, Caco-2, and HEK293 cells was incubated at room temperature for 15 min with 30 fmol of digoxigenin-labeled probe, 2 μg of poly(dI-dC), and 0.1 μg of poly-l-lysine in 20 μl of 20 mM HEPES, pH 7.6, 1 mM EDTA, 10 mM (NH4)2SO4, 1 mM DTT, 2% (w/v) Tween 20, and 30 mM KCl. For competition assays, a 25-fold excess of unlabeled dimerized oligonucleotides was added. For supershift experiments, 1 μg of antibody against HNF1α or HNF1β (Santa Cruz Biotechnology, Inc., Santa Cruz, CA) was added to the reaction mixture. Reactions were analyzed by electrophoresis through Novex 6% DNA retardation gels (Invitrogen). After electrotransfer to a positively charged nylon membrane (Roche Diagnostics), bands were detected nonisotopically with a Dig Gel Shift kit, 2nd Generation, according to the manufacturer's instructions.
5-Aza-2′-deoxycytidine Treatment and Analysis of hOAT3 Expression by Reverse Transcription-PCR. Before the treatment with 5-aza-2′-deoxycytidine (5azadC) (DNA methylation inhibitor; Sigma-Aldrich), HepG2, Caco-2, and HEK293 cells were precultured for 24 h and then cultured for 72 h in medium containing 0, 1, 10, or 100 μM 5azadC. To examine the synergetic effect of the expression of HNF1α or HNF1β and DNA demethylation, HEK293 cells were plated in 24-well plates (0.5 × 10⁵ cells/well) 1 day before transient transfection of 0 to 0.5 μg of HNF1α expression vector, HNF1β expression vector, or empty pcDNA3.1(+) vector. The transfection was performed using FuGENE 6 according to the manufacturer's instructions. After 12 h, the cells were treated with 0 or 100 μM 5azadC, cultured for 48 h, and then subjected to RNA isolation. Total RNA was prepared from cells by a single-step guanidium thiocyanate procedure using ISOGEN (Nippon Gene, Toyama, Japan). The RNA was then reverse-transcribed using a randomnonamer primer (Takara, Shiga, Japan). PCR was performed with the forward and reverse primers listed in Table 1 to detect the partial fragments of hOAT3, HNF1α, HNF1β, and GAPDH cDNA. PCR was performed under the following conditions: 94°C for 2 min; 40 cycles for hOAT3, 30 cycles for HNF1α and HNF1β, and 25 cycles for GAPDH of 94°C for 30 s, 55°C for 30 s, and 72°C for 1 min; final extension 72°C for 5 min.
Quantitative PCR. To quantify the mRNA expression of HNF1α and HNF1β in HepG2, Caco-2, and HEK293 cells, real-time quantitative PCR was performed using a LightCycler and the appropriate software (version 3.53; Roche Diagnostics) according to the manufacturer's instructions. cDNA used for the quantification was prepared as described above. Primers for HNF1α and HNF1β used in this study are shown in Table 1.
PCR was performed using a SYBR Premix Ex Taq (perfect real time) (Takara). The protocol for PCR was as follows: 95°C for 30 s, 40 cycles of 95°C for 5 s, 55°C for 10 s, and 72°C for 15 s. A standard curve was generated by dilutions of the target PCR product, which had been purified and had its concentration measured. To confirm the amplification specificity, the PCR products were subjected to a melting curve analysis. The mRNA expression of HNF1α and HNF1β in each cell line was normalized by the mRNA expression of GAPDH.
Western Blotting. Nuclear extracts prepared from HepG2 or Caco-2 cells were subjected to Western blot analysis to confirm the expression of HNF1α and HNF1β at protein levels. In this, 30 μg of nuclear proteins was electrophoresed on 10% SDS-polyacrylamide gel with a 4.4% stacking gel. Separated proteins were transferred to a polyvinylidene difluoride membrane using a blotter at 15 V for 1 h. The membrane was blocked with Tris-buffered saline/0.05% Tween 20 (TBS-T) and 5% skimmed milk for 1 h at room temperature and subsequently incubated with an antibody against HNF1α or HNF1β (1:2000) at 4°C overnight. After washing three times with TBS-T for 5 min, the membrane was allowed to bind a horseradish peroxidase-labeled donkey anti-goat IgG (Chemicon International, Temecula, CA) diluted 1:5000 in TBS-T for 1 h at room temperature and detected using ECL Plus (GE Healthcare, Little Chalfont, Buckinghamshire, UK).
Results
Computational Analysis of the Potential Transcription Factor Binding Sites in hOAT3, mOat3, and rOat3 Minimal Promoters. Sequence homologies to known gene regulatory elements in the hOAT3 5′-flanking region up to approximately nt -300 relative to the transcription start site were identified by a computer-based approach using Mat Inspector (http://www.genomatix.de/) (Fig. 1). Several potential transcription factor recognition sites were found in this region, including a TATA motif at nt -32 to -27, an HNF1 binding motif at nt -65 to -53, a cAMP response element-binding protein binding motif at nt -87 to -80, and a signal transducer and activator of transcription 5 binding motif at nt -302 to -294. In addition, there are 13 CpG dinucleotides in this region, which may be potential DNA methylation sites (Fig. 1). A homologous sequence to the hOAT3 5′-flanking region in the mouse and rat Oat3 genomic locus was obtained from the National Center for Biotechnology Information genome database. The transcriptional start site of mOat3 and rOat3 gene was suggested based on the high homology (approximately 70%) to the hOAT3 5′-flanking region (Fig. 1). The TATA motif and HNF1 motif were also found in the mOat3 and rOat3 putative promoters.
Analysis of Basal hOAT3 Gene Promoter Activity. To determine the minimal region of the hOAT3 proximal promoter required for its promoter activity, a series of deleted promoter constructs (-1471/+6-Luc, -644/+6-Luc, -308/+6-Luc, and -35/+6-Luc) were transfected into three kinds of human-derived cell lines (HepG2, Caco-2, and HEK293), and the luciferase activity in each cell line was measured (Fig. 2). The transfection of -1471/+6, -644/+6, and -308/+6 constructs resulted in increased luciferase activity compared with the promoterless pGL3-Basic plasmid in all cell lines, whereas no significant luciferase activity was observed after transfection of the -35/+6 construct. These results suggest that -308 to +6 of the hOAT3 5′-flanking region can act as a minimal promoter. The luciferase activity of the -644/+6 construct was much lower than that of the -308/+6 construct only in HepG2 cells, suggesting the existence of some negative regulatory elements between -644 and -308 in this liver-derived tumor cell line.
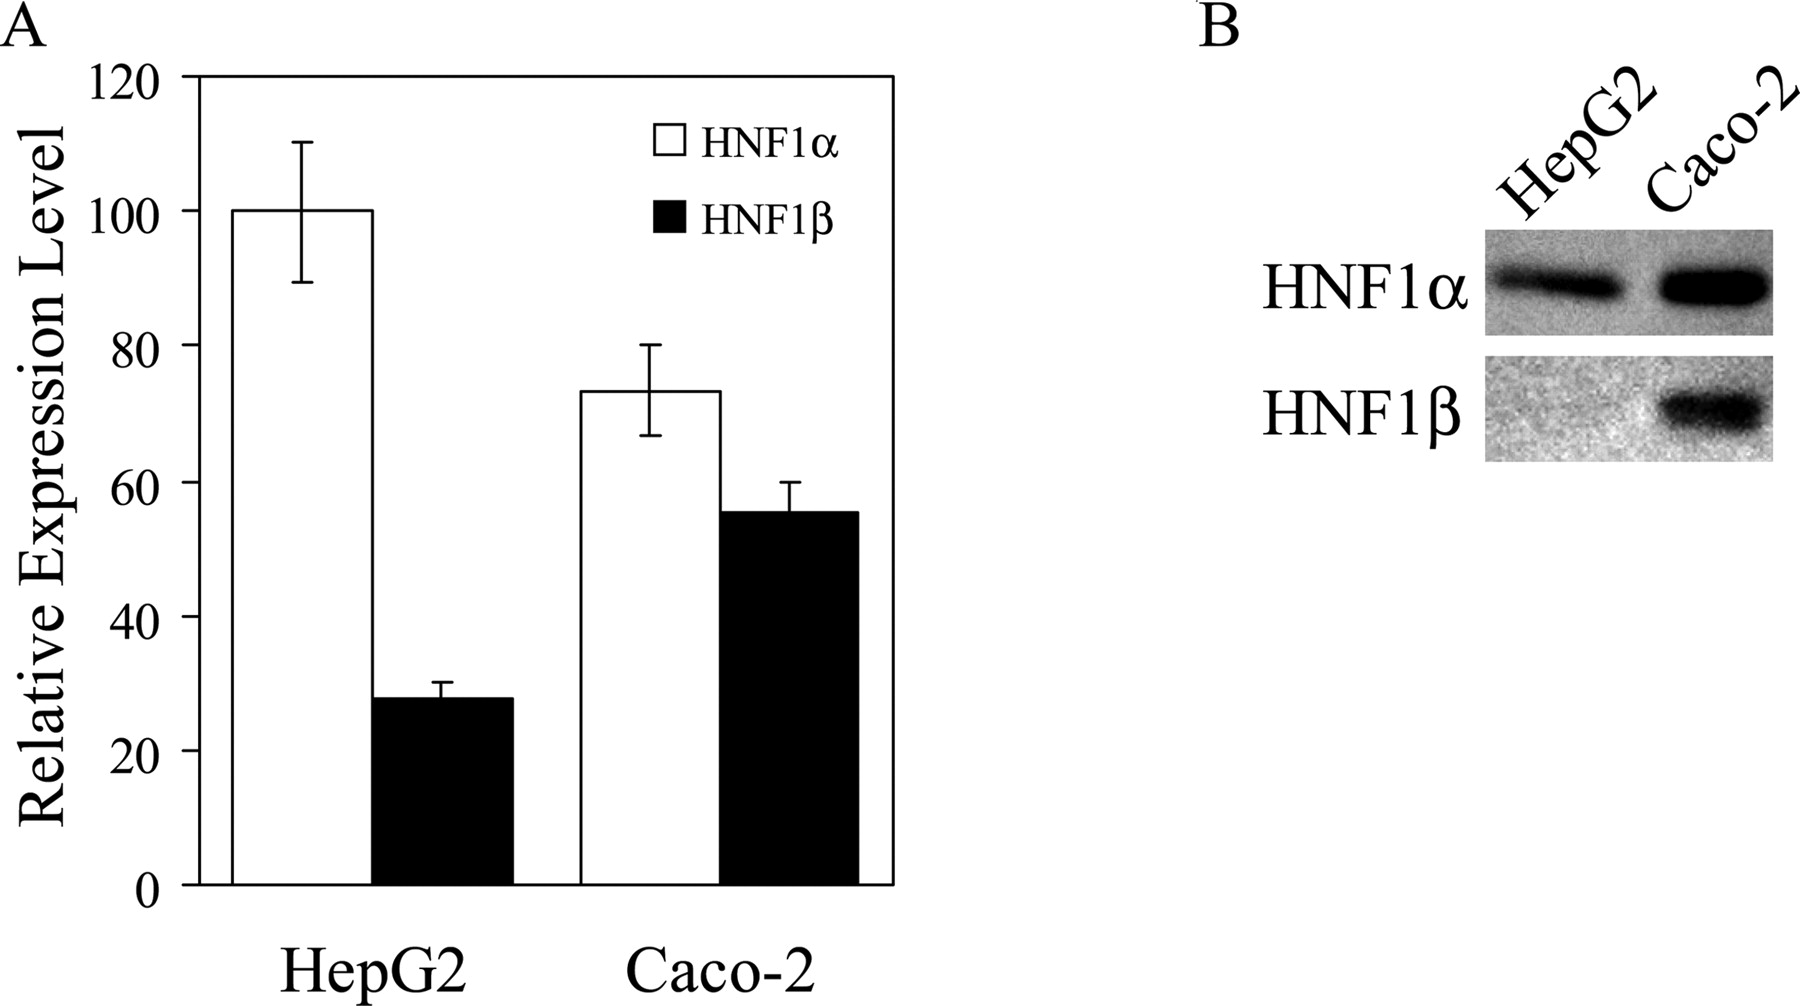
Expression Level of HNF1α and HNF1β in HepG2, Caco-2, and HEK293 Cells. Real-time quantitative PCR revealed that the expression level of HNF1β in HepG2 cells was 27% that of HNF1α (Fig. 3A). The levels of HNF1α and HNF1β mRNA in Caco-2 cells were 73 and 55% that of HNF1α in HepG2 cells, respectively. In contrast, neither HNF1α nor HNF1β was detected in HEK293 cells. Western blot analysis with nuclear extracts from HepG2 or Caco-2 cells demonstrated that in HepG2 cells, HNF1α is predominantly expressed at the protein level, whereas in Caco-2 cells, both HNF1α and HNF1β are expressed (Fig. 3B).
Mutagenesis of the HNF1 Binding Motif. To investigate the functional importance of the HNF1 binding motif in the hOAT3 promoter region for the basal promoter activity, mutations in this motif were introduced into the -308/+6-Luc construct, and the reporter activity was measured after transfection into HepG2, Caco-2, and HEK293 cells (Fig. 4). Mutations in the HNF1 binding motif attenuated the luciferase activity by approximately 50% compared with the wild-type construct in HepG2 and Caco-2 cells where endogenous HNF1α and HNF1β were detected by real-time quantitative PCR. In contrast, HNF1 motif disruption by site-directed mutagenesis had no effect on the transcriptional activity in HNF1α- and HNF1β-deficient HEK293 cells. These results confirm that the HNF1 binding motif in the hOAT3 promoter is functional.

Analysis of hOAT3 promoter function. HepG2 (white bars), Caco-2 (gray bars), and HEK293 cells (black bars) were transiently transfected with a series of deleted promoter constructs-35/+6-Luc, -308/+6-Luc, -644/+6-Luc, and -1471/+6-Luc, or a promoterless pGL3-Basic plasmid as described under Materials and Methods. Transfection efficiency was normalized by cotransfection of internal standard pRL-SV40. The promoter activity was measured as described under Materials and Methods and was shown as the factor of induction of luciferase over background activity measured in cells transfected with pGL3-Basic in each cell line. Results are presented as the mean ± S.E. of triplicate samples.

Expression of HNF1α and HNF1β in HepG2, Caco-2, and HEK293 cells. A, mRNA expression of HNF1α and HNF1β was measured by real-time quantitative PCR using specific primers (Table 1), and the data were normalized by the mRNA expression of GAPDH. The relative expression level of HNF1α (white columns) and HNF1β (black columns) in each cell line was given as a ratio with respect to the mRNA expression of HNF1α in HepG2 cells which was taken as 100%. Results are presented as the mean ± S.E. of three samples. B, Western blotting was performed to investigate the protein expression of HNF1α and HNF1β. Nuclear extracts from HepG2 or Caco-2 cells were separated by SDS-polyacrylamide gel electrophoresis (10% separating gel), and HNF1α and HNF1β were detected as described under Materials and Methods.
Transactivation of the Promoter Activity by Exogenous Expression of HNF1α and/or HNF1β. The effect of exogenously expressed HNF1α and HNF1β on the hOAT3 promoter activity was investigated by cotransfection assays in HEK293 cells. As shown in Fig. 5, independent or simultaneous transfection of HNF1α and HNF1β enhanced the luciferase activity of the hOAT3-308/+6 wild-type reporter construct (-308/+6-HNF1wt) compared with the pcDNA3.1(+)-transfected control. The luciferase activities of the promoterless pGL3-Basic or hOAT3-308/+6 HNF1-mutated reporter construct (-308/+6-HNF1mut) were not stimulated by transfection of the HNF1α and/or HNF1β expression vectors. These results provide clear evidence that both HNF1α and HNF1β can transactivate the basal promoter activity of hOAT3 and that the effect is mediated by the intact HNF1 binding motif in the hOAT3 promoter. The luciferase activity of the wild-type reporter construct with the independent transfection of HNF1α is higher than that with the independent transfection of HNF1β, indicating that the transactivation potency of HNF1β is lower than that of HNF1α. Simultaneous transfection of HNF1α and HNF1β yielded intermediate luciferase activity, which may be explained by the formation of a HNF1α/HNF1β heterodimer that enhances the promoter activity to the lesser degree than the HNF1α/HNF1α homodimer.
HNF1 Binds to the hOAT3 Promoter. EMSA was performed using the oligonucleotide probe corresponding to the -76/-41 region of the hOAT3 promoter, which includes the HNF1 binding motif and the nuclear extracts from HepG2, Caco-2, and HEK293 cells to show direct binding of HNF1α or HNF1β to the promoter (Fig. 6A). Incubation of the -76/-41 oligonucleotide probe with nuclear extracts from three cell lines resulted in three shifted bands (a, b, and c). The band a was observed when the probe was incubated with the nuclear extract from HepG2 cells (lane 2), and an additional band (band b) showing faster mobility was detected when the probe was incubated with the nuclear extracts from Caco-2 cells (lane 5). Band c was produced by incubation with the nuclear extract from each cell line (lanes 2, 5, and 8). The formation of bands a and b was abolished by an excess of unlabeled HNF1 consensus oligonucleotide (per) (lanes 3 and 6), but it was unaffected by the mutated oligonucleotide (mut) (lanes 4 and 7). These results suggest that the bands a and b can be ascribed to the binding of HNF1α or HNF1β to the -76/-41 oligonucleotide probe.

Effect of mutations in the HNF1 binding motif on the hOAT3 promoter activity. HepG2 (white bars), Caco-2 (gray bars), and HEK293 cells (black bars) were transfected with wild-type (-08/+6-HNF1wt) or mutated (-308/+6-HNF1mut) promoter construct, and the luciferase activity was measured as described under Materials and Methods. The relative luciferase activity of the mutated construct is shown as a percentage of the wild-type construct in each cell line. Results are presented as the mean ± S.E. of triplicate samples.
To confirm the specificity of HNF1 binding, supershift analysis was performed with HepG2 and Caco-2 nuclear extracts using a specific antibody to HNF1α or HNF1β (Fig. 6B). Band a was supershifted by the addition of an antibody to HNF1α but not by an antibody to HNF1β (lanes 3, 4, 6, and 7), whereas band b observed only in Caco-2 cells was supershifted by the addition of either of the antibodies (lanes 6 and 7). Thus, band a corresponds to HNF1α/HNF1α homodimer, and band b corresponds to HNF1α/HNF1β heterodimer. A previous report has shown that HNF1β/HNF1β homodimer migrating faster than HNF1α/HNF1β heterodimer may exist when both isoforms are present (Rey-Campos et al., 1991). However, in the present study, the formation of HNF1β/HNF1β homodimer was not clearly observed in Caco-2 cells where both isoforms were detected. The band c is ascribed to some nonspecific binding to the labeled probe, because this band was not abolished by the addition of unlabeled oligonucleotides. Taken together, these data suggest that the protein complex binding to the hOAT3 HNF1 motif in HepG2 cells is HNF1α/HNF1α homodimer and those in Caco-2 cells include HNF1α/HNF1β heterodimer as well as HNF1α/HNF1α homodimer. The difference in the band pattern is probably due to the different protein expression pattern of HNF1α and HNF1β in the two cell lines (Fig. 3B).
Transcriptional Activation of mOat3 Promoter by HNF1α and HNF1β. To investigate whether HNF1α or HNF1β is also involved in the promoter activity of mOat3, the proximal putative promoter of mOat3 was cloned into pGL3-Basic vector using the PCR-based approach, and the promoter activity of this reporter construct was measured in HepG2, Caco-2, and HEK293 cells. The luciferase activity of the mOat3-156/+6 promoter construct (mOat3-Luc) was 6.5- and 3.6-fold higher than the promoterless pGL3-Basic plasmid in HepG2 and Caco-2 cells, respectively, whereas the activity in HEK293 cells was not significant (Supplemental Data A). Exogenous expression of HNF1α or HNF1β in HEK293 cells enhanced the promoter activity of mOat3 (Supplemental Data B). These observations suggest that the functional importance of HNF1α and HNF1β for the basal transcription of OAT3 genes is conserved among species.

Effect of exogenously expressed HNF1α and HNF1β on hOAT3 promoter function in HEK293 cells. HEK293 cells were transfected with wild type (-308/+6-HNF1wt) or mutated (-308/+6-HNF1mut) promoter construct, or a promoterless pGL3-Basic plasmid, together with 0.5 μg/well empty pcDNA3.1(+) vector (white bars), 0.5 μg/well HNF1α expression vector (black bars), 0.25 μg/well HNF1α and HNF1β expression vectors (gray bars), or 0.5 μg/well HNF1β expression vector (light gray bars). The luciferase activity was measured as described under Materials and Methods and was shown as the factor of induction over background activity measured in cells transfected with pGL3-Basic together with pcDNA3.1(+). Results are presented as the mean ± S.E. of triplicate samples.
Repression of hOAT3 Promoter Activity by DNA Methylation. To investigate the possible role of DNA methylation on the transcriptional repression of hOAT3, hOAT3-308/+6 promoter construct was methylated in vitro; transfected into HepG2, Caco-2, and HEK293 cells; and the luciferase activity was measured. The transcriptional activity of hOAT3 was dramatically reduced by in vitro methylation of the promoter construct (Fig. 7). These data indicate that the expression of hOAT3 can be suppressed at a transcriptional level by DNA methylation.
Activation of hOAT3 Transcription by 5azadC Treatment in Nonexpressing Cell Lines. Expression of the endogenous hOAT3 gene in HepG2, Caco-2, and HEK293 cells is below the detection limit. To investigate whether the hOAT3 gene could be activated by DNA demethylation in these nonexpressing cell lines, the total RNA from each cell line treated with 5azadC, an inhibitor for DNA methyltransferases, was subjected to RT-PCR analysis. hOAT3 mRNA became detectable in Caco-2 cells after treatment with 5azadC in a concentration-dependent manner (Fig. 8A), whereas no induction of hOAT3 mRNA was observed in HepG2 or HEK293 cells (data not shown). In HEK293 cells, however, transient transfection of HNF1α alone or cotransfection of HNF1α and HNF1β followed by treatment with 100 μM 5azadC elicited de novo expression of hOAT3 mRNA, whereas transfection of HNF1β alone was not sufficient to induce hOAT3 expression (Fig. 8B). These data suggest that the repression mechanism of the hOAT3 gene in hOAT3-nonexpressing cells involves DNA methylation and that synergism between HNF1α or HNF1β expression and DNA demethylation may be required for the transcription of this gene.

Electrophoretic mobility shift assay using the oligonucleotide probe corresponding to the-76/-41 region and nuclear extracts from HepG2, Caco-2, and HEK293 cells. A, competition assays. Digoxigenin-labeled probe (Table 1) was incubated with nuclear extracts from HepG2, Caco-2, and HEK293 cells in the presence or absence of a 25-fold excess of unlabeled competitor (per or mut) as indicated. B, supershift analysis. The probe was incubated with nuclear extracts from HepG2 and Caco-2 cells in the presence or absence of a specific antibody against HNF1α (α) or HNF1β (β)as indicated. The DNA-protein complex was detected as described under Materials and Methods.

Effect of in vitro methylation on the hOAT3 promoter activity. hOAT3-308/+6 promoter construct was methylated in vitro with SssI methylase and transfected into HepG2 (white bars), Caco-2 (gray bars), and HEK293 cells (black bars). The luciferase activity was measured as described under Materials and Methods and was shown as the factor of induction over background activity measured in cells transfected with pGL3-Basic without methylation in each cell line. Results are presented as the mean ± S.E. of triplicate samples.
Discussion
In the present study, the transcriptional regulation of the hOAT3 gene was characterized for the first time. The promoter region required for basal promoter activity was determined using a series of deleted promoter-reporter constructs (Fig. 2), and the region extending from -308 to +6 relative to the transcriptional start site was found to be important for promoter activity. An almost 70% homologous sequence over 300 base pairs to the hOAT3 minimal promoter was found in the mouse and rat Oat3 genomic locus. A database search with Mat Inspector revealed that the TATA motif and HNF1 motif are conserved among species as depicted in Fig. 1, suggesting the importance of these elements in the regulation of OAT3 genes.
The contribution of HNF1α and HNF1β to the basal promoter activity of the hOAT3 gene was demonstrated by several in vitro studies. Mutations in the hOAT3 minimal promoter HNF1 motif resulted in an approximately 50% reduction in the luciferase activity compared with the wild-type construct in HepG2 and Caco-2 cells, but not in HEK293 cells (Fig. 4), which is consistent with the different expression pattern of HNF1α and HNF1β in these cell lines (Fig. 3). The residual activity of the mutated construct may be ascribed to the transactivation by other factors, the binding of which is also affected by DNA methylation, because in vitro methylation of the minimal promoter construct almost abolished its activity (Fig. 7). The amount or contribution of these unknown factors in HEK293 cells may be higher than that in Caco-2 cells, because the luciferase activity of the hOAT3 minimal promoter in HEK293 cells is similar to that in Caco-2 cells regardless of the absence of HNF1α and HNF1β. Further studies will be required to identify these factors that are also required for the transcription of hOAT3. Cotransfection of HNF1α and/or HNF1β dramatically enhanced the hOAT3 wild-type promoter-driven luciferase activity in HEK293 cells, whereas the luciferase activity driven by the mutated promoter was unaffected (Fig. 5). Binding of HNF1α or HNF1β to the HNF1 binding motif in the hOAT3 promoter was confirmed by electrophoretic mobility shift assays (Fig. 6A). Supershift analysis using specific antibodies for HNF1α and HNF1β suggested that the protein complex binding to this region is HNF1α/HNF1α homodimer or HNF1α/HNF1β heterodimer (Fig. 6B). These data indicate that HNF1α, HNF1β, or both are critical for hOAT3 gene expression, although the transactivation potency of HNF1β is lower than that of HNF1α (Fig. 5). It seems that the transcription of mOat3 is also under the control of HNF1α and HNF1β. The involvement of HNF1α and HNF1β in regulation of the OAT3 gene is conserved among species, further supporting a critical role for these transcription factors in the regulation of the hOAT3 and mOat3 genes.

Reactivation of the hOAT3 expression in hOAT3-negative cells. A, expression profile of hOAT3 mRNA in 5azadC-treated Caco-2 cells. The expression of GAPDH and hOAT3 mRNA was determined by RT-PCR in Caco-2 cells cultured for 72 h with 0, 1, 10, or 100 μM 5azadC. B, expression profile of hOAT3 mRNA in HEK293 cells transfected with HNF1α and/or HNF1β together with 5azadC treatment. The expression of GAPDH, HNF1α, HNF1β, and hOAT3 mRNA was determined by RT-PCR in HEK293 cells transiently transfected with 0.5 μg/well pcDNA3.1(+), 0.5 μg/well HNF1α, 0.25 μg/well HNF1α and HNF1β, or 0.5 μg/well HNF1β, followed by treatment with 0 or 100 μM 5azadC for 48 h. Results with the PCR templates with reverse transcription (RT +) are shown. No amplified products were detected from the templates without reverse transcription (data not shown).
hOAT3 is predominantly expressed in the kidney and only weakly in the brain and skeletal muscle (Cha et al., 2001; Alebouyeh et al., 2003). Moreover, in the kidney, the expression is restricted to the proximal tubules. Consistent with the distribution of hOAT3 in the kidney, HNF1α expression is primarily detected in the proximal tubules, whereas HNF1β is expressed throughout all segments of the nephron, from the proximal tubules to the collecting ducts (Lazzaro et al., 1992; Pontoglio et al., 1996). However, it should be noted that the tissue distribution of HNF1α and HNF1β is much wider than that of hOAT3 (Blumenfeld et al., 1991; Rey-Campos et al., 1991). In addition to the kidney, they are expressed in the liver, intestine, stomach, and pancreas where hOAT3 is not expressed. Therefore, the tissue-specific and region-restricted expression of hOAT3 cannot be accounted for only by HNF1α and/or HNF1β, and other mechanisms must be involved in the regulation of hOAT3 expression.
Because multiple CpG dinucleotides are located in the hOAT3 minimal promoter region (Fig. 1), the involvement of DNA methylation in the regulation of hOAT3 expression was investigated. The transcriptional activity of the hOAT3 minimal promoter was suppressed by in vitro methylation of the reporter construct (Fig. 7). The expression of hOAT3, normally silent in Caco-2 and HEK293 cells, was activated de novo by DNA demethylation in Caco-2 cells, and by the transient transfection of HNF1α or cotransfection of HNF1α and HNF1β together with the DNA demethylation in HEK293 cells (Fig. 8). However, the expression of hOAT3 in HEK293 cells transfected with HNF1β alone followed by DNA demethylation with 5azadC was below the detection limit, although independent transfection of HNF1β enhanced the luciferase activity of hOAT3 wild-type reporter construct (Fig. 5). This could be due to the lower transactivation potency of the HNF1β/HNF1β homodimer. On the other hand, there was no induction of hOAT3 mRNA in HepG2 cells by 5azadC treatment, regardless of the presence of endogenous HNF1α and HNF1β. The lack of inducibility of hOAT3 expression in HepG2 may be accounted for by the presence of negative regulatory factors observed predominantly in HepG2 cells in the luciferase assays (Fig. 2) and/or the absence of other transcription factors necessary for de novo expression of hOAT3. Further analysis will be required for the identification of these factors. Taken together, these observations indicate that the expression of hOAT3 is negatively regulated by DNA methylation.
There have been several reports regarding the involvement of DNA methylation in tissue-specific gene expression (Cho et al., 2001; Imamura et al., 2001; Futscher et al., 2002; Hattori et al., 2004; Jin et al., 2005). It is possible that the minimal promoter region of hOAT3 is hypermethylated in the tissues where the expression of hOAT3 is not detected, such as liver and intestine. The hypermethylation of the promoter region may render the neighboring chromatin structure inaccessible for many transcription factors, including HNF1α and HNF1β, through deacetylation of histones. Thus, regardless of the expression of HNF1α and HNF1β, the expression of hOAT3 is suppressed in those tissues.
The mechanism underlying the proximal tubule-restricted expression of hOAT3 in the kidney is more complicated. The nuclear extracts from the kidney normally contain HNF1α/HNF1β heterodimers and HNF1β/HNF1β homodimers (Pontoglio et al., 1996), and the results of the supershift experiments suggest that the protein complex binding to the HNF1 motif of hOAT3 might be the HNF1α/HNF1α homodimer or HNF1α/HNF1β heterodimer (Fig. 6B). It is likely that the promoter region of hOAT3 is hypomethylated in the kidney proximal tubules, enabling the HNF1α/HNF1β heterodimers to bind to their recognition sites. This model is supported by the results showing that the expression of hOAT3 was induced by cotransfection of HNF1α and HNF1β with the concomitant DNA demethylation in HEK293 cells (Fig. 8B). The methylation status in the other nephron segments is debatable. The promoter region may be hypermethylated in the whole nephron except for the proximal tubules, resulting in the suppression of hOAT3 expression. A second possibility is that although the promoter region is not highly methylated, interaction with the HNF1β/HNF1β homodimer is not sufficient to evoke the hOAT3 expression as observed in Fig. 8B.
Taking all these findings into consideration, it seems that the tissue specificity of the expression of hOAT3 may be explained by the coordinated action of genetic (HNF1α and HNF1β) and epigenetic (DNA methylation) mechanisms. Analysis of the Oat3 expression in HNF1α-null mice (Pontoglio et al., 1996; Lee et al., 1998) will show the relative contribution of HNF1α in vivo. In addition, direct demonstration of the difference in the DNA methylation and chromatin status in the hOAT3 promoter region among in vivo tissues/cells will be required in future studies.
The tissue distribution of mOat3 and rOat3 is not consistent with that of hOAT3: they are expressed not only in the kidney but also in the liver and the brain (Kusuhara et al., 1999; Kikuchi et al., 2003; Ohtsuki et al., 2004). It is noteworthy that the positions of the CpG dinucleotides in the hOAT3 promoter are not conserved in the corresponding region of mouse and rat Oat3 (Fig. 1). The difference in the contribution of epigenetic factors to the regulation of OAT3 gene expression may explain the species difference in the expression patterns, because the contribution of genetic factors seems to be comparable as far as HNF1α and HNF1β are concerned.
Despite the numerous studies of the genes regulated by HNF1α or HNF1β, there are few reports regarding the mechanism whereby these homeodomain proteins can bind to the promoter region of their target genes or transactivate the expression in a tissue-specific manner. Here, we have provided the first evidence suggesting that the methylation profile of the promoter or the chromatin configuration of the target genes determines the accessibility of HNF1α and HNF1β. The synergistic action of the chromatin structure in the promoter region and binding of HNF1α and HNF1β could be a critical clue to the further understanding of the tissue-specific gene regulation by these two transcription factors. Future studies are needed to investigate whether this scheme is applicable to other genes.
In conclusion, the present study provides a clear demonstration that the expression of hOAT3 is positively regulated by HNF1α and HNF1β and negatively regulated by DNA methylation. This is the first demonstration of the importance of HNF1α and HNF1β in the regulation of genes indispensable for detoxification in the kidney. Furthermore, it is also suggested that the coordinated action of genetic and epigenetic factors might explain the tissue-specific expression of hOAT3.
Footnotes
-
This work was supported by a Health and Labor Sciences research grant from the Ministry of Health, Labor and Welfare for the Research on Advanced Medical Technology.
-
ABBREVIATIONS: OAT, organic anion transporter; HNF1, hepatocyte nuclear factor 1; h, human; PCR, polymerase chain reaction; m, mouse; EMSA, electrophoretic mobility shift assay; HEK, human embryonic kidney; DTT, dithiothreitol; 5azadC, 5-aza-2′-deoxycytidine; wt, wild-type HNF1 sequence; per, perfect consensus sequence; mut, mutated consensus sequence; RT, reverse transcription; GAPDH, glyceraldehyde-3-phosphate dehydrogenase; TBS-T, Tris-buffered saline/0.05% Tween 20; nt, nucleotide(s).
-
↵
 The online version of this article (available at http://molpharm.aspetjournals.org) contains supplemental material.
 - Received April 8, 2006.
- Accepted June 20, 2006.

- The American Society for Pharmacology and Experimental Therapeutics


