


Abstract
The concepts of functional selectivity and ligand bias are becoming increasingly appreciated in modern drug discovery programs, necessitating more informed approaches to compound classification and, ultimately, therapeutic candidate selection. Using the β2-adrenergic receptor as a model, we present a proof of concept study that assessed the bias of 19 β-adrenergic ligands, including many clinically used compounds, across four pathways [cAMP production, extracellular signal-regulated kinase 1/2 (ERK1/2) activation, calcium mobilization, and receptor endocytosis] in the same cell background (human embryonic kidney 293S cells). Efficacy-based clustering placed the ligands into five distinct groups with respect to signaling signatures. In some cases, apparent functional selectivity originated from off-target effects on other endogenously expressed adrenergic receptors, highlighting the importance of thoroughly assessing selectivity of the responses before concluding receptor-specific ligand-biased signaling. Eliminating the nonselective compounds did not change the clustering of the 10 remaining compounds. Some ligands exhibited large differences in potency for the different pathways, suggesting that the nature of the receptor-effector complexes influences the relative affinity of the compounds for specific receptor conformations. Calculation of relative effectiveness (within pathway) and bias factors (between pathways) for each of the compounds, using an operational model of agonism, revealed a global signaling signature for all of the compounds relative to isoproterenol. Most compounds were biased toward ERK1/2 activation over the other pathways, consistent with the notion that many proximal effectors converge on this pathway. Overall, we demonstrate a higher level of ligand texture than previously anticipated, opening perspectives for the establishment of pluridimensional correlations between signaling profiles, drug classification, therapeutic efficacy, and safety.
Introduction
The taxonomy of therapeutic agents has a tremendous impact on preclinical approaches toward discovery and optimization of drug candidates and on decisions made by clinicians when selecting such agents. Traditionally, most drugs targeting G protein–coupled receptors (GPCRs) have been phenotypically classified as full or partial agonists, (neutral) antagonists, or inverse agonists according to their activity at a single canonical signaling pathway. For instance, in the case of the β2-adrenergic receptor (β2AR), the many available positive and inverse agonists, as well as neutral antagonists, are generally classified on the basis of their efficacy toward cAMP signaling. However, it is well known that the β2AR is pleotropically coupled to many pathways (Evans et al., 2010). Indeed, this is a common observation for most GPCRs, and there are increasing instances of ligand behavior changing with the pathway under investigation. For example, some compounds, which are classified as β2AR neutral antagonists or inverse agonists based on their efficacy toward cAMP, act as agonists toward the extracellular signal-regulated kinase 1/2 (ERK1/2) pathway (Azzi et al., 2003; Galandrin and Bouvier, 2006; Shenoy et al., 2006).
The ability of ligands to differentially influence receptor behavior in a pathway-dependent manner has been termed “functional selectivity” or “signaling bias” (Kenakin and Christopoulos, 2013) and can generally be attributed to three sources (Kenakin and Christopoulos, 2013): 1) “system bias,” the relative coupling efficiency of a pathway to the receptor; 2) “observation bias,” the experimental conditions unique to the assay used to measure activity; and 3) “agonist or ligand bias,” the ability of a ligand to engender a unique subset of receptor conformations that promotes signaling through distinct pathways to the exclusion of others. It is only the latter form of bias that is associated with the structure of the ligand and receptor and thus reflects a molecular property that can be exploited therapeutically. The phenomenon of ligand bias means that the current taxonomy for β-adrenergic receptor ligands, and probably most GPCR ligands, is likely incorrect, because the classification of any particular ligand can change depending on the pathway under investigation.
Given the increasing discovery of biased ligands in GPCR drug discovery, it is important to develop approaches that can easily quantify the phenomenon in a manner that is experimentally feasible but statistically robust such that it can objectively inform structure–activity studies and compound classification. Significant analytical advances have recently been described that extend the classic operational model of agonism (Black and Leff, 1983) to quantify ligand bias (Ehlert, 2008; Figueroa et al., 2009; Evans et al., 2011; Rajagopal et al., 2011; Kenakin et al., 2012; Kenakin and Christopoulos, 2013). An important outcome of such analyses is the potential to yield “fingerprints” of compound profiles in a manner that can enrich standard structure–activity and structure–function studies. Ultimately, such detailed fingerprints may be implemented into drug discovery workflows and eventually result in entirely different drug taxonomies that can allow physicians to make better choices in their treatment regimen, with fewer adverse effects in the future.
Because the β2AR is a GPCR with a rich pharmacology and substantial clinical data, it is an ideal candidate for a proof of concept study aimed at developing a chemical biology framework based on ligand bias determinations for clustering compounds in a manner that may predict in vivo efficacy. As such, we investigated 19 clinically relevant compounds that are used for treating diseases such as asthma, chronic obstructive pulmonary disease, cardiovascular disease, migraine, and glaucoma and determined their signaling efficacy toward four functional outcomes, namely, the cAMP, ERK1/2, and calcium signaling pathways, as well as β2AR endocytosis. Importantly, both formal clinical studies and anecdotal observations suggest that some of these compounds may be more efficacious and/or safer than others for certain clinical indications, despite having the same relative efficacy toward the cAMP pathway (Castle et al., 1993; Cruickshank, 1993; Eichhorn and Young, 2001; Javed and Deedwania, 2009; Ram, 2010). Although these differences may be attributed to other properties of the drugs (polypharmacology, pharmacokinetics, etc.) it is possible that functional selectivity toward different signaling pathways may contribute to their different therapeutic profiles. In-depth characterization of the four chosen signaling profiles led to the identification of five subgroups of ligands with distinct signaling signatures. This represents a first step for establishing more informative links between the in vitro cell-based data, whole animal studies, and clinical data that may lead to the design of next generation β-adrenergic ligands displaying greater selectivity and reduced side effects profiles.
Materials and Methods
Adrenergic Ligands.
(−)-Isoproterenol hydrochloride (ISO), (−)-norepinephrine (NE), (−)-epinephrine (EPI), salmeterol xinafoate (SALM), labetalol hydrochloride (LAB), alprenolol hydrochloride (ALP), pindolol (PIN), carvedilol (CARV), bisoprolol hemifumarate (BIS), (±)-metoprolol (+)-tartrate salt, timolol maleate salt (TIM), betaxolol hydrochloride (BET), nadolol (NAD), S(−)-atenolol (ATEN), nebivolol hydrochloride, dl-propranolol hydrochloride (PRO), UK 14,304 [5-bromo-N-(2-imidazolin-2-yl)-6-quinoxalinamine, 5-bromo-N-(4,5-dihydro-1H-imidazol-2-yl)-6-quinoxalinamine], phenylephrine (PE), and CGP-20712A ((±)-2-hydroxy-5-[2-[[2-hydroxy-3-[4-[1-methyl-4-(trifluoromethyl)-1H-imidazol-2-yl]phenoxy]propyl]amino]ethoxy]-benzamide methanesulfonate salt) were purchased from Sigma-Aldrich (St. Louis, MO). ICI 118,551 [(±)-erythro-(S*,S*)-1-[2,3-(dihydro-\x{200b}7-methyl-1H-inden-4-yl)oxy]-3-[(1-methylethyl)amin\x{200b}o]-2-butanol hydrochloride], salbutamol hemisulfate (SALB), and xamoterol hemifumarate (XAM) were from Tocris Bioscience (Ellisville, MO). Bucindolol (BUC) was a gift from Dr. Michael Bristow (University of Colorado Health Sciences Center, Denver, CO).
Biosensor Constructs.
GFP10-mutEPAC1(δDEP; T781A; F782A)-venus (henceforth referred to as exchange protein directly activated by cAMP [EPAC] biosensor) was cloned between the NheI and EcoRI sites of pcDNA3.1/zeo(+). The EPAC biosensor consists of an amino-terminal-Green Fluorescent Protein10 (GFP10) joined by a 5 amino acid residue (GSAGT) linker to a mutated EPAC1(δDEP; T781A; F782A) biosensor (Ponsioen et al., 2004) and a carboxy-terminal-venus fluorescent protein (venus) joined by a 5 amino acid residue linker (KLPAT). This biosensor contains 2 mutations (T781A; F782A), rendering the biosensor inactive with respect to its guanine nucleotide exchange factor activity toward Rap1 but maintaining its activation by cAMP (Ponsioen et al., 2004). Deletion of the DEP domain creates a cytosolic EPAC biosensor that binds cAMP with micromolar affinity (binding Kd = 14 ± 2 μM; Ponsioen et al., 2004). mCherry-obelin was cloned between the NheI and XbaI sites of pcDNA3.1/zeo(+). The obelin biosensor consists of an amino-terminal-mCherry joined by 5 amino acid residue linker (GSAGT) to the obelin calcium-activated photoprotein (Illarionov et al., 2000). The obelin biosensor is a bioluminescent photoprotein derived from Obelia longissima that tightly binds the chromophore (coelenterazine) with oxygen to form a stable complex, which is activated upon binding 3 calcium ions (linear range of sensitivity: 100 nM–100 μM; Illarionov et al., 2000).
Cell Culture and Transfections.
Human embryonic kidney (HEK) 293S cells stably expressing human β2AR (Galandrin and Bouvier, 2006) [HEK-hemagglutinin (HA)-β2AR] were confirmed to express 3.17 ± 0.32 pmol/mg protein β2AR (whole cell binding with [3H]CGP-12177 (4-[3-[(1,1-dimethylethyl)amino]2-hy\x{200b}droxypropoxy]-1,3-dihydro-2H-benzimidazol-2-one). Cells expressing high levels of human β2AR were selected for this study to enhance the signals observed for weak partial agonists and inverse agonists. Cells were transiently cotransfected with EPAC biosensor (1500 ng/1 × 106 cells) and mCherry-obelin (1500 ng/1 × 106 cells) using linear polyethylenimine (1 mg/ml) (Polysciences, Warrington, PA) diluted in NaCl (150 mM, pH 7.0) (PEI:DNA ratio 3:1) as described (Reed et al., 2006). Cells were used 48 hours post-transfection for EPAC and obelin measurements.
Phospho-ERK1/2 Measurements.
Intracellular phospho-ERK1/2 was measured using the Surefire pERK kit (PerkinElmer, Waltham, MA) using a modified protocol. HEK-HA-β2AR were plated into 96 well plates (50,000 cells/well) and grown for 32 hours. Cells were serum starved [Dulbecco's modified Eagle's medium (DMEM); 0.5% fetal bovine serum (FBS)] for 18 hours prior to ligand stimulation. Increasing concentration of compounds, diluted in DMEM, were added at 37°C for the indicated times to generate full concentration-response curves. Kinetic assays were initially performed using a maximal concentration of ligands to determine the optimal stimulation time for measuring concentration-response curves (2 or 4 minutes). Plates were placed on ice, medium aspirated, and lysis buffer (proprietary mix included in the kit, 10 μl/well) added. Plates were frozen at −20°C for 18 hours to ensure complete cell lysis. Lysates were thawed, and a sample from each well (4 μl) was transferred to a white 384-well ProxiPlate (PerkinElmer). Activation buffer (1 μl/well), reaction buffer (4 μl/well), and AlphaScreen Protein A IgG beads (1:120 dilution) (PerkinElmer) were mixed and then added to the lysates (5 μl/well) in the dark. The lysates were incubated at 25°C for 18 hours and then the plates were read using the Fusion-αFP with excitation at 680 nm (α-laser) and emission at 520–620 nm.
EPAC Biosensor Measurements.
HEK-HA-β2AR were cotransfected with the EPAC and mCherry-obelin biosensors (as described above) then replated into 96-well white CulturPlates (PerkinElmer) (50,000 cells/well). Cells were serum starved (DMEM, 0.5% FBS) for 18 hours prior to stimulation. Wells were washed 1× phosphate-buffered saline, 1× stimulation buffer [Hanks' balanced salt solution (HBSS): 137 mM NaCl, 5.4 mM KCl, 0.25 mM Na2HPO4, 0.44 mM KH2PO4, 1.8 mM CaCl2, 0.8 mM MgSO4, 4.2 mM NaHCO3, 0.2% (w/v) d-glucose, pH 7.4]. Under basal conditions, the GFP10 and venus fluorescent proteins (FPs) are within close proximity, such that upon excitation of the GFP10 with a laser at 400 nm, fluorescence resonance energy transfer (FRET) occurs between GFP10 and venus. The light emitted from both FPs is measured using emission filters set at 510 nm (GFP10) and 533 nm (venus) and the FRET ratio (venus emission over GFP10 emission) determined. Upon activation of the EPAC biosensor, a conformational change within the biosensor causes GFP10 and venus to move away from each other, decreasing the FRET between these proteins. Thus, increases in intracellular cAMP levels are observed as a decrease in the FRET ratio, whereas decreases in the intracellular cAMP levels results in an increase in the FRET ratio. Increasing concentrations of compounds, diluted in HBSS, were added to the wells at 37°C for the indicated times to generate full concentration-response curves. Kinetic assays were initially performed using a maximal concentration of ligands to determine the optimal stimulation time for measuring concentration-response curves (30 minutes) at 37°C.
Obelin Biosensor Measurements.
HEK-HA-β2AR cotransfected with the EPAC biosensor and mCherry-obelin were replated, starved, and washed as described for the EPAC measurements above. Cells were preincubated with the obelin substrate, coelenterazine cp (1 μM; 25°C), for 2 hours in the dark. Under basal conditions, a low level of calcium-independent luminescence is observed (Illarionov et al., 2000). Upon calcium binding, the photoprotein oxidizes coelenterazine cp, converting it to coelenteramide, releasing carbon dioxide and light in the blue range (465–495 nm) (Illarionov et al., 2000). Therefore, with an increase in intracellular calcium levels, an increase in luminescence is observed. Compounds, diluted in stimulation buffer were injected into the wells, and luminescence was measured using the SpectraMax L (Molecular Devices, Sunnyvale, CA). Full kinetics were determined for each concentration of ligand (60 seconds), and concentration-response curves were determined from the peak calcium responses.
Receptor Endocytosis Enzyme-Linked Immunosorbent Assay.
HEK-HA-β2AR (50,000 cells/well) were plated into white CulturPlates (PerkinElmer) and grown for 32 hours, then serum starved (DMEM, 0.5% FBS) for 18 hours prior to endocytosis assay. Wells were washed 1× phosphate-buffered saline, 1× stimulation buffer (SB) [HBSS: 137 mM NaCl, 5.4 mM KCl, 0.25 mM Na2HPO4, 0.44 mM KH2PO4, 1.8 mM CaCl2, 0.8 mM MgSO4, 4.2 mM NaHCO3, 0.2% (w/v) d-glucose, 0.5% (w/v) bovine serum albumin, pH 7.4). Increasing concentration of compounds, diluted in SB, were added at 37°C for the indicated times to generate full concentration-response curves. Kinetic assays were initially performed using a maximal concentration of ligands to determine the optimal stimulation time for measuring concentration-response curves (30 minutes). Plates were placed on ice, stimulation buffer aspirated, and cells fixed with paraformaldehyde (3% w/v) for 10 minutes at 23°C. Cells were washed (3× 10 minutes, SB) before the addition of anti–HA-HRP (3F10; 1:3000) (Roche, Indianapolis, IN) (18 hours, 4°C). Following, cells were washed (3× 10 minutes, SB), Vybrant dye (Invitrogen, Carlsbad, CA; 1:2000) was added (30 minutes, 25°C), and cells were washed again (3× 10 minutes, SB). Vybrant fluorescence was measured with excitation at 480 nm and emission at 538 nm auto cutoff 530 nm using the FlexStationII (Molecular Devices) to control for the number of cells/well. Western lightning-plus ECL (PerkinElmer) was added to the wells (50 μl/well) and incubated for 1 minute in the dark, and then chemiluminescence was measured for 1 second/well in the SpectraMaxL (Molecular Devices)
Preparation of Ligands.
All ligands were prepared from powder immediately prior to each experiment in vehicle and used immediately. All compounds were diluted from stock solutions (10 mM) into stimulation buffer (HBSS) (cAMP, calcium and enzyme-linked immunosorbent assay), or DMEM (ERK1/2 assays). Since ISO is susceptible to oxidation, ascorbate is often used to prevent oxidation. However, we elected not to systematically use ascorbate in our experiments because we found that low concentrations of ascorbate (34 nM) directly activated ERK1/2 signaling in HEK-HA-β2AR cells in a rapid and transient manner (Supplemental Fig. 1). This would have a significant impact on the quantification of signaling biases of the adrenergic ligands at the β2AR. To confirm that the oxidation of ISO in the experiments had no significant effect on the cAMP assay (the assay with the longest duration; 30 minutes), the kinetics and concentration-response curves to ISO were compared in stimulation buffer with or without ascorbate (0.1 mM) (Supplemental Fig. 2). Because no significant effect was observed on the ISO-stimulated cAMP responses with or without ascorbate, we concluded that there would be no impact on the bias calculations if ascorbate was excluded from the stimulation buffer.
Data Analysis.
For each assay, data were normalized as percentage of the maximal isoproterenol-stimulated response. All values are expressed as the mean ± S.E.M. of n experiments. The operational model (Black and Leff, 1983) was used to determine the transduction ratios (τ/KA) of the agonists using eq. 5, derived from the standard form of the operational model by eq. 1: (1)Where the "Basal" parameter was added for fitting nonzero basal responses. Dividing through by KA yields the τ/KA ratio by eq. 2:
 (2)
(2)The τ/KA was redefined as the single fitted parameter, R, such that (3)The equation was then simplified by dividing above and below by Rn[A]n
 (4)
(4)For curve-fitting purposes, the parameters KA and R were recast as logarithms (i.e., 10logKA, 10logR), yielding the final equation used for direct curve fitting: (5)where E is the effect of the ligand, [A] is the concentration of agonist, Em is the maximal possible response of the system, Basal is the basal level of response in the absence of agonist, logKA denotes the logarithm of the functional equilibrium dissociation constant of the agonist, n is the slope of the transducer function that links occupancy to response, and logR is the logarithm of the “transduction coefficient” (or “transduction ratio”), τ/KA, where τ is an index of the coupling efficiency (or efficacy) of the agonist. For more details, see Evans et al. (2011), Kenakin et al., (2012), and Kenakin and Christopoulos (2013). For the analysis, all families of agonist curves at each pathway were globally fitted to the model with the parameters, Basal, Em, and n shared between all agonists. For full agonists, the logKA was constrained to a value of zero, whereas for partial agonists this was directly estimated by the curve fitting procedure. The logR [i.e., log(τ/KA)] parameter was estimated as a unique measure of activity for each agonist.
The relationship between the Black–Leff model and the parameters that describe the standard empirical logistic equation (i.e., EC50 and Emax) has been described previously (Black et al., 1985; Kenakin et al., 2012). In brief, (6)and
 (7)
(7)All data were analyzed using the nonlinear curve fitting equations in GraphPad Prism (v6.0; GraphPad Software, La Jolla, CA) to estimate the pEC50 values of the curves for the different pathways. Ligand bias was quantified by analyzing the concentration-response curves using the operational model of agonism, as described previously (Evans et al., 2010; Kenakin et al., 2012), according to eq. 5 (see Supplemental Appendix 1 for GraphPad Prism equations and fitting parameters).
The assessment of true ligand bias requires the elimination of the influence of system and observation bias to the observed functional selectivity (Kenakin and Christopoulos, 2013). This is achieved by comparing ligand activity at a given signaling pathway to that of a reference compound. In our study, ISO was selected as the reference compound because it did not activate any of the four pathways through other adrenergic receptors and had similar potencies toward all four signaling pathways. Thus, to determine the relative effectiveness of the compounds to activate the different signaling pathways, the difference between the log(τ/KA) values was calculated using eq. 8: (8)The compounds’ effectiveness toward each pathway, relative to ISO, were calculated as the inverse logarithm of the Δlog(τ/KA) using eq. 9:
 (9)Ligand bias was calculated using eqs. 10 and 11 as the difference between the Δlog(τ/KA) values derived from eq. 8:
 (10)
(10) (11)where L1 is ligand 1, P1 is pathway 1, L2 is ligand 2, and P2 is pathway 2.
The S.E.M. was calculated for the transduction ratios log(τ/KA) using eq. 12: (12)where σ is the standard deviation, and n is the number of experiments. To avoid propagation of the error through the multiple subtraction steps, the estimated standard errors for each ligand and each pathway were calculated using eqs. 13 and 14:
 (13)
(13) (14)where L1 is ligand 1, L2 is ligand 2, P1 is pathway 1, and P2 is pathway 2. A detailed set of instructions on how to calculate biases with examples taken from this study are included as Supplemental Appendix 1.
Statistical analysis was performed using a two-way unpaired Student’s t test on the Δlog(τ/KA) ratios to make pairwise comparisons between two pathways activated by a given ligand, where P < 0.05 was considered to be statistically significant.
Results
Different Potency and Efficacy Profiles Were Observed for Adrenergic Ligands toward Four Distinct Signaling Outputs.
Initially, 17 β-adrenergic ligands currently used in various clinical indications (Castle et al., 1993; Cruickshank, 1993; Eichhorn and Young, 2001; Javed and Deedwania, 2009; Ram, 2010) and 2 endogenous ligands were selected to assess their functional selectivity toward 4 signaling pathways: cAMP production, calcium mobilization, ERK1/2 activation, and receptor endocytosis (Tables 1 and 2). For reference purposes, the compounds, structures, binding affinities (from published radioligand binding studies), relative efficacies (previously reported for cAMP production), receptor subtype selectivity profile, and clinical uses are provided for each compound (Table 1). The first step to quantify the ligand biases at the β2AR was to carefully select the test ligands and determine full concentration-response curves for the different pathways for all ligands. Second, signaling efficacy was analyzed using the operational model curve-fitting parameters, and finally ligand biases were calculated (see Materials and Methods and Supplemental Appendix 1). The maximal response (Emax) and the potency (pEC50) for each compound demonstrate that each has a unique signaling signature (Table 2).
Clinically relevant compounds selected for the study
The 19 adrenergic compounds initially selected for this study are listed in alphabetical order. Their binding affinities (pKD) toward the β2AR were determined using [125I]cyanopindolol, [125I]pindolol or [3H]CGP-12177 in cell lines overexpressing the β2AR or in tissues endogenously expressing the β2AR. The potencies (pEC50) of these compounds toward cAMP signaling, is also shown. The compound structures, their selectivity for the different adrenergic receptor subtypes and their clinical uses are also indicated.
Potencies, relative efficacies (Emax) and kinetics of activation of cAMP, ERK1/2, calcium signaling pathways, and receptor endocytosis by adrenergic ligands
HEK-HA-β2AR cells were stimulated with different concentrations of clinically relevant adrenergic ligands and responses were measured for 4 distinct signaling pathways (cAMP, 30 minutes; ERK1/2, 2 or 4 minutes; calcium 0–60 seconds and endocytosis 30 minutes). The negative pEC50 values reported for some ligands mean that the curve was biphasic, and these are the pEC50 values for the part of the curve following the Emax. Data are the mean ± S.E.M. of 4–6 independent experiments with repeats in duplicate.
Some Adrenergic Ligands Activate Signaling Pathways through Multiple Adrenoceptor Subtypes.
Several compounds included in this study were reported to act at other adrenergic receptor subtypes (Table 1). To eliminate possible confounding effects resulting from activation of other endogenously expressed adrenergic receptors, a single concentration of each agonist (pEC50–pEC80 toward a particular signaling output) was tested in cells pretreated (60 minutes) with adrenergic antagonists at concentrations that fully occupy the targeted receptors with marginal occupancy (less than 11% of β2AR occupancy for all ligands) of the other receptor subtypes [β1AR: CGP-20712A (100 nM, 11% occupancy at β2AR), β2AR: ICI 118,551 (100 nM, 100% occupancy at β2AR), α1AR: prazosin (10 nM, >0.01% occupancy at β2AR), α2AR: rauwolscine (100 nM, 0.2% occupancy at β2AR)] (Fig. 1). These compounds were selected for their lack of intrinsic efficacies on the pathways tested except for ICI 118,551, which was an inverse agonist toward cAMP (Supplemental Fig. 3; Table 2).

Selective adrenoceptor antagonists differentially block the EC50-80 of clinically relevant ligands toward the four signaling outcomes. Cells were pretreated (1 hour, 37°C) with selective adrenoceptor antagonists, CGP-20712A (β1AR; 100 nM), ICI 118,551 (β2AR; 100 nM), prazosin (α1AR; 10 nM), or rauwolscine (α2AR; 100 nM) and then treated with ISO (100 nM cAMP; 10 nM ERK1/2, 1 µM calcium, 10 µM endocytosis), EPI (3 µM cAMP; 10 µM ERK1/2, 10 µM calcium; 10 µM endocytosis), NE (3 µM cAMP; 3 µM ERK1/2; 10 µM calcium, 10 µM endocytosis), SALB (1 nM cAMP; 0.1 nM ERK1/2, 10 µM calcium, 10 µM endocytosis), SALM (100 nM cAMP; 3 nM ERK1/2; 10 µM calcium), LAB (3 nM cAMP; 1 nM ERK1/2), ALP (1 nM cAMP; 3 nM ERK1/2), BUC (30 nM cAMP; 10 nM ERK1/2), PIN (10 µM cAMP; 10 nM ERK1/2), XAM (1 µM ERK1/2), CARV (30 nM ERK1/2), PRO (100 nM ERK1/2), nebivolol (NEB; 1 µM cAMP), ATEN (10 µM cAMP), TIM (1 µM cAMP), BET (10 µM cAMP), metoprolol (MET; 10 µM cAMP), BIS (10 µM cAMP), NAD (10 µM cAMP) (37°C). Responses were measured toward cAMP (30 minutes), ERK1/2 (2–4 minutes), calcium (0–60 seconds), and receptor endocytosis (30 minutes) after stimulation with test compounds. Data are the mean ± S.E.M. of 4–6 independent experiments with repeats in duplicate. The data were analyzed by one-way analysis of variance with a Dunnett post hoc test (comparing to the effect of the compound alone): aP < 0.05 for cAMP; bP < 0.05 for ERK1/2; cP < 0.05 for calcium; dP < 0.05 for receptor endocytosis.
The responses for seven of the compounds (EPI, NE, ALP, PRO, ATEN, TIM, BET) were partially inhibited by a non-β2AR antagonist, suggesting that some of their activity originates from binding to a different adrenergic receptor subtype (Fig. 1). Although activation of the cAMP, calcium, and endocytotic pathways by the agonist compounds were all β2AR specific, (defined by sensitivity to antagonism by ICI 118,151 but not CGP-20712A, prazosin, or rauwolscine), the ERK1/2 activation promoted by some of the compounds (EPI, NE, ALP, and PRO) involved the α2AR (NE and EPI), α1AR (PRO), or both (ALP). To determine whether the endogenously expressed α1AR and α2AR could activate ERK1/2 signaling in the HEK-HA-β2AR cells, the effects of the α1AR agonist PE and the α2AR agonist, UK 14,304 were tested (Supplemental Fig. 4). ERK1/2 was activated by PE and UK 14,304 in the HEK-HA-β2AR cells, demonstrating that the endogenously expressed α1AR and α2AR were coupled to ERK1/2 signaling and could contribute to the overall ERK1/2 responses observed in the HEK-HA-β2AR cells. Although activation of multiple receptors contributes to the signaling textures of these ligands, the contribution of additional receptors to the response profile greatly complicates the interpretation of potential ligand-biased signaling through the β2AR (system bias). These ligands were excluded from further experiments and analysis to eliminate the “system bias” from the calculations of the true “ligand bias” at the β2AR. Several compounds (ATEN, TIM, nebivolol, and metoprolol) yielded weak (low efficacy or potency) inhibition of cAMP production, resulting in variability of the signal that made it difficult to clearly establish whether the responses were β2AR specific. These inverse agonists, as well as BET (antagonized by prazosin), were also excluded from further analysis (Fig. 1). Taken together, these data emphasize the importance of assessing the pharmacological target-based selectivity of the response studied before concluding that the different response profiles result from ligand-biased signaling through a common receptor.
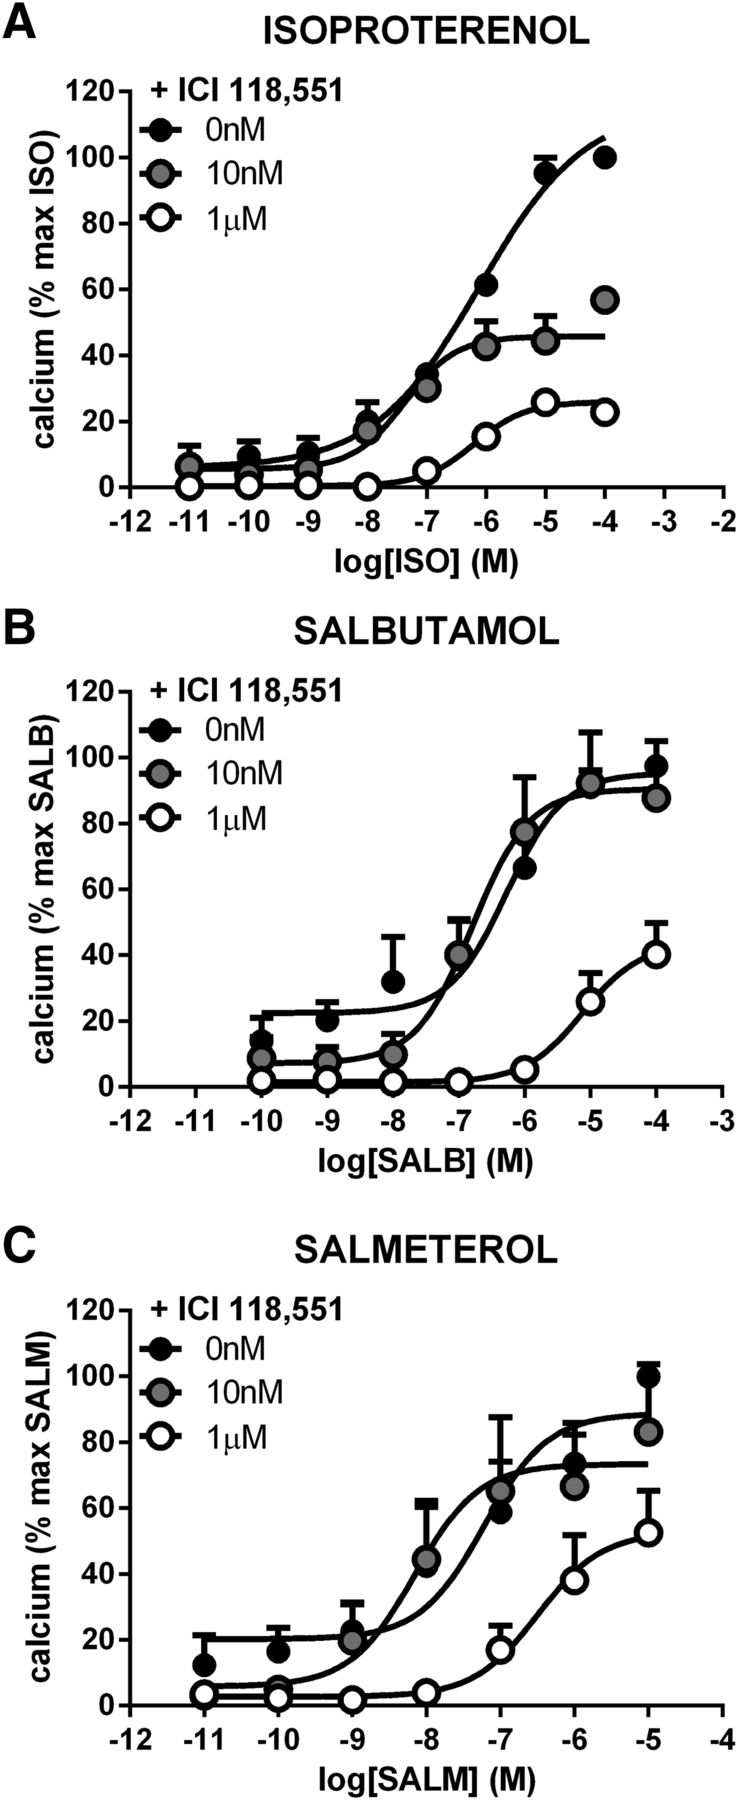
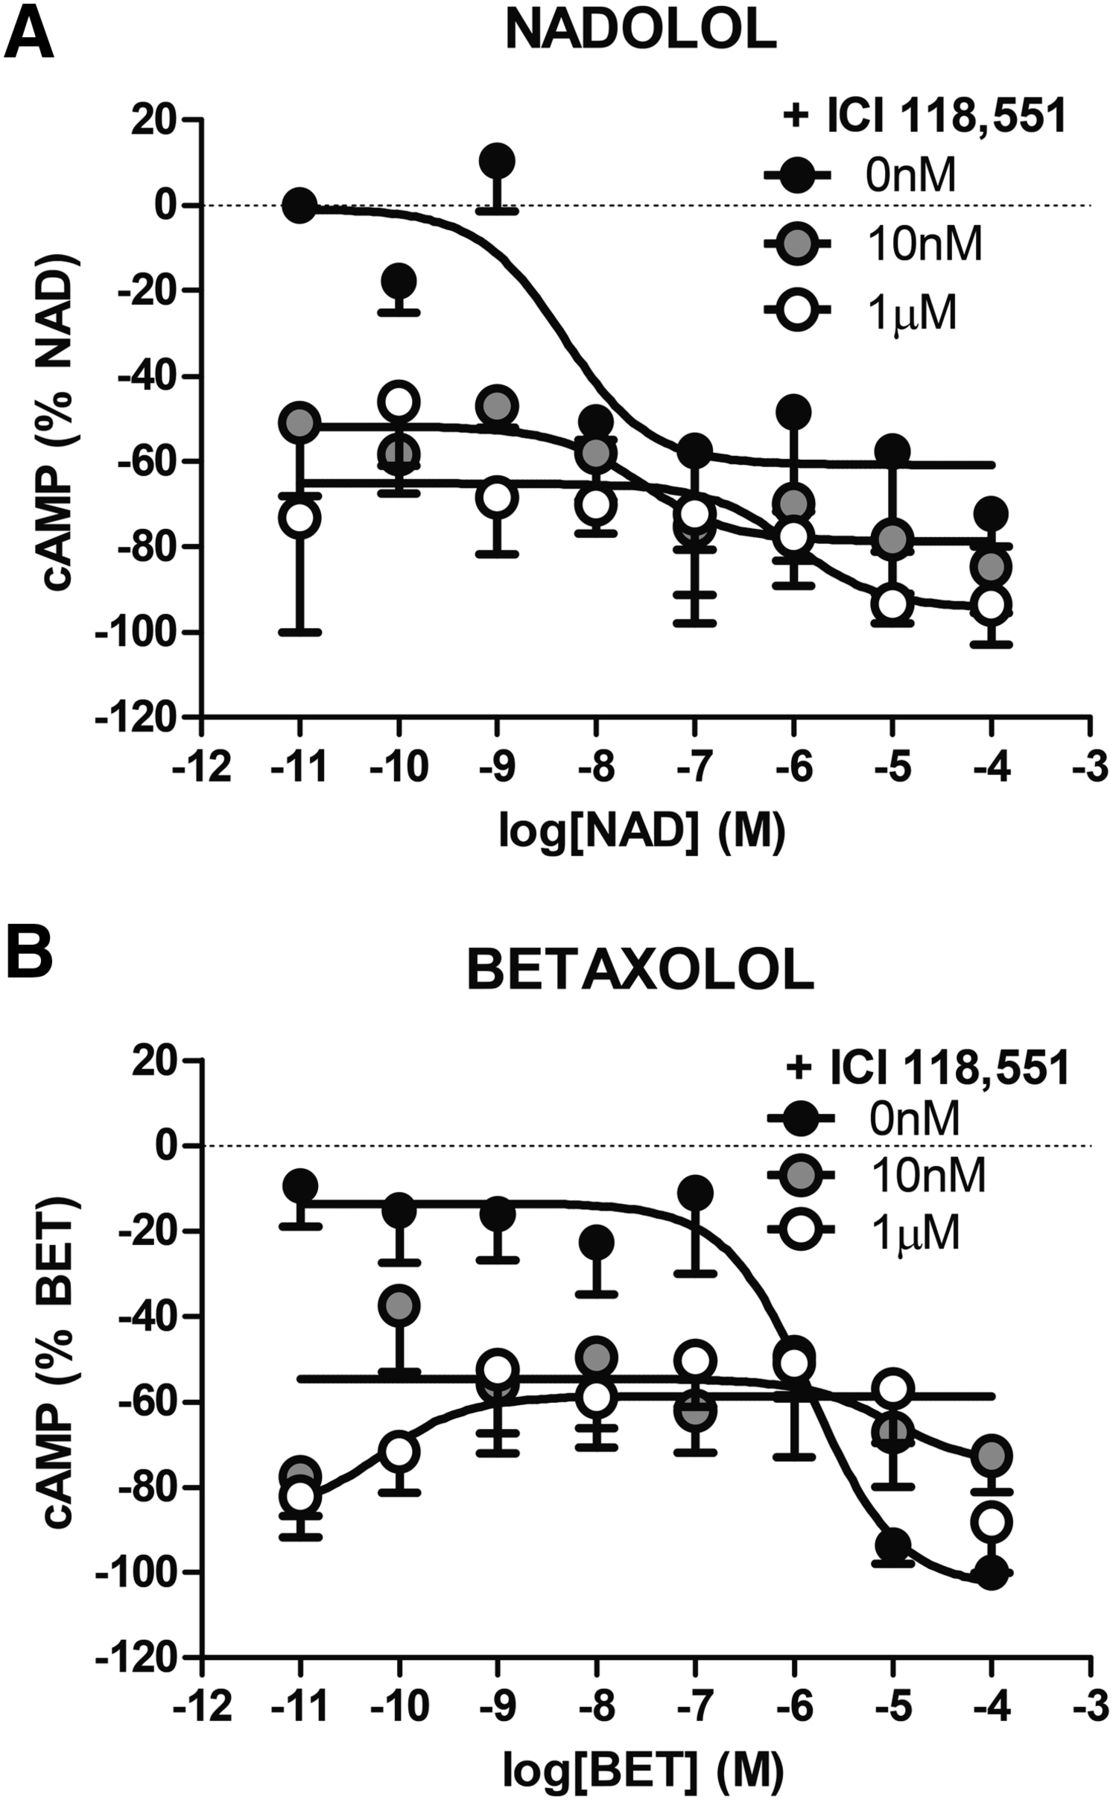
To further assess the β2AR selectivity of the remaining compounds, the ability of the β2AR-selective ligand ICI 118,551 to inhibit the concentration-dependent responses evoked by ISO, SALB, SALM, LAB, BUC, PIN, XAM, CARV, BIS, and NAD was tested. As shown in Fig. 2, pretreatment with 10 nM or 1 μM ICI 118,551 right-shifted the cAMP concentration-response curves to ISO, SALB, SALM, LAB, BUC, and PIN in a manner characteristic of classic competitive antagonism. Similarly, the ERK1/2 responses promoted by ISO, SALB, SALM, LAB, BUC, PIN, XAM, and CARV (Fig. 3); the calcium mobilization induced by ISO, SALB, and SALM (Fig. 4); and the endocytosis stimulated by ISO and SALB (Fig. 5) were also antagonized by ICI 118,551. However, in some cases, the inhibition appeared noncompetitive most likely due to the fact that ICI 118,551 did not fully dissociate from the receptor within the time frame of the functional assay (1–2 minutes). In any case, the ability of ICI 118,551 to right-shift the concentration-response curves confirmed that these responses were mediated by the β2AR. Similarly, the fact that no further inhibition of the cAMP production could be promoted by BIS and NAD after the pretreatment with ICI 118,551 confirmed that these inverse agonist activities were β2AR specific and that ICI 118,551 is an inverse agonist at the β2AR for the cAMP response (Fig. 6).

Increasing concentrations of the β2AR-selective antagonist ICI 118,551 shifts the agonist-stimulated concentration-response curves of cAMP. Pretreating cells with ICI 118,551 (10 nM or 1 μM; 60 minutes) right-shifted the concentration-response curves of the β2AR-selective ligands ISO (A), SALB (B), SALM (C), LAB (D), BUC (E), PIN (F) in a classically competitive manner. Data are the mean ± S.E.M. of 5 independent experiments performed in triplicate.

Increasing concentrations of the β2AR-selective antagonist ICI 118,551 shifts the agonist-stimulated concentration-response curves of ERK1/2. Pretreating cells with ICI 118,551 (10 nM or 1 μM; 60 minutes) right-shifted the concentration-response curves of the β2AR-selective ligands ISO (A), SALB (B), SALM (C), LAB (D), BUC (E), PIN (F), XAM (G), CARV (H). Data are the mean ± S.E.M. of 5 independent experiments performed in triplicate.

Increasing concentrations of the β2AR-selective antagonist ICI 118,551 shifts the agonist-stimulated concentration-response curves of calcium. Pretreating cells with ICI 118,551 (10 nM or 1 μM; 60 minutes) right-shifted the concentration-response curves of the β2AR-selective ligands ISO (A), SALB (B), and SALM (C). Data are the mean ± S.E.M. of 3 independent experiments with repeats in triplicate.

Increasing concentrations of the β2AR-selective antagonist ICI 118,551 shifts the agonist-stimulated concentration-response curves for receptor endocytosis. Pretreating cells with ICI 118,551 (10 nM or 1 μM; 60 minutes) right-shifted the concentration-response curves of the β2AR-selective ligands ISO (A) and SALB (B). Data are the mean ± S.E.M. of 3 independent experiments with repeats in triplicate.

Increasing concentrations of the β2AR-selective antagonist ICI 118,551 did not shift the inverse agonist-stimulated concentration-response curves of cAMP. Pretreating cells with ICI 118,551 (10 nM or 1 μM; 60 minutes) did not shift the concentration-response curves for NAD (A) or BET (B), which were identified as inverse agonists toward cAMP, due to the inverse agonist activity of ICI 118,551 that itself decreased the cAMP levels after pretreatment of the cells (60 minutes). Data are the mean ± S.E.M. of 4–6 independent experiments performed in triplicate.
On the basis of their efficacy profiles (Table 2), the 10 compounds with β2AR-selective responses fall into 5 different clusters: 1) agonists for 4 pathways (ISO and SALB); 2) agonists for 3 pathways (SALM); 3) agonists for 2 pathways (LAB, BUC, and PIN); 4) agonists for 1 pathway (XAM and CARV); and 5) inverse agonists on 1 pathway (BIS and NAD). Each of these clusters is described in more detail below.
Multifarious Ligands Activating Four Pathways (cAMP, ERK1/2, Calcium, and Receptor Endocytosis).
Although four compounds activated all four pathways, β2AR selectivity was only observed for two compounds, ISO and SALB (Fig. 7, A and B). To compare the relative efficacies of the compounds, ISO was used as the reference compound, and all data were expressed as a percentage of the maximal stimulation promoted by ISO. Considering the potencies toward the different pathways, ISO showed no significant selectivity, with similar pEC50 values for the 4 signaling modalities (Fig. 7A; Table 2). In contrast, SALB had different potencies toward the different pathways, the rank order of potency being ERK>cAMP>calcium>endocytosis with a spread of more than 4 logarithmic units difference between the most and least responsive signaling modalities (Fig. 7B; Table 2). The maximum agonist effects of SALB toward cAMP production and ERK1/2 activation were similar to ISO. However, SALB behaved as a partial agonist toward both calcium mobilization and endocytosis, resulting in 50% and 45% of the maximal ISO responses for these two pathways, respectively. These data demonstrate that SALB is a functionally selective ligand and also suggest that the 4 pathways downstream of the β2AR are, at least in part, independent from each other.
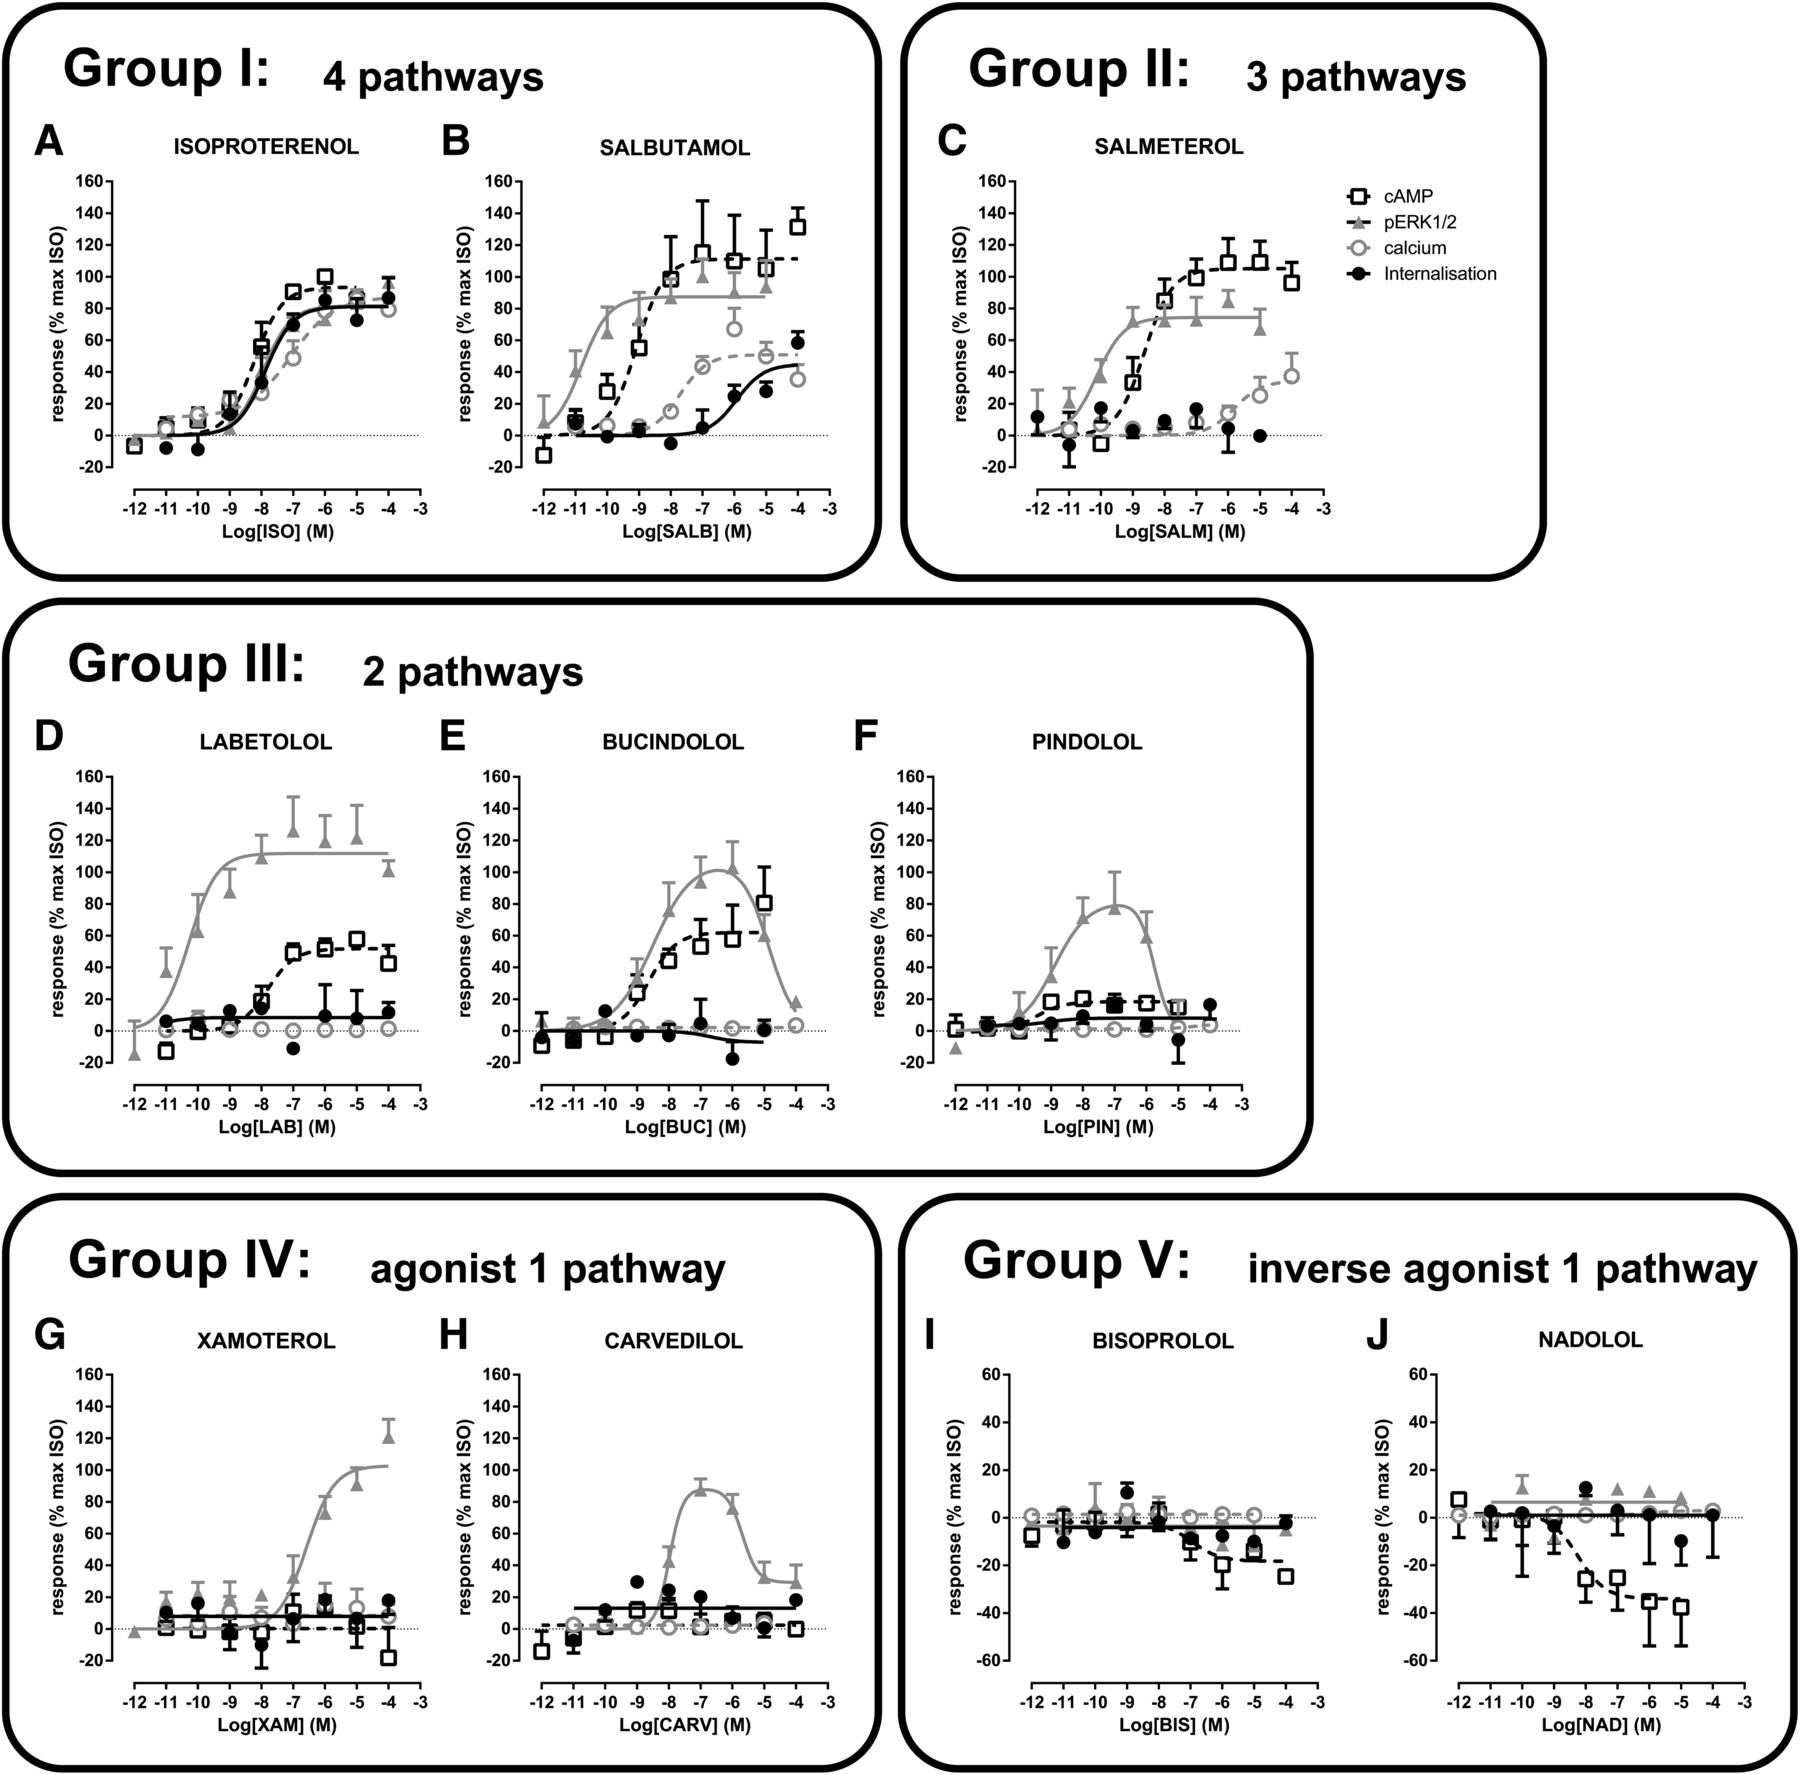
The profiles of the adrenergic ligands fall into 5 distinct clusters based on their efficacy and potency toward the 4 different signaling pathways. Cells were stimulated with increasing concentrations of ISO (A), SALB (B), SALM (C), LAB (D), BUC (E), PIN (F), XAM (G), CARV(H), BIS (I), and NAD (J). Responses to the different signaling pathways were measured: cAMP using EPAC biosensor (37°C; 30 minutes), ERK1/2 with the Surefire pERK1/2 kit (37°C; 2 or 4 minutes), calcium with the obelin biosensor (25°C; 0–60 seconds), and receptor internalization by cell surface enzyme-linked immunosorbent assay (37°C; 30 minutes). Data are the mean ± S.E.M. of 3–6 independent experiments with repeats in triplicate.
A Ligand Deficient in β2AR Endocytosis.
SALM was the only compound that activated cAMP, ERK1/2, and calcium without promoting β2AR endocytosis (Fig. 7C; Table 2). For the 3 other pathways, the order of potency for SALM was the same as that observed for SALB (ERK>cAMP>calcium). SALM was a full agonist toward ERK1/2 and cAMP, but a partial agonist toward calcium (34% of the maximal isoproterenol-stimulated response), similar to what was observed for SALB.
Ligands That Activated Two Pathways (cAMP and ERK1/2).
LAB, BUC, and PIN all activated cAMP production and ERK1/2 but not calcium mobilization or β2AR endocytosis (Fig. 7, D–F; Table 2). LAB was significantly more potent toward the ERK1/2 than the cAMP pathway, with differences of 2 logarithmic units between the two pathways. LAB was a full agonist for the ERK1/2 pathway (107% of the ISO-stimulated response) but was a partial agonist for cAMP production (52% of the ISO-stimulated response) (Fig. 7D; Table 2). In contrast to LAB, PIN and BUC had similar potencies toward the two pathways. PIN was a partial agonist toward the cAMP and ERK1/2 pathways (18 and 62% of the ISO-stimulated response, respectively), whereas BUC was a partial agonist toward cAMP, but a full agonist toward ERK1/2 (62 and 107% of the ISO-stimulated response, respectively) (Fig. 7, E and F; Table 2). In addition, BUC and PIN promoted bell-shaped ERK1/2 responses, indicating that at higher concentrations they inhibit this pathway, thus further distinguishing them from the other ligands.
Agonists or Inverse Agonists That Activated (ERK1/2) or Inhibited (cAMP) Only One Pathway.
XAM and CARV were neutral ligands toward all pathways, except for selectively activating ERK1/2 through the β2AR, indicating a very high level of functional selectivity (Fig. 7, G and H). XAM activated the ERK1/2 pathway to a similar extent as ISO (103% of the ISO-stimulated response), whereas CARV acted as a partial agonist (85% of the ISO-stimulated response). CARV promoted a biphasic activation profile similar to those observed for BUC and PIN, in contrast to XAM that activated ERK1/2 in a monophasic manner. The activation of the ERK1/2 signaling pathway, in the absence of any of the other signaling modalities, suggests that β2AR-promoted ERK1/2 activation was independent from cAMP production, calcium mobilization, or receptor endocytosis. In contrast to the lack of significant CARV-stimulated endocytosis that we observed (6.7 ± 12.0%), CARV was previously shown to induce a small yet statistically significant β2AR internalization (5.5 ± 1.7%) in HEK293 cells (Wisler et al., 2007). Yet, as in the present study, the CARV-induced endocytosis was found to be marginal compared with the ISO-stimulated internalization (38.7 ± 3.5% in Wisler et al. [2007] and 53.6 ± 2.7% in our study). Thus the difference between the two studies is quantitative and not qualitative and probably due to a different sensitivity of the assays used to measured endocytosis.
Although six compounds were inverse agonists for the cAMP pathway, only two compounds (BIS and NAD) were selectively acting at the β2AR (Fig. 1). When compared with the maximal stimulatory activity of ISO, NAD and BIS promoted inhibitory responses of −34 and −13%, respectively (Fig. 7, I and J).
Quantification of Ligand Bias.
As shown in Table 2, the potencies and efficacies toward the different pathways varied significantly among the compounds, suggesting the occurrence of biased signaling. To quantify this bias, we applied the operational model to derive transduction ratios (τ/KA) as a distillation of the effect of the compounds on receptor conformations underlying the different signaling modalities. The transduction ratios and resulting bias factors are shown in Tables 3 and 4. Because ISO displayed similar potencies and, hence, similar (τ/KA) ratios between pathways, this was used as the reference agonist against which all within-pathway comparisons to the other agonists were made [Δlog(τ/KA)]. The responses to ISO for all four pathways yielded similar potencies, revealing ISO as functionally distinct from the other test compounds. Because the potencies for ISO toward all pathways were similar, the variable potencies observed for the other ligands could not be attributed to differences in the level of amplification between the signaling pathways nor the assay sensitivity. These features of ISO made it an ideal candidate for a reference compound at the β2AR and a better choice than EPI, the endogenous ligand for the β2AR, because EPI activated ERK1/2 via endogenously expressed αARs in addition to the overexpressed β2ARs (Fig. 1). As previously highlighted (Kenakin and Christopoulos, 2013), ligand bias is a relative term; without comparison with a reference agonist to cancel out the influence of system and observation biases, true ligand bias cannot be determined. Subsequently, between-pathway comparisons were made for a given ligand in the form of the final bias factor [ΔΔlog(τ/KA)]. Because ISO oxidizes, it was important to verify that any signaling bias calculated in reference to this compound did not result from a change in the actual concentration during the course of the experiment. For this purpose, time- and dose-dependent ISO-promoted cAMP production was monitored by the EPAC biosensor in the presence and absence of ascorbate. As shown in Supplemental Fig. 2, the addition of ascorbate did not significantly affect either the kinetics or the dose-response curves obtained. Because cAMP was the assay involving the longest time of incubation, the oxidation of isoproterenol did not influence the ligand biases calculated in the present study. This suggests that in the time frame of the experiments (30 minutes) and at the temperature used (37°C), only marginal oxidation occurs.
Transduction ratios [log(τ/KA)] of adrenergic agonists at the β2AR
HEK-HA-β2AR cells were stimulated with different concentrations of β2AR-selective ligands and responses were measured for 4 distinct signaling pathways. Data were analyzed by nonlinear regression using the Operational Model equation (see Supplemental Appendix 1) in Graphpad Prism v6 to determine the logR values [equivalent to log(τ/KA) ratios]. Δlog(τ/KA) ratios were calculated from the log(τ/KA) ratios considering ISO as the reference ligand using eq. 8. The relative effectiveness (RE) of the ligands toward each pathway, relative to ISO, was determined by eq. 9. The standard error was estimated using eq. 13. Data are the mean ± S.E.M. of 3–6 independent experiments with repeats in duplicate. Data were analyzed in a pairwise manner using a two-tailed unpaired Student’s t test [on the Δlog(τ/KA) ratios] to determine the significance of the relative effectiveness.
ΔΔlog(τ/KA) ratios and bias factors for adrenergic agonists at the β2AR
HEK-HA-β2AR cells were stimulated with different concentrations of clinically relevant β2AR-selective ligands and responses were measured for 4 distinct signaling pathways. ΔΔlog(τ/KA) ratios were calculated from the Δlog(τ/KA) ratios (Table 3) using eq. 10. The ligand bias factors (BF), relative to ISO, were determined using eq. 11. The standard error was estimated using eq. 14. Data are the mean ± S.E. of 3–6 independent experiments with repeats in duplicate. Data were analyzed in a pairwise manner using a two-tailed unpaired Student’s t test [on the Δlog(τ/KA) ratios] to determine the significance of the ligand biases.
Comparison of the bias factors for each ligand between the different pathways revealed that, relative to ISO, many ligands were biased for the ERK1/2 pathway over the cAMP pathway, the cAMP pathway over calcium mobilization, whereas there was no bias for calcium over β2AR endocytosis (Fig. 8; Table 4). Together, this suggests that there was a rank order of pathway bias for all of the compounds tested at the β2AR (ERK>cAMP>calcium = endocytosis). LAB was the compound with the strongest bias toward the ERK1/2 over cAMP, activating ERK1/2 signaling 1108-fold better than cAMP signaling. SALB and SALM for their part were 62- and 19-fold better at activating ERK1/2 than cAMP, respectively (Table 4). The biases of SALB and SALM toward cAMP over calcium were 3- and 17-fold, respectively, whereas they were 183- and 316-fold for ERK over calcium (Table 4). SALB was 4-fold better at activating cAMP over endocytosis and 223-fold better at activating ERK1/2 than endocytosis. PIN and BUC, which could activate only cAMP and ERK1/2 signaling, were not significantly biased for either of the two pathways (Table 4). Bias factors were not calculated for all pathways for all ligands, because the absence of stimulation of a pathway prevents the calculation of a τ/KA ratio. However, when a pathway was not activated by a ligand, it may be indicative that the bias was even greater than the largest bias that could be calculated between the two pathways considered. For example, CARV and XAM, which could activate ERK1/2 but not cAMP, calcium, or receptor endocytosis (Fig. 3; Table 2), may be activating ERK1/2 at least 1108-fold better than cAMP, 316-fold better than calcium, and 223-fold better than endocytosis. Alternatively, if the lack of effect is solely due to weak coupling efficiency, then any underlying bias may not be as extreme.

Adrenergic ligands are predominantly biased toward ERK1/2 signaling. Bias factors were calculated from the agonist concentration-response curves (shown in Fig. 7) using the operational model (see Supplemental Appendix 1). The ΔΔlog(τ/KA) value is indicated on top of the bars. Log(bias factor) of the ligands demonstrate that SALB (purple bars), SALM (red bars), and LAB (light blue bars) were strongly biased toward the ERK1/2 pathway over all other pathways. BUC (yellow bar) and PIN (orange bar) were not biased toward either the ERK1/2 or cAMP signaling. There was no bias observed between the calcium and endocytosis for SALB. Data are the mean of 3–6 independent experiments with repeats in duplicate or triplicate.
Because the system used to test the bias would be predicted to influence the biases observed toward different pathways, as a result of the different relative concentration of the signaling partners and their responsiveness, we tested the cAMP and ERK1/2 responses in a different system for three compounds that showed a strong bias toward ERK1/2 versus cAMP in the HEK-HA-β2AR cells. For this purpose we used the parental HEK293S cells that express a very low level of β2AR. As can be seen in Supplemental Fig. 5 and Supplemental Table 1, LAB could not evoke any detectable cAMP or ERK1/2 response in cells expressing such a low level of receptor. Both SALM and SALB did stimulate the two pathways; however, in contrast to what was observed in the overexpressing HEK-HA-β2AR, SALB was not biased toward either the ERK1/2 or cAMP pathways, whereas SALM was slightly biased toward ERK with an ERK-cAMP bias factor of 1.74 (Supplemental Tables 2 and 3). These results dramatically demonstrate the importance of the system in the observed bias.
Discussion
Functional selectivity is likely to be a widespread phenomenon underlying drug action at GPCRs. At the molecular level, this reflects ligand bias ("biased agonism"), the ability of different ligands to stabilize distinct conformational ensembles of receptor-transducer pairs at the expense of others, the consequence being signal pathway selectivity. Although relative bias is clearly a property of a given ligand-receptor couple, it is also influenced by the system in which it is measured. To exploit ligand bias in a manner that can assist structure-activity studies or compound classification/selection strategies, it is necessary to use methods that remove observational biases on functional selectivity, as well as ensuring that the cell-based behavior truly reflects on-target, rather than off-target, effects. Our study highlights both of these phenomena as well as the influence of the system on the observed biases.
The systematic analysis outlined in this study, using 19 β-adrenergic ligands and four distinct pathways (cAMP, ERK1/2, calcium, and receptor endocytosis), revealed that despite overexpression of the target β2AR, many ligands have detectable efficacy toward other endogenously expressed adrenoceptors in HEK293S cells. Because of the confounding effects that the stimulation of more than one receptor subtype has on the signaling outcomes, biases cannot be determined for such ligands. Yet this is useful information because these off-target effects may contribute to either the therapeutic efficacy or undesirable effects of drugs.
For ligands acting selectively through the β2AR, the operational model revealed a rank order of pathway bias (ERK>cAMP>Ca = endocytosis) for three of the agonists tested (SALB, SALM, LAB) relative to ISO. Compounds with neutral or inverse efficacies cannot be included in the formal bias analysis, yet they are clearly favoring different receptor conformations than the agonists. The different signaling profiles, based on the ability of the compounds to activate specific pathways, clustered into five groups, potentially representing the propensity of each of these ligand groups to stabilize different receptor–effector complexes. Given that some compounds evoked biphasic concentration-response curves, one could also include this as a criteria to cluster the ligands into seven groups rather than five to account for the unusual behavior of these ligands. Collectively, this study presents a framework for the quantitative evaluation of GPCR ligand bias in a manner that can facilitate more informed compound classification and, if implemented as a routine approach in drug discovery workflows, preclinical drug candidate selection.
One striking observation was that all compounds, except for BUC and PIN, were significantly biased for ERK1/2 signaling over the other pathways relative to ISO. In addition, when a single pathway was activated by a ligand (e.g., CARV and XAM), it was always ERK1/2. The mechanism underlying such prevalence of the ERK1/2 pathway is unknown but could be explained by the fact that many effectors (Gαs, Gαi, β-arrestin) couple the β2AR to the ERK1/2 pathway (Daaka et al., 1997; Azzi et al., 2003; Keiper et al., 2004). Consistent with this notion, several of the compounds (BUC, PIN, and CARV) activated ERK1/2 in a biphasic manner, a phenomenon that can result from ligand-promoted activation of several concurrent signaling pathways (Dittman et al., 1994; Rovati and Nicosia, 1994). Of note, many ligands that activated ERK1/2 did so in the absence of any detectable endocytosis. Given the proposed role of β-arrestin (Azzi et al., 2003; Shenoy et al., 2006) and β-arrestin–mediated endocytosis (Daaka et al., 1998) in the ISO-stimulated ERK1/2 activity, it will be of interest to determine the signaling pathways underlying the activation by ligands that do not promote endocytosis.
For all compounds tested, calcium was a less preferred pathway, being either weakly or not stimulated, even for compounds that maximally stimulated ERK1/2 or cAMP, indicating that this pathway is at least in part independent from the cAMP and ERK responses. The exact mechanism responsible for the calcium mobilization in the HEK-HA-β2AR cells used in the present study is unknown, but could occur via a Gs-cAMP-EPAC-Rap2B-PLCε–dependent pathway, as in HEK293 cells (Schmidt et al., 2001); a Gs-cAMP-PKA-dependent pathway, as in cardiomyocytes or rat hippocampal neurons (Zhang et al., 2001; Tzingounis et al., 2010); or via Gi, as in cardiomyocytes (Zhang et al., 2001). Alternatively, it could be due to a crosstalk between the Gs-coupled β2AR and Gq-promoted IP3 productions as in mouse airway smooth muscle cells overexpressing the β2AR (McGraw et al., 2003). Determining which pathway is responsible for the calcium responses observed in the present study as well as the molecular basis for the bias observed opens interesting new avenues.
The importance of the system used to assess ligand biases was clearly illustrated by the difference in the bias values obtained in two cell lines expressing different β2AR levels. Consistent with the notion that the effectiveness toward a given pathway is defined by the ligand’s affinity (KA) and the stimulus–effect relationship (Black and Leff, 1983) for this pathway, our data show different transduction ratios [log(τ/KA)] for the two cell systems; the ERK1/2 pathway being more affected than cAMP. These changes were not equivalent for all ligands, consistent with the notion of bias. The specific mechanisms responsible for these system-dependent differences are not known but could be linked to the relative expression levels of the receptor versus effectors, the constitutive activity or the desensitization state of the different components involved.
The prevailing hypothesis to explain functional selectivity proposes that different ligands promote or stabilize different receptor conformation(s) with preferential affinities for subsets of effectors. Recent structural studies on the β2AR confirmed that different compounds stabilized distinct receptor conformations (Rasmussen et al., 2007; Wacker et al., 2010), consistent with this notion. However, the recent findings that the effectors contributed to the conformational changes undergone by a receptor and that these conformational changes were translated into altered affinities for the ligands (Rasmussen et al., 2011) suggest that assembly of receptor–effector complexes before ligand binding could contribute to functional selectivity. This hypothesis is supported by our study, where the distributions of potencies of a given compound for activation of distinct signaling pathways were observed to be as vast as four orders of magnitude (e.g., SALB potency for ERK1/2 versus endocytosis).
The influence that the effector can have on receptor conformation and hence ligand affinity is taken into account by the approach used in the present study, where the τ/KA ratios used to assess biases are derived directly from the concentration-response curves that take into account differences in ligand affinities for the different agonist–receptor–effector complexes (Kenakin et al., 2012). This is different from other approaches using affinity (pKd) values derived from competition binding experiments against a single radioligand to calculate τ values. Indeed, such approaches assume that the affinity of the ligand for the receptor–effector complex is the same in the activation of all signaling pathways. Given that different affinity values can be obtained for a given compound when determined in competition against different radioligands [e.g., ISO pKd obtained when using different radioligands: [125I]pindolol = 7.54 (Del Carmine et al., 2002); [3H]CGP-12177 = 6.64 (Baker, 2010); [3H]epinephrine = 8.68 (U’Prichard et al., 1978)], the affinity of compounds toward a particular agonist–receptor–effector complex using a single binding affinity value may introduce a probe dependency into the calculation of signaling bias. With use of this approach, SALM was biased for β-arrestin recruitment over cAMP signaling (Rajagopal et al., 2011), which is surprising given that SALM did not promote β2AR endocytosis measured by cell-surface enzyme-linked immunosorbent assay (Table 2; Drake et al., 2008) or confocal microscopy (Moore et al., 2007). This apparent paradox could result from the method used to calculate biases as suggested above. Alternatively, it could be explained if SALM stabilizes a β2AR–β-arrestin complex unable to endocytose. Consistent with this possibility, differences in biased agonism for β-arrestin recruitment versus β-arrestin rearrangements were recently reported (Zimmerman et al., 2012). The differences could also be explained by the use of a chimeric β2AR-vasopressin 2 receptor in the Rajagopal et al. (2011) study for the β-arrestin recruitment assays.
Calculating bias factors for ligands and signaling pathways adds a new level of texture in examining drug responses. Examples of compounds with differences in their therapeutic activity, possibly resulting from functional selectivity, are starting to emerge (Violin et al., 2013). The present study has broadened the notion of ligand bias and expanded the information available regarding the efficacy of β-adrenergic ligands at the β2AR. In addition it provided a framework to systematically compare a large number of ligands for diverse signaling pathways. Further studies will be needed to establish the links between the signaling signatures, the therapeutic efficacy, the safety profiles, and the chemical structures of the compounds in specific signaling clusters in physiologically relevant cell lines and whole animal models. This is still a significant challenge, especially when considering the importance of the system used (e.g., cell types, receptor and effector expression levels, etc.) to determine the signaling biases. However, applying a systematic approach such as the one describe herein across different systems should allow the classification of compounds into functionally distinct clusters that should facilitate the design of drugs with increased therapeutic efficacy and reduced side effect profiles.
Acknowledgments
The authors thank Dr. Monique Lagacé for critical reading of the manuscript and assistance with preparation of the figures, and Wayne Stallaert for discussion on different aspects of experimental design and data analysis. The authors also thank Christian Charbonneau for assistance in the preparation of Fig. 8.
Authorship Contributions
Participated in research design: van der Westhuizen, Bouvier.
Conducted experiments: van der Westhuizen.
Contributed new reagents or analytic tools: Breton, Christopoulos.
Performed data analysis: van der Westhuizen.
Wrote or contributed to the writing of the manuscript: van der Westhuizen, Christopoulos, Bouvier.
Footnotes
- Received July 29, 2013.
- Accepted December 23, 2013.
This work was supported, in part, by grants to M.B. from the Canadian Institutes for Health Research [MOP 11215]. E.T.v.d.W. was supported by postdoctoral research fellowships from the Canadian Institutes for Health Research; the Canadian Hypertension Society; the Fonds de la Recherche en Santé du Quebec; and the National Health and Medical Research Council Australia (NHMRC). B.B. was supported by a PhD scholarship from the Fonds de la Recherche en Santé du Quebec. A.C. is a Principal Research Fellow of the NHMRC. M.B. holds the Canada Research Chair in Signal Transduction and Molecular Pharmacology.
↵
 This article has supplemental material available at molpharm.aspetjournals.org.

Abbreviations
- ALP
- alprenolol
- ATEN
- atenolol
- β2AR
- β2-adrenergic receptor
- BET
- betaxolol
- BIS
- bisoprolol
- BUC
- bucindolol
- CARV
- carvedilol
- CGP-12177
- 4-[3-[(1,1-dimethylethyl)amino]2-hy\x{200b}droxypropoxy]-1,3-dihydro-2H-benzimidazol-2-one; CGP-20712A, (±)-2-hydroxy-5-[2-[[2-hydroxy-3-[4-[1-methyl-4-(trifluoromethyl)-1H-imidazol-2-yl]phenoxy]propyl]amino]ethoxy]-benzamide methanesulfonate salt
- DMEM
- Dulbecco's modified Eagle's medium
- EPAC
- exchange protein directly activated by cAMP
- EPI
- epinephrine
- ERK1/2
- extracellular signal-regulated kinase 1/2
- FBS
- fetal bovine serum
- FRET
- fluorescence resonance energy transfer
- GPCR
- G protein–coupled receptor
- HA
- hemagglutinin
- HBSS
- Hanks' balanced salt solution
- HEK
- human embryonic kidney
- ICI 118,551
- (±)-erythro-(S*,S*)-1-[2,3-(dihydro-\x{200b}7-methyl-1H-inden-4-yl)oxy]-3-[(1-methylethyl)amin\x{200b}o]-2-butanol hydrochloride
- ISO
- isoproterenol
- LAB
- labetalol
- NAD
- nadolol
- NE
- norepinephrine
- PE
- phenylephrine
- PIN
- pindolol
- PRO
- propranolol
- SALB
- salbutamol
- SALM
- salmeterol
- SB
- stimulation buffer
- TIM
- timolol
- UK 14,304
- 5-bromo-N-(2-imidazolin-2-yl)-6-quinoxalinamine, 5-bromo-N-(4,5-dihydro-1H-imidazol-2-yl)-6-quinoxalinamine
- XAM
- xamoterol
- Copyright © 2014 by The American Society for Pharmacology and Experimental Therapeutics


