


Abstract
The formylpeptide receptor (FPR) family of G-protein-coupled receptors contributes to the localization and activation of tissue-damaging leukocytes at sites of chronic inflammation. We developed a FPR homology model and pharmacophore (based on the bovine rhodopsin crystal structure and known FPR ligands, respectively) for in silico screening of ∼480,000 drug-like small molecules. A subset of 4324 compounds that matched the pharmacophore was then physically screened with the HyperCyt flow cytometry platform in high-throughput, no-wash assays that directly measure human FPR binding, with samples (each ∼2500 cells in 2 μl) analyzed at 40/min. From 52 confirmed hits (1.2% hit rate), we identified 30 potential lead compounds (inhibition constant, Ki = 1-32 μM) representing nine distinct chemical families. Four compounds in one family were weak partial agonists. All others were antagonists. This virtual screening approach improved the physical screening hit rate by 12-fold (versus 0.1% hit-rate in a random compound collection), providing an efficient process for identifying small molecule antagonists.
The G-protein-coupled formylpeptide receptor (FPR) was one of the originating members of the chemoattractant receptor superfamily (Oppenheim et al., 1991; Le et al., 2002). N-formylated peptides such as formylmethionine-leucine-phenylalanine are high-affinity FPR ligands that trigger a variety of biologic activities in myeloid cells, including chemokinesis, chemotaxis, cytokine production, and superoxide generation (Murphy, 1994; Le et al., 2001; Tiffany et al., 2001; He et al., 2003). Because such peptides are derived from bacterial or mitochondrial proteins (Carp, 1982; Marasco et al., 1984; Schiffmann et al., 1975), it has been proposed that a primary FPR function is to promote trafficking of phagocytic myeloid cells to sites of infection and tissue damage, where they exert antibacterial effector functions and clear cell debris. In support of this hypothesis, mice lacking a known murine FPR variant were more susceptible to bacterial infections (Gao et al., 1999). Long known to be expressed by neutrophils and monocytes, FPR have more recently been identified in hepatocytes, immature dendritic cells, astrocytes, microglial cells, and the tunica media of coronary arteries (Le et al., 2002). The glucocorticoid-regulated protein annexin I (lipocortin I) was recently identified as a protein of host origin that is a specific agonist for human FPR (Walther et al., 2000). Moreover, HIV-1 envelope proteins contain domains capable of interacting with either or both FPR and the related FPR family member FPRL1 (Su et al., 1999; Le et al., 2000; VanCompernolle et al., 2003). These receptors have been proposed as prospective targets for therapeutic intervention against malignant gliomas (e.g., http://pharmalicensing.com/licensing/displicopp/3019). The diverse tissue expression of FPR and the expanding range of identified FPR ligands suggest the possibility of as-yet unappreciated complexity in the innate immune response and perhaps other unidentified physiological functions for FPR.
HyperCyt is a novel automated high-throughput flow cytometry (HTFC) analysis platform by which cell samples are rapidly aspirated from microplate wells and delivered to the flow cytometer. Accurate quantitative measurements have been demonstrated in endpoint assays at 40 samples/min over a 4-decade range of fluorescence intensity. Intact cells may be used at concentrations of 1 to 20 million/ml in assay volumes of 8 to 15 μl (Ramirez et al., 2003). Typical sample volumes of 1 to 2 μl from each assay volume allow scarce quantities of test cells or reagents to be efficiently used. We recently initiated a HyperCyt-based HTFC screening effort to detect potential anti-inflammatory compounds that block ligand binding to FPR. A fluorescence-based HTFC ligand competition assay was characterized and validated in screening of the Prestwick Chemical Library (Young et al., 2005). A previously documented FPR antagonist with an inhibition constant (Ki) of ∼14 μM was detected from among the 880 small molecule drugs and alkaloids screened (Young et al., 2005).
The present study was subsequently undertaken to identify novel small molecule FPR ligands. We first developed a computational FPR model that employed a homology model of rhodopsin, the only vertebrate GPCR crystallized to date, together with a pharmacophore model constructed based on previously documented FPR agonists and antagonists. The computational model was then used to screen a commercial collection of ∼480,000 compounds in silico, identifying a small subset predicted to be enriched with FPR antagonists. Supporting this prediction, and the hypotheses underpinning the model, the frequency of active structures detected in subsequent HTFC screening was more than 10-fold higher than expected from a random compound collection. We identified potential lead structures representing nine distinct chemical families, a group of promising reagents for probing FPR functional diversity and therapeutic significance.
Materials and Methods
Compounds. The Chemical Diversity Laboratories collection (∼480,000 compounds) was filtered (Olah et al., 2004) for molecular weight (range 150-600) and atom type content (only C, N, O, H, S, P, F, Cl, Br, and I were permitted). A 3D pharmacophore hypothesis was then used for the virtual screening of the remaining collection of 434,000 structures (see Results, LVBS Using the Pharmacophore Model). Based on this model, 4234 structures with the proper 3D arrangement of topological elements matching the pharmacophore were made available for physical screening at UNM.
Cells and Reagents. Fluorescein-labeled formylmethionine-leucine-phenylalanine-lysine (fMLFK-FITC) and unlabeled formylmethionine-leucine-phenylalanine-phenylalanine (fMLFF, 4PeP), formylmethionine-leucine (fML, 2PeP), and formylnorleucine-leucine-phenylalanine-norleucine-tyrosine-lysine (fNleLFNleYK) were obtained from Penninsula Labs (San Carlos, CA). The fNleLFNleYK was tagged with Alexa-633 (Invitrogen, Carlsbad, CA) as described previously (Key et al., 2003). Myeloid U937 cells transfected with the human FPR were cultured in RPMI 1640 medium supplemented with 10% fetal bovine serum (Hyclone, Logan, UT), 2 mM l-glutamine, 10 mM HEPES, 10 U/ml penicillin, 10 μg/ml streptomycin, 4 μg/ml ciprofloxacin, and 500 μg/ml Geneticin (Invitrogen, Tokyo, Japan). Cultures were grown at 37°C in a 5% CO2 atmosphere, and passaged every 3 days. Unless otherwise indicated, U937 cells were used that expressed a mutant FPR with glycine and alanine substituted for serine and threonine residues in the C-terminal tail (DeltaST) (Prossnitz, 1997). DeltaST cells do not internalize the receptor when stimulated with fMLF (Prossnitz, 1997). Chemical reagents were obtained from Sigma (St. Louis, MO) unless otherwise specified. Mouse melanoma B78H1 cells expressing the transfected human VCAM-1 gene (B78H1-VCAM1) were prepared and cultured as described previously (Chigaev et al., 2003).
FPR Assay. The FPR assay measured the ability of test compounds to compete with a high-affinity fluorescent ligand, fMLFK-FITC, for binding to cell membrane FPR. The assay has recently been characterized and validated in a separate series of studies (Young et al., 2005). The assay response range was defined by replicate control wells containing unlabeled fMLFF blocking peptide (4PeP) or buffer alone. Unlabeled fMLFF was at a 100-fold higher concentration that completely blocked binding of the fluorescent ligand, so wells containing this were designated blocked controls. Control wells containing buffer alone were designated unblocked controls. Test compound inhibition of fluorescent peptide binding was calculated as 100 × [1 - (MFITest - MFIBlocked)/(MFIUnblocked - MFIBlocked)], in which MFI was the median fluorescence intensity of cells in wells containing test compounds, blocked control wells and unblocked control wells as indicated by subscripts of each MFI term in the equation. Compounds inhibiting 70% or more were considered “hits”.
For assay performance, additions to wells were in sequence as follows: 1) test compounds and control reagents (5 μl/well); 2) cells (107/ml, 5 μl/well); 3) (after 30 min, 4°C incubation) fMLFK-FITC (5 μl/well). After an additional 45 min, 4°C incubation, plates were immediately analyzed by flow cytometry with the HyperCyt platform.
MFI measurements from control wells were also used to calculate a Z′ factor for each assay. The Z′ factor is a measure of screening assay quality that reflects both assay signal dynamic range and data variation associated with the signal measurements (Zhang et al., 1999). The Z′ factor for 268 plates analyzed in this and other studies was 0.62 ± 0.16 (mean ± S.D.).
Chemical Diversity Laboratories compounds were provided as 10 mM stock solutions in DMSO and were diluted in assay dilution buffer (110 mM NaCl, 30 mM HEPES, 10 mM KCl, 1 mM MgCl2, 10 mM glucose, and 0.1% bovine serum albumin) to a final screening concentration of 67 μM with 1% DMSO. fMLFF (4PeP blocked control) and fMLFK-FITC peptides were used at final concentrations of 150 and 1.5 nM, respectively. A starting cell stock of 107 cells/ml (in assay dilution buffer) was diluted 1:3 in the final assay mixture (∼3.3 × 10⁶ cells/ml, 15-μl total volume). This resulted in analysis of ∼2500 cells from each well when sampling at 40 wells/min (aspirated sample volume, ∼2 μl) with HyperCyt.
The best flow cytometry sampling and analysis results are obtained with uniform cell suspensions. Significant cell settling may occur after 5 to 10 min in undisturbed wells (Ramirez et al., 2003). To minimize cell settling, test cells and fluorescent peptide ligand were added quickly (1-2 min) under automated control of a Titertek MAP-C liquid dispensing system. Specialized 96-well microplates were used (Greiner Imp@ct plate; Intermountain Scientific/BioExpress, Kaysville UT) that allowed retention of samples in wells (by surface tension) when the microplates were inverted. To maintain uniform cell suspensions during the two 4°C incubations, microplates were placed on a rotating cell suspension system device (in a refrigerator) that continuously rotated them between upright and inverted positions at 4 RPM (Ramirez et al., 2003). HyperCyt sampling was completed in less than 3 min.
HyperCyt. The HyperCyt platform (Kuckuck et al., 2001; Ramirez et al., 2003) interfaces a flow cytometer and autosampler. As the sampling probe of the autosampler moves from one well to the next of a multiwell microplate, a peristaltic pump sequentially aspirates sample particle suspensions from each well. Between wells, the continuously running pump draws a bubble of air into the sample line. This results in the generation of a tandem series of bubble-separated samples for delivery to the flow cytometer. Sample and bubble volumes are determined by the time that the autosampler probe is in a microplate well or above a well intaking air. We have validated cell-based high throughput endpoint assays for ligand binding, surface antigen expression, and immunophenotyping (Ramirez et al., 2003).
Sample fluorescence was excited with a laser at 488 nm in a FACScan flow cytometer (BD Biosciences, San Jose, CA). The assay response data were measured in the FL1 green fluorescence emission channel (515-545 nm). The FL3 red fluorescence emission channel (>650 nm) was used for detection of Cytoplex L9 or L10 beads (Duke Scientific, Palo Alto, CA) that were added to a subset of wells to facilitate proper registration of flow cytometry data with source wells.
Some test compounds were inherently fluorescent when exposed to the 488 nm laser line, emitting fluorescence in the FL1 channel that compromised the assay's ability to detect effects of the compound upon binding of the green-fluorescent fMLFK-FITC ligand. To analyze such compounds, we modified the assay as described previously (Young et al., 2005) to use a hexapeptide FPR ligand (fNleLFN-leYK, Kd ∼ 30 nM) tagged with Alexa-633, a fluorescent probe excited by the red diode laser (excitation at 635 nm) of a FACSCalibur flow cytometer (BD Biosciences). Assay response data were then measured in the FL4 red fluorescence channel (>670 nm).
HyperCyt Data Analysis. In the HyperCytplatform, the air bubble-separated samples are delivered in a continuous stream to the flow cytometer. Likewise, the data are collected in a continuous stream, the accumulated data from all wells of a microplate representing a single data file. The time-resolved data, with periodic gaps corresponding to the passage of the sample-separating air bubbles, were analyzed by proprietary software (IDLeQuery). The program automatically detects the time-resolved data clusters, ensures that there are 96, and analyzes each to determine the MFI of bound peptide. These reduced data are automatically exported to an Excel (Microsoft Corp., Redmond, WA) spreadsheet template that immediately calculates the assay quality control Z′ factor and peptide binding inhibition percentage for each well. Thus, comprehensive assay results are available within 1 to 2 min after assay plate sampling is completed. Because each sample consists of 2 μl taken from a 15-μl volume in each well, we routinely sampled and analyzed each plate twice and averaged the results in the Excel spreadsheet.
Ki Determinations. Ligand competition curves were fit by nonlinear least-squares regression using a one-site competition model with Prism software (GraphPad Software, Inc., San Diego, CA) to determine the concentration of added competitor that inhibited fluorescent ligand binding by 50% (IC50). FPR expression ranged from 100,000 to 400,000 receptors per cell in different assays as determined by comparison with standard curves generated with Fluorescein Reference Standard Microbeads (Bangs Laboratories, Fishers, IN). This corresponded to total FPR concentrations of 0.6 to 2.2 nM. To account for effects of ligand depletion at the higher receptor concentrations, Ki values were calculated from the IC50 by the method of Munson and Rodbard (1988), Ki = Kd × [y0/(y0 + 2)] + IC50/{1 + [p* × (y0 + 2)]/[2 × Kd × (y0 + 1)] + y0}, in which y0 is the initial bound-to-free concentration ratio for the fluorescent ligand, p* is the added concentration of fluorescent ligand (1.5 nM), and Kd is the dissociation constant of the fluorescent ligand (3 nM).
Intracellular Ca2+ Measurements. As described previously (Young et al., 2004), 107 cells are resuspended in 10 ml of warm medium containing 200 nM Fluo4 acetoxymethyl ester (Invitrogen) and incubated at 37°C for 30 min, with mixing every 10 min. After incubation, cells are washed twice by centrifugation and resuspended in complete HH buffer [110 mM NaCl, 30 mM HEPES, 10 mM KCL, 1 mM MgCl2, 10 mM glucose, and 0.1% (v/v) human serum albumin, and 1.5 mM CalCl2]. Cells are exposed to a range of compound concentrations to determine temporal (0-10 min) effects upon green Fluo4 fluorescence intensity of cells. A dose-response curve compares peak fluorescence intensities at each compound concentration.
To assess the ability of test compounds to block formylpeptide-induced Ca2+ responses, DeltaST cells (1 × 10⁶/ml) were incubated with and without the compound (final concentration, 100 μM) for 30 min on ice. Cells were warmed for 5 min and analyzed for 20 s using a FACScan flow cytometer to establish a baseline; then, fML peptide (2PeP) was manually added to a final concentration of 50 nM, and the analysis was reinitiated. Cells were also stimulated by addition of ATP (final concentration, 1 μM) to evaluate compound effects upon detection of a Ca2+ response unrelated to FPR ligation.
Cell Adhesion Assays. Cell adhesion assays were performed essentially as described previously (Chigaev et al., 2003) to assess FPR-activated VLA4-dependent adhesion of DeltaST cells to VCAM-1 expressed on B78H1-VCAM1 cells. DeltaST cells were loaded with red-fluorescent Fura-Red and B78H1-VCAM1 cells with green-fluorescent 5-(and 6-)-carboxyfluorescein diacetate succinimidyl ester (both dyes from Invitrogen) and maintained on ice until the experiment. Three hundred microliters of DeltaST cells (1 × 10⁶ cells/ml) and 300 μl of B78H1-VCAM cells (3 × 10⁶ cells/ml) were incubated separately for 5 min at 37°C in the presence or absence of test compounds (100 μM final). Cells were then combined and analyzed in the flow cytometer, during which time the cell suspension was continuously stirred at 300 rpm and 37°C with a magnetic microstirbar. After 90 s of stirring to establish basal levels of cell adhesion, fMLFF (4PEP) was added to a final concentration of 10 nM, and the analysis was reinitiated to determine the increase in adhesion promoted by FPR ligation. Otherwise, to assess possible nonspecific compound effects on adhesion, adhesion was activated by addition of MnCl2 to a final concentration of 1 mM. DeltaST cells were resolved into two fractions in the flow cytometer: singlets (events that were uniformly red fluorescent) and conjugates (red/green cofluorescent events containing red fluorescent DeltaST cells adherent to green fluorescent B78H1-VCAM1 cells). At each indicated time point, the percentage of adherent DeltaST cells was calculated as 100 × (number of conjugates)/(number of conjugates + number of singlets).
Results
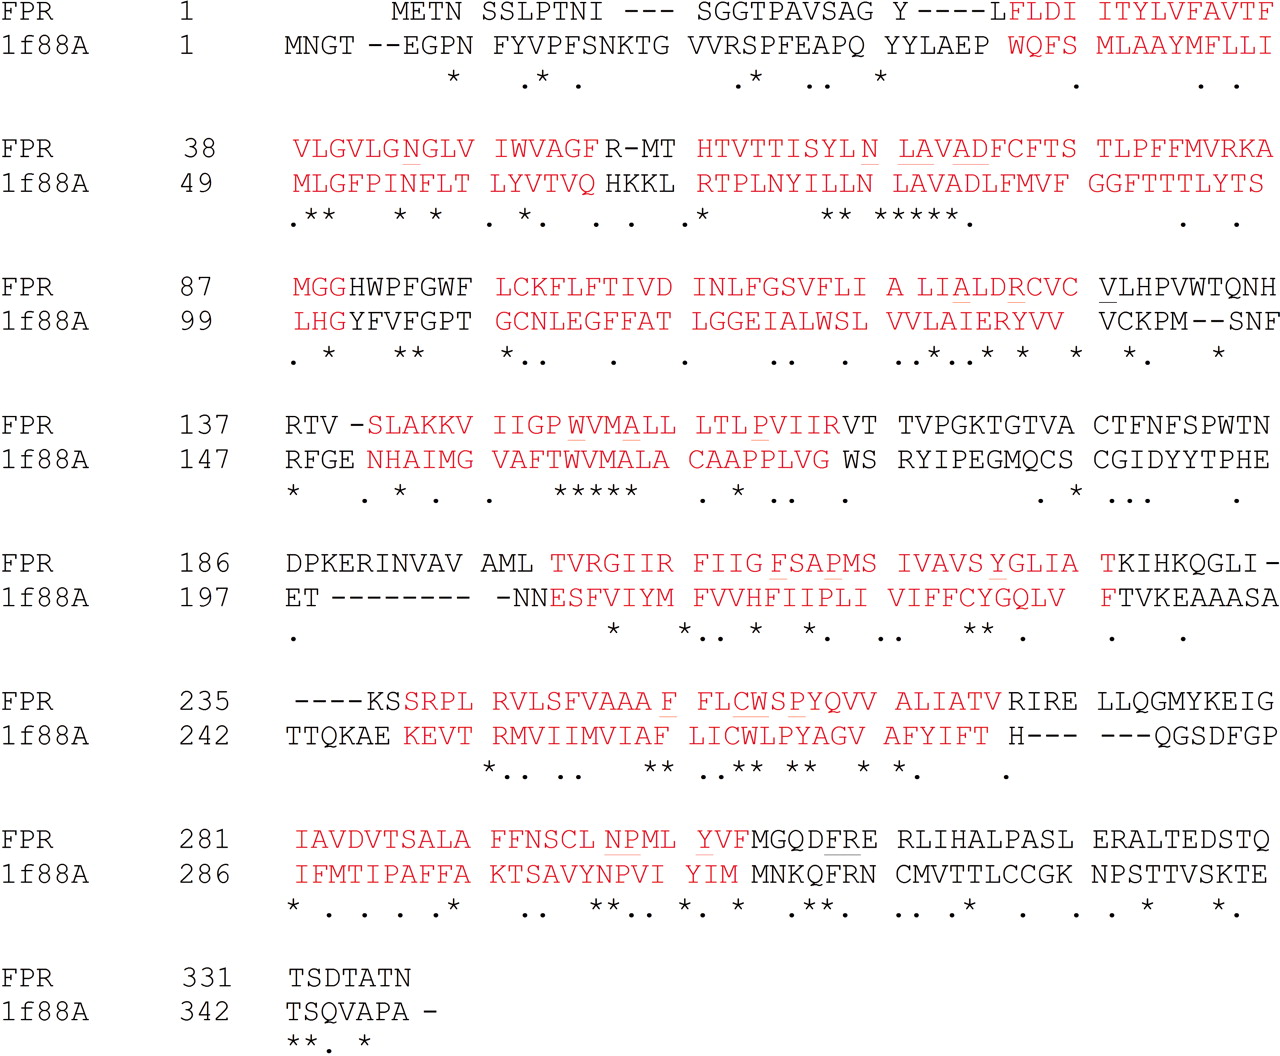
FPR Homology Model: Applicability and Limitations. Data from cross-linking and mutagenesis studies suggest that the FPR ligand binding site is located between the transmembrane helices, near the extracellular face of the membrane (Mills et al., 2000). The crystal structure of bovine rhodopsin (Protein Data Bank code 1F88) was used as starting point for binding site modeling. The FPR and bovine rhodopsin sequences were aligned using T-Coffee package (Notredame et al., 2000), and manual corrections were made to avoid insertions/deletions in any α helix (Fig. 1). A homology model of the FPR seven transmembrane α-helices was then generated using SWISS-MODEL (Schwede et al., 2003) and further refined using the AMBER (Pearlman et al., 1995) force field (Fig. 2, A and B). We assumed that no significant induced fit effects occur upon the binding and that the receptor is rigid to a good approximation. The FPR homology model relied on primary sequence alignment tools (e.g., T-Coffee), which in themselves are good tools but not reliable predictors for transmembrane domain relative positioning, helix kinks, etc. One must always be conscious of the “highly conserved residues” (Baldwin et al., 1997), which require manual insertions/deletions of residues that occur in the transmembrane domains. To illustrate such shortcomings, we had to manually modify torsion angles in the Arg205 side chain and to force a salt-bridge interaction with Asp106; all other side chains were geometry-optimized using AMBER. At this stage, the FPR homology model was used for the pharmacophore model construction.
Pharmacophore Identification. Known agonists and antagonists were docked into the binding site of the model receptor using Autodock (Morris et al., 1998) (Fig. 2C), and a pharmacophore model was derived based on the docking results. The basis of the pharmacophore concept is that all ligands, regardless of chemical structure, bind in conformations that present similar steric and electrostatic features to the receptor—features that are recognized at the receptor site and are responsible for the biological activity (Güner, 2000). Built on the active analog approach of Marshall et al. (1979), pharmacophore methods require a computationally or experimentally derived ligand structure (or series) that can provide a reasonably good definition of bioactivity requirements (Beusen and Marshall, 2000). Most of the pharmacophore perception methods are incorporated in commercially available software and discussed in a book edited by Osman Güner (Güner, 2000).

The sequence alignment of the formyl-peptide receptor with bovine rhodopsin (PDB code 1F88). Red, α-helices; underline, highly conserved residues in the GPCR family of receptors [*4]; *, identical residues; •, similar residues.
To derive the antagonist pharmacophore model, we analyzed the following four ligands: thiazolyl-ureido-Phe-d-Leu-Phe-d-Leu-Phe (Dalpiaz et al., 2002), iso-butyloxycarbonyl-Met-Leu-Phe (Derian et al., 1996), cyclosporin H (Loor et al., 2002), and phenylbutazone (Nelson et al., 1981). These four ligands were docked at the same time as two agonists, formyl-Met-Leu-Phe and formyl-Met-Met-Trp-Leu-Leu, into the FPR homology model. The extracellular region of the seven transmembranes was considered the primary area of molecular recognition for antagonists, whereas the formylated moiety of the agonists (crucial for activity) was docked deeper into the transmembrane region. The top 20 conformers were selected for each of the four antagonists and were used to derive the pharmacophore model. Figure 2C shows a single low-energy conformation for the two agonists, formyl-Met-Leu-Phe and formyl-Met-Met-Trp-Leu-Leu, and two antagonists, iso-butyloxycarbonyl-Met-Leu-Phe and phenylbutazone. These results seem to indicate that the agonist- and antagonist-binding site overlap only in part.
Once the 80 conformers were overlapped into the FPR antagonist binding site, the final pharmacophore was generated after visual inspection by identifying two acceptors and one hydrophobe point common to most of them (Fig. 2D). Distance tolerances between the two acceptors were 3 to 6 Å, and 4 to 7 Å and 5 to 7 Å, respectively, between the acceptors and the hydrophobe point. The key feature of this model was the addition of 23 exclusion spheres (i.e., sterically forbidden zones). Although the pharmacophore as such could have been derived in the absence of the receptor, the addition of the exclusion spheres could not have been done without the FPR homology model. Thus, although we consider this primarily a ligand-based virtual screening (LBVS) effort, we have used as much information about the target (FPR) as possible.

Computational modeling of the FPR and FPR ligands. Illustrated at top are hypothesized structures in the FPR homology model for transmembrane helices only (A) and residues 1 to 337 of the FPR (B). C, docking of known agonists and antagonists into the binding site of the model receptor. Illustrated are binding modes of two agonists (red) and two antagonists (blue) as predicted by Autodock. D, three-point pharmacophore model for FPR antagonists. Analysis of 80 conformers (20 from each of two agonists and two antagonists) identified two acceptors (red) and one hydrophobe point (blue) common to most. Distance tolerances between the acceptors and the hydrophobe point and between the two acceptors were 5 to 7 Å, 3 to 6 Å, and 4 to 7 Å, respectively. A key feature of this model was the addition of 23 exclusion spheres (i.e., sterically forbidden zones) (white lattice structures).
LBVS Using the Pharmacophore Model. The LBVS query relied on a pharmacophore model (two H-bond accepting centers, a hydrophobic area, and 23 excluded spheres) derived from receptor-induced ligand conformations, to which additional restrictions were added. The XCGen program (http://www.chemosoft.com) was used to perform a guided pharmacophore constrained structure-based screening strategy. XCGen performs a systematic grid search with some additions/corrections accounting for experimentally known stereochemical preferences of molecular fragments, molecular mechanics constraints, and 3D pharmacophore geometry constraints. Exploration of conformers is therefore biased to those maximally matching the pharmacophore hypothesis, and the algorithm examines large numbers of putative ligand-receptor orientations, enabling the theoretical match of novel chemotypes.

Chemical diversity library compounds with FPR ligand binding activity. *, groups represent distinct chemotypes, the specific characteristics of which are described elsewhere (Oprea et al., 2005).
The XCGen program generated conformations using standard stereochemical rules and molecular mechanics refinements. These conformers served as starting points for iterative modification of molecular geometry to improve the fit with the pharmacophore. It is noteworthy that XCGen did not find a pharmacophore match for over 100,000 compounds from the ChemDiv library. It is quite likely that these compounds are not active against FPR. The best-fitting 4234 compounds were selected for further HTFC screening.
HTFC Screening of the FPR-Focused Compound Collection. The 4324 compounds identified by LBVS were subsequently screened in the HTFC FPR ligand binding assay. We found 95 hits (2.2%) that showed some inhibition in the primary assay, 52 of which (1.2%) were confirmed hits averaging ≥65% inhibition, and 30 (0.7%) had Ki values ranging from 1 to 32 μM (Fig. 3). These compounds represented nine chemically distinct groups (Fig. 3, groups A-F and H-J). There was one additional active compound from a tenth chemically distinct group (group G), but the Ki was relatively large (49 μM), and it was not investigated further. Key characteristics of the chemical groups have been described elsewhere (Oprea et al., 2005).
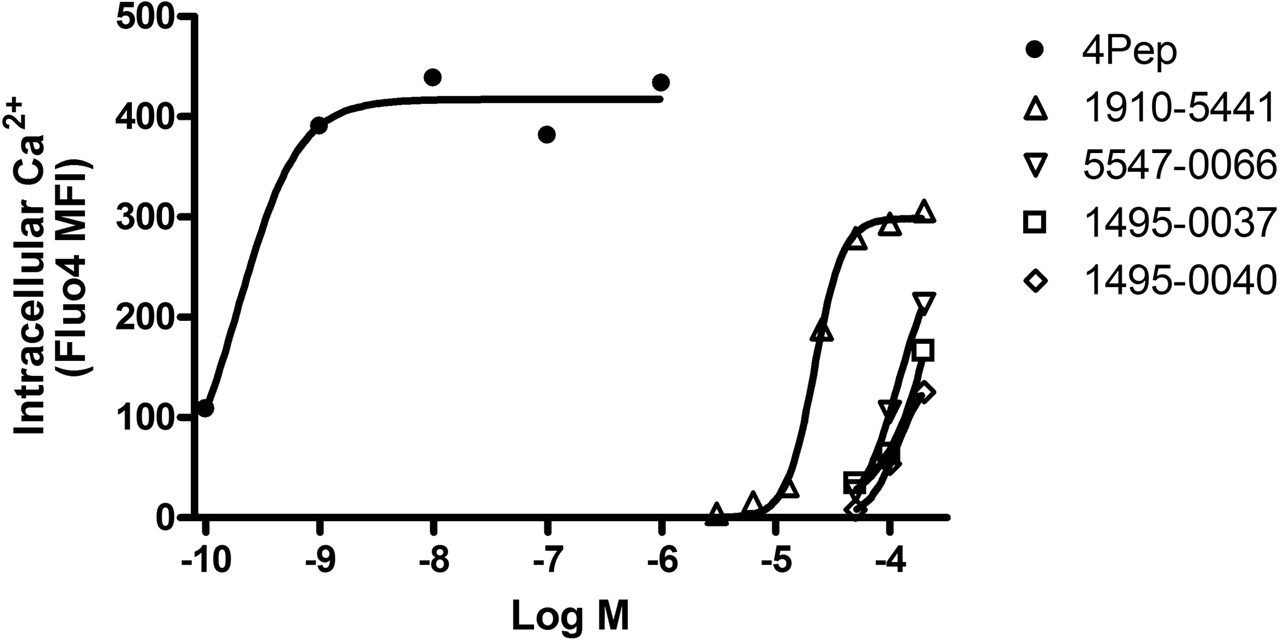
Secondary Screening for Agonist Activity. A hallmark of FPR agonist activity is a rise in intracellular Ca2+ concentration. A subset of 17 compounds with the lowest measured Ki (≤10 μM) was therefore evaluated for the ability to elicit intracellular Ca2+ responses in DeltaST cells. Compound 1910-5441 from group A was identified to be a weak partial agonist. Partial agonist activity was indicated by elevation of intracellular Ca2+ concentration to a plateau level that was only ∼75% of that elicited by the high-affinity agonist, fM-LFF (Fig. 4). The effective concentration that elicited 50% of the maximal Ca2+ response (EC50) was ∼20 μM. By comparison, the EC50 of fMLFF was ∼0.2 nM. Other group A compounds also exhibited agonist activity when tested at concentrations of 50 μM or more (Fig. 4). This was commensurate with the higher Ki values of these compounds in ligand competition assays (4-10 μM) compared with 1910-5441 (1 μM). Compounds from the other groups were inactive in Ca2+ response assays at concentrations up to 200 μM (data not shown). Therefore, compounds from all but group A were antagonists, in concert with predictions of the computational model used for virtual screening.
Secondary Screening to Confirm Antagonist Activity. To confirm that compounds exclusive of group A were antagonists, representative compounds from each group were assessed for the ability to inhibit Ca2+ responses induced by an FPR agonist. In the absence of test compounds, the peptide fML (2PeP) promoted a rapid increase in Fluo4 fluorescence intensity, indicative of elevated intracellular Ca2+, that peaked within 5 to 10 s of 2PeP addition (Fig. 5, A-C). This response was abrogated in the presence of representative compounds from groups D, E, and H (Fig. 5, A-C). By contrast, the cell Ca2+ response to addition of ATP was unaffected by the presence of any of the compounds (Fig. 5, A-C), an indication that the 2PeP results were not attributable to nonspecific effects of the compounds upon Fluo4 fluorescence or Ca2+ responses triggered by an FPR-independent pathway. Similar results were obtained with compounds from groups B, C, F, I, and J (Supplemental Figs. 6 and 7, available online).

Agonist activity of group A compounds. Group A compounds were compared with a high-affinity FPR agonist (4PeP, •) for the ability to elicit elevation of intracellular Ca2+ ion concentration in DeltaST cells. Compound 1910-5441 (▵) had an EC50 of ∼20 μM and a plateau response ∼75% of that elicited by 4PeP. Compounds 5547-0066 (▿), 1495-0037 (□), and 1495-0040 (⋄) also elicited responses at higher concentrations but full dose response curves could not be generated because of nonspecific effects of DMSO solvent at compound concentrations >200 μM. None of these compounds promoted Ca2+ responses in parental U937 cells that lacked FPR (data not shown).
To further verify antagonist activity, compounds were tested for the additional ability to block cell adhesion responses stimulated by FPR ligation. Consistent with results of previous studies (Chigaev et al., 2003), ligation of FPR with fMLFF (4PeP) promoted an increase in VLA4-dependent adhesion of DeltaST cells to human VCAM-1 expressed on B78H1-VCAM1 cells (Fig. 5, D-F). The adhesion response to 4PeP was blocked in the presence of compounds from groups D, E, and H (Fig. 5, D-F). MnCl2, which promotes VLA4/VCAM-1 adhesion by an alternative FPR-independent mechanism, triggered an adhesion response in the presence of compounds that was at most only marginally less than what was observed in their absence (Fig. 5, D-F). Adhesion responses to both 4PeP and MnCl2 were mediated by VLA4, as indicated by inhibition of adhesion in the presence of a peptide that directly blocked the VLA4 binding site (Chigaev et al., 2003 and data not shown). Thus, these compounds as well as representative compounds from the five other putative antagonist groups (data not shown) exhibited antagonist activity for FPR-dependent adhesion responses.
Discussion
In this article, we illustrate how ligand-based virtual screening can be combined with high-throughput physical screening to identify novel ligands for a target with unknown structure. We considered this approach in particular because the FPR homology model(s), although useful in a qualitative sense, represent an unquantifiable departure from reality. However, this limitation proved useful in generating volume restrictions for the pharmacophore model (Fig. 2D). Data from cross-linking and mutagenesis studies suggest that the FPR ligand binding site is located between the transmembrane helices, near the extracellular face of the membrane (Mills et al., 2000). Several weak micromolar binders (phenylbutazone and related pyrazolidinedione drugs) and strong nanomolar binders: cyclosporins and formylpeptide derivatives had been described previously (Dalpiaz et al., 2002; Bae et al., 2003). This information was integrated to generate a novel combined FPR model/pharmacophore model that we then used as a basis for virtual screening to identify a highly focused subset of compounds likely to contain FPR antagonists.
In our previous physical screening of the Prestwick Compound Library (880 molecules) with the HyperCyt platform, we detected one true hit, a phenylbutazone derivative with Ki ∼ 14 μM, and one false positive with nonspecific activity (Young et al., 2005). This represented a hit frequency of 0.1%, typical of a random collection of compound structures. In the present study, integration of virtual screening with Hyper-Cyt screening resulted in 52 confirmed hits for a 12-fold improvement in hit frequency. After secondary dose-response studies, we found 17 of the 52 (33%) to have Ki ≤ 10 μM. The active compounds represented nine distinct chemotype groups (Fig. 3). Compounds from eight groups were confirmed to be antagonists of FPR-dependent Ca2+ and cell adhesion responses (Fig. 4). Compounds from the remaining group (group A) were shown to act as partial FPR agonists in Ca2+ response assays (Fig. 4). The active compounds match within 1-Å tolerance the pharmacophore shown in Fig. 2D (data not shown). Two examples, from chemotype groups A (1495-0037; Ki = 10 μM) and E (1682-2108; Ki = 6 μM), are depicted in Fig. 6. Although the pharmacophore has the same orientation in the illustration, it is apparent that the two molecules overlap well at the pharmacophore feature level only (i.e., other features are not assigned the same orientation). Given the level of bioactivity (1-10 μM) of these compounds, further attempts to improve the overlap between these molecules are not necessary, because the level of bioactivity does not warrant the precision of such calculations.
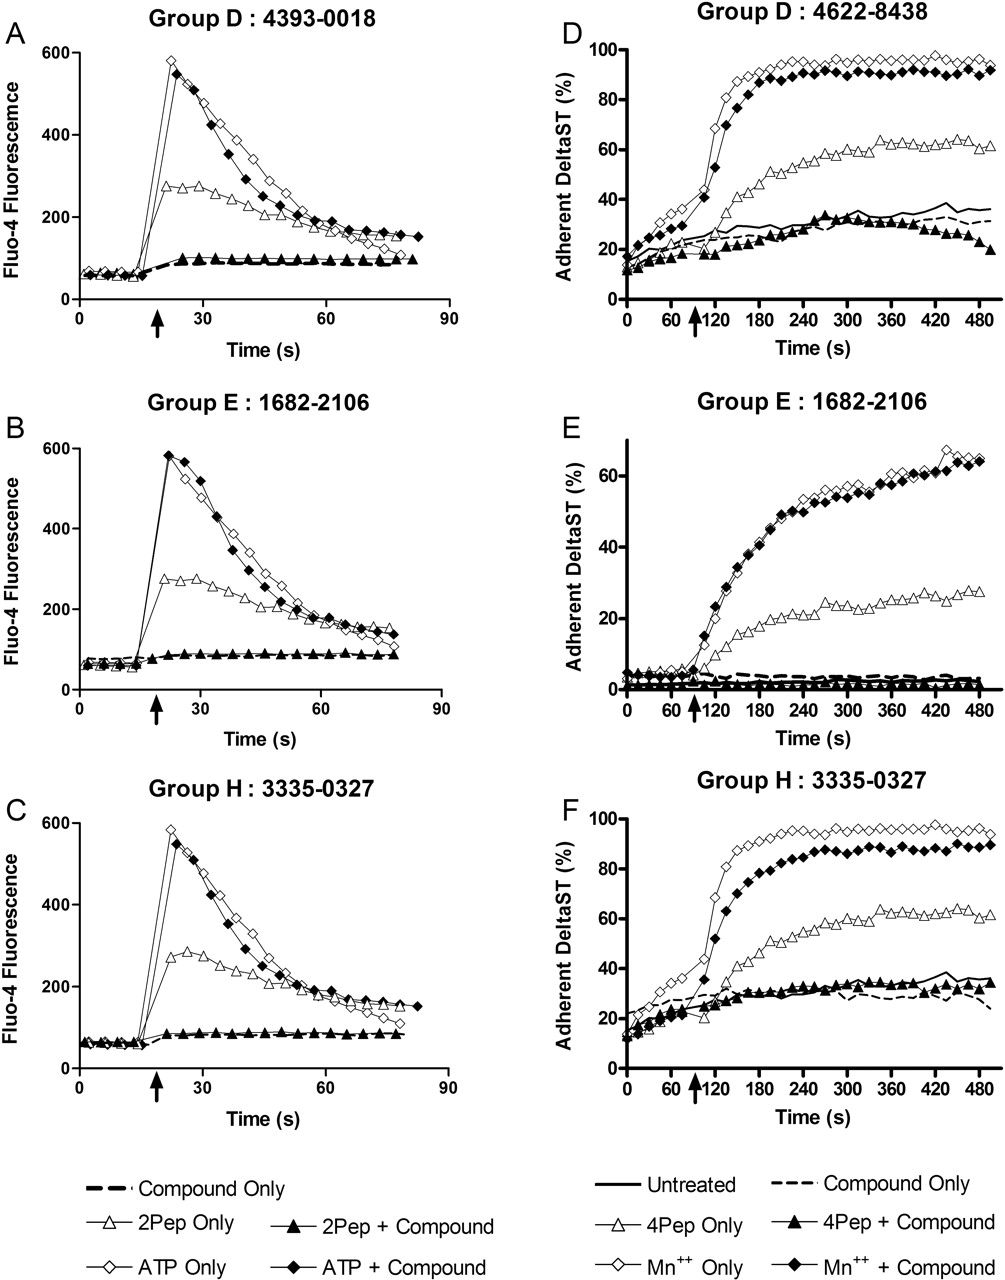
Confirmation of antagonist activity in Ca2+ response and cell adhesion assays. DeltaST cells loaded with the fluorescent intracellular Ca2+ probe Fluo4 were preincubated in the absence (open symbols) or presence (filled symbols or dashed line) of active compounds (100 μM final concentration), then analyzed in the flow cytometer to assess temporal fluorescence intensity responses to addition of 50 nM formylpeptide fML (2PeP, triangles), 1 μM ATP (diamonds), or no stimulus (dashed line). Results are representative of two or more assays performed with compounds from groups D (A), E (B), and H (C). DeltaST cells labeled with red-fluorescent FuraRed were combined in stirred suspensions with B78H1-VCAM1 cells labeled with green-fluorescent CFSE to assess VLA4-dependent adhesion of DeltaST cells to B78H1-VCAM1 cells in the flow cytometer. Cells preincubated in the absence or presence of compounds (100 μM final concentration) are indicated as in the Ca2+ response assays. After 90 s of preliminary analysis, 10 nM fMLFF (4PeP, triangles), 1 mM MnCl2 (diamonds), or no stimulus (dashed and solid lines without symbols) was added, and subsequent effects upon the percentage of adherent DeltaST cells measured. Illustrated are results obtained with representative compounds from groups D (D), E (E), and H (F). Compounds from groups B (6359-0291), C (C119-0054), F (6049-0473), I (4393-0018), and J (4358-1479) were also tested in both Ca2+ response and cell adhesion assays with similar results (Supplemental Figs. 6 and 7, available online).
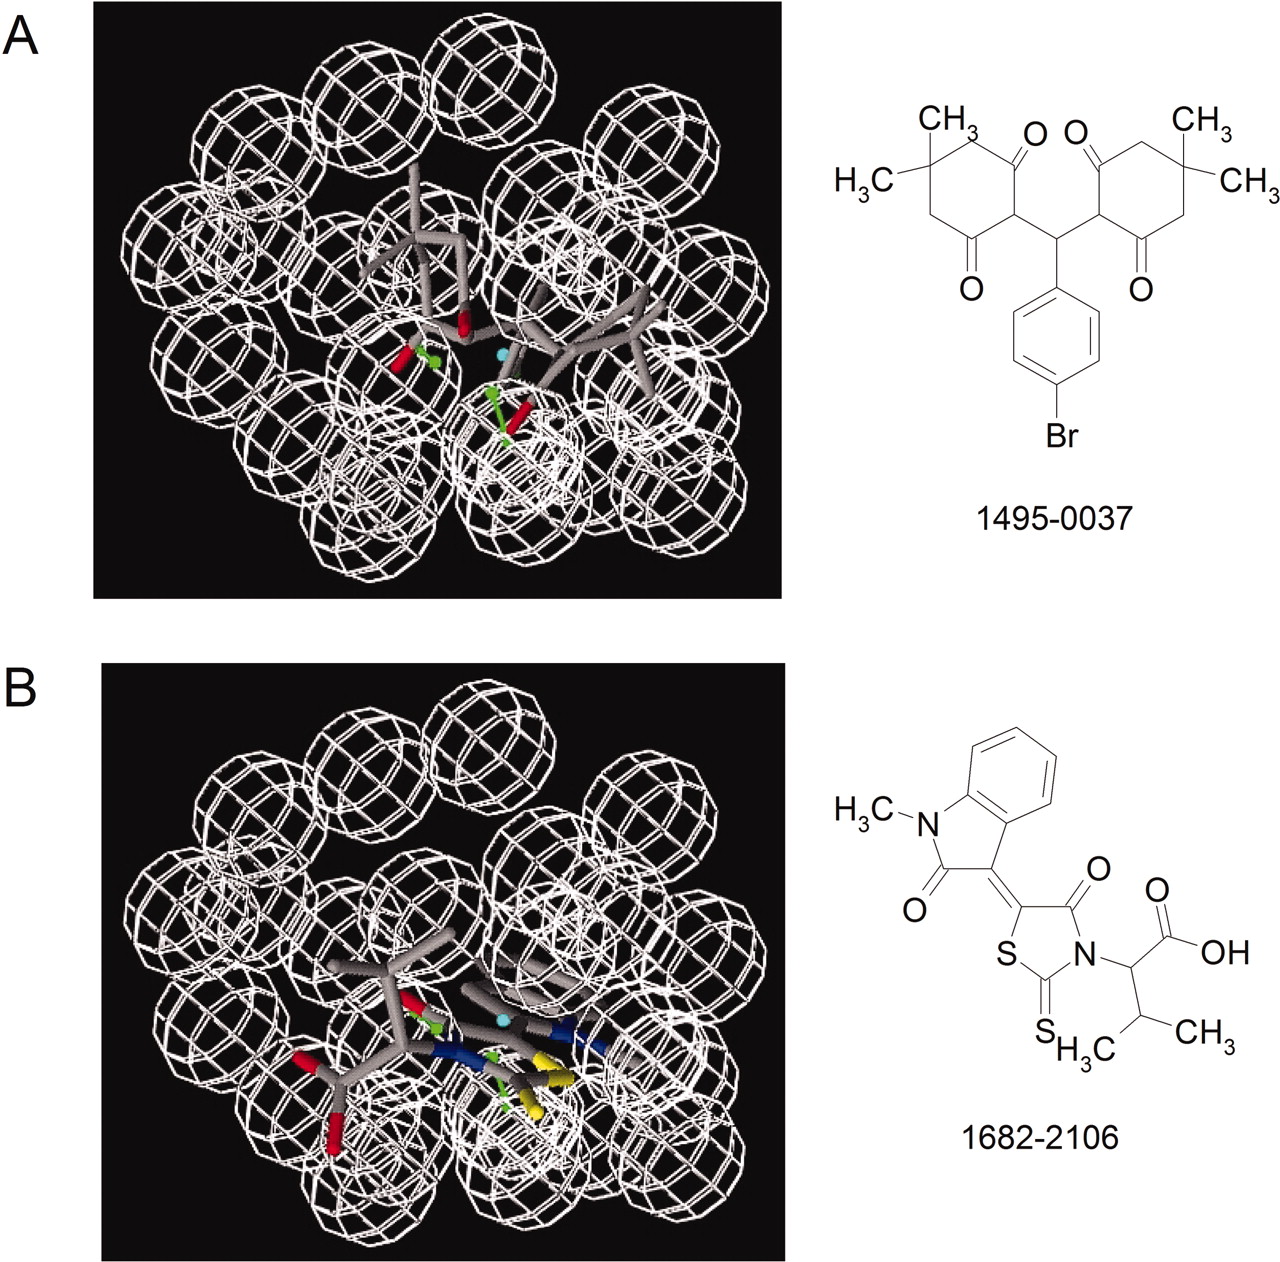
Pharmacophore matching for two confirmed hits from the A (top) and B (bottom) chemotype families.
This and previous studies (Young et al., 2005) demonstrate the HyperCyt platform for HTFC screening to be a robust, sensitive, and highly quantitative method with which to screen lead compound libraries in a 96-well format. This screening approach allows high throughput ligand-binding assays to be performed in a no-wash homogeneous format that would not be feasible with conventional fluorescence plate-readers, a reflection of the superior ability of the flow cytometer to distinguish bound ligand in the presence of unbound fluorescent ligand. Moreover, HyperCyt HTFC is presently amenable to miniaturization down to total assay volumes as small as 8 μl/well, from which sample volumes of 2 μl are routinely sufficient for ligand binding analysis, as demonstrated in the present study. It is also noteworthy that this physical screening approach is capable of detecting compounds with Ki values up to the 40 to 50 μM range, minimizing the likelihood of missing novel lead compounds that might be amenable to chemical optimization.
All FPR hits were categorized by chemotype: the 9 families having 52 confirmed hits were prioritized using an empirical evaluation scheme, described elsewhere (Oprea et al., 2005). In brief, we awarded negative scores whenever the chemotype 1) was already present in publications or patents or 2) tested positive in toxicity-related experiments. Positive scores were awarded for higher FPR activity, for testing negative in toxicity-related literature, and for good overlap when profiled against drug-related properties (Oprea, 2000). Based on this analysis, three chemotypes have been selected for further experiments.
In this study, a combination of virtual and physical screening enabled discovery of a series of chemotypes with higher FPR activity than any previously reported noncyclosporin drugs. Thus, in the absence of precise 3D structural information for a GPCR, modeling based on rhodopsin homology and appropriate pharmacophore selection can significantly augment screening efficiency for detection of active compounds.
Acknowledgments
Technical and instrument support was provided by the Shared Flow Cytometry Resource in the University of New Mexico Cancer Research and Treatment Center. Software and hardware support were provided by the Division of Biocomputing at the University of New Mexico Health Sciences Center.
Footnotes
-
This work was supported in part by National Institutes of Health grants AI48517, R24-GM60799 (now EB00264), and R24-CA88339, by the University of New Mexico Cancer Research and Treatment Center, and by New Mexico Tobacco Settlement funds for Biocomputing.
-
Article, publication date, and citation information can be found at http://molpharm.aspetjournals.org.
-
doi:10.1124/mol.105.014068.
-
ABBREVIATIONS: FPR, formylpeptide receptor; HTFC, high-throughput flow cytometry; GPCR, G protein-coupled receptor; 3D, three-dimensional; FITC, fluorescein isothiocyanate; fMLFK, formylmethionine-leucine-phenylalanine-lysine; fMLFF or 4PeP, formylmethionine-leucine-phenylalanine-phenylalanine; fML or 2PeP, formylmethionine-leucine; fNleLFNleYK, formylnorleucine-leucine-phenylalanine-norleucine-tyrosinelysine; MFI, median fluorescence intensity; DMSO, dimethyl sulfoxide; LBVS, ligand-based virtual screening; 1495-0037, 2-((4-bromophenyl)(2-hydroxy-4,4-dimethyl-6-oxocyclohex-1-enyl)methyl)-3-hydroxy-5,5-dimethylcyclohex-2-enone; 1495-0040, 3-hydroxy-2-((2-hydroxy-4,4-dimethyl-6-oxocyclohex-1-enyl)(3-nitrophenyl)methyl)-5,5-dimethylcyclohex-2-enone; 1682-2108, (Z)-2-(5-(5-(5-bromo-2-oxindolin-3-ylidene)-4-oxo-2-thioxothiazolidin-3-yl)-3-methylbutanoic acid; 1910-5441, 2-((3-(benzyloxy)phenyl)(2-hydroxy-4,4-dimethyl-6-oxocyclohex-1-enyl)methyl)-3-hydroxy-5,5-dimethylcyclohex-2-enone; 4358-1479, ethyl 4-(cyclohexylamino)-6-methoxyquinoline-3-carboxylate; 4393-0018, 6-(2-(2,5-dimethoxyphenyl)-3-(4-fluorobenzoyl)-4-hydroxy-5-oxo-2H-pyrrol-1(5H)-yl)hexanoic acid; 5547-0066, 4-(bis(2-hydroxy-4,4-dimethyl-6-oxocyclohex-1-enyl)methyl)-2-ethoxyphenyl 3-methoxybenzoate; 6049-0473, 3-((3-(ethoxycarbonyl)-5,6,7,8,9,10-hexahydro-4H-cyclonona[b]-thiophen-2-yl) carbamoyl)-7-(propan-2-ylidene)bicyclo[2.2.1]heptane-2-carboxylic acid; 6359-0291, 4-(4-chlorophenyl)-7,7-dimethyl-2-phenyl-7,8-dihydro-2H-pyrazolo[3,4-b]quinolin-5(4H,6H,9H)-one; C119-0054, 3-(2-(ethylthio)ethyl)6-methyl 4-(4-(dimethylamino)phenyl)-2,7-dimethyl-5-oxo-1,4,5,6,7,8-hexahydroquinoline-3,6-dicarboxylate.
-
↵s⃞ The online version of this article (available at http://molpharm.aspetjournals.org) contains supplemental material.
- Received April 21, 2005.
- Accepted August 10, 2005.
- The American Society for Pharmacology and Experimental Therapeutics


