


Abstract
Vascular pathology is increased in diabetes because of reactive-oxygen-species (ROS)-induced endothelial cell damage. We found that in vitro and in a streptozotocin diabetes model in vivo, metformin at diabetes-therapeutic concentrations (1–50 µM) protects tissue-intact and cultured vascular endothelial cells from hyperglycemia/ROS-induced dysfunction typified by reduced agonist-stimulated endothelium-dependent, nitric oxide–mediated vasorelaxation in response to muscarinic or proteinase-activated-receptor 2 agonists. Metformin not only attenuated hyperglycemia-induced ROS production in aorta-derived endothelial cell cultures but also prevented hyperglycemia-induced endothelial mitochondrial dysfunction (reduced oxygen consumption rate). These endothelium-protective effects of metformin were absent in orphan-nuclear-receptor Nr4a1-null murine aorta tissues in accord with our observing a direct metformin-Nr4a1 interaction. Using in silico modeling of metformin-NR4A1 interactions, Nr4a1-mutagenesis, and a transfected human embryonic kidney 293T cell functional assay for metformin-activated Nr4a1, we identified two Nr4a1 prolines, P505/P549 (mouse sequences corresponding to human P501/P546), as key residues for enabling metformin to affect mitochondrial function. Our data indicate a critical role for Nr4a1 in metformin’s endothelial-protective effects observed at micromolar concentrations, which activate AMPKinase but do not affect mitochondrial complex-I or complex-III oxygen consumption rates, as does 0.5 mM metformin. Thus, therapeutic metformin concentrations requiring the expression of Nr4a1 protect the vasculature from hyperglycemia-induced dysfunction in addition to metformin’s action to enhance insulin action in patients with diabetes.
SIGNIFICANCE STATEMENT Metformin improves diabetic vasodilator function, having cardioprotective effects beyond glycemic control, but its mechanism to do so is unknown. We found that metformin at therapeutic concentrations (1–50µM) prevents hyperglycemia-induced endothelial dysfunction by attenuating reactive oxygen species–induced damage, whereas high metformin (>250 µM) impairs vascular function. However, metformin’s action requires the expression of the orphan nuclear receptor NR4A1/Nur77. Our data reveal a novel mechanism whereby metformin preserves diabetic vascular endothelial function, with implications for developing new metformin-related therapeutic agents.
Introduction
Metformin, which was first used clinically in the late 1950s, remains a drug of first choice for type-2 patients with diabetes. In contrast with many newer therapeutic diabetes drugs, metformin was not designed for a specific cellular therapeutic target. Rather, its development came from observations that French lilac (Galega officinalis)-derived guanidines could treat “sweet urine” disease. However, the therapeutic mechanisms whereby biguanides work clinically are still unclear. It is known that metformin has a number of targets that contribute to its clinical effectiveness apart from its facilitation of insulin action and lowering blood glucose (Nafisa et al., 2018). Indeed, in the treatment of type-2 diabetes, metformin has been shown to have cardioprotective effects independent of its glycemic control effect (Lexis et al., 2014; Driver et al., 2018).
Of note for the data we present are metformin’s beneficial cardiovascular effects due largely to its ability to protect the vascular endothelium from hyperglycemia-induced dysfunction (Mather et al., 2001; Kinaan et al., 2015; Triggle and Ding, 2017; Ding et al., 2019; Zilov et al., 2019). This dysfunction is attributed to hyperglycemia-generated reactive oxygen species (ROS) that compromises endothelial function (Brownlee, 2001; Shah and Brownlee, 2016). To date, the cellular effects of metformin have been commonly attributed to the inhibition of mitochondrial complex I (El-Mir et al., 2000; Owen et al., 2000), resulting in the activation of AMPKinase (AMPK). AMPK in turn is believed to mediate many of the actions of metformin, including the reduction of cholesterol synthesis (Carling et al., 1987, 1989; Lee et al., 2010) and the enhancement of endothelial nitric oxide synthase (eNOS) to improve vascular vasorelaxant function (Cheng et al., 2014; Driver et al., 2018). However, since high metformin concentrations (≥500 μM) are required to inhibit complex I (El-Mir et al., 2000; Owen et al., 2000; Kinaan et al., 2015), whereas clinical plasma metformin levels range from 1 to 20 micromolar (Scheen, 1996; Christensen et al., 2011; Graham et al., 2011), it is unlikely that metformin-mediated inhibition of complex 1 explains its therapeutic action in patients with diabetes. We therefore focused on metformin concentrations within the therapeutic range (1–50 μM).
Such metformin concentrations matching therapeutic blood levels have been reported to protect cultured rat endothelial cells from hyperglycemia-induced oxidative stress (Ouslimani et al., 2005). This action of metformin would be in accord with: 1) the ability of metformin to improve diabetic vascular endothelial function in vivo (Mather et al., 2001) and 2) our findings that endothelial function can be protected from hyperglycemia-induced dysfunction by minimizing endothelial-damaging ROS-meditated oxidative stress (El-Daly et al., 2018). In terms of this likely “antioxidant” mechanism for metformin’s action on the vasculature, we sought to identify another “partner” that might play a role in its action.
Our attention was drawn to the ability of the “orphan nuclear receptor” NR4A1/Nr4a1/Nur77 to modulate carbohydrate metabolism in a way that reflects metformin’s actions (Chao et al., 2009; Pearen and Muscat, 2010; Mohankumar et al., 2018; Zhang et al., 2018). Of note, metformin can upregulate the transcription of NR4A1, and metformin’s action in cultured murine thigh-muscle–derived C2C12 myoblasts requires Nr4a1 expression (Mohankumar et al., 2018). Since metformin improves vascular endothelial function in type 2 patients with diabetes in vivo (Mather et al., 2001), we hypothesized that, as for our previous findings (El-Daly et al., 2018), metformin might preserve diabetic endothelial function by minimizing hyperglycemia-induced endothelial oxidative stress. Further, given the requirement of Nr4a1 for metformin’s action in mouse C2C12 cells (Mohankumar et al., 2018), we also hypothesized that metformin’s vascular action would be linked to the expression of NR4A1 and a potential direct interaction with metformin.
To test our hypotheses, we evaluated metformin’s effects in multiple settings: 1) vascular organ cultures coupled with a bioassay to assess hyperglycemia-induced vascular endothelial dysfunction in mouse wild-type and Nr4a1-null–derived aorta rings (El-Daly et al., 2018; Pulakazhi Venu et al., 2018); 2) primary aorta-derived wild-type and mouse Nr4a1-null endothelial cell cultures in which ROS production is elevated by hyperglycemia; 3) tissue and cell mitochondrial complex-I, complex-II, complex-III, and complex-IV function (oxygen-consumption rates) for wild-type and Nr4a1-null–derived samples (aorta rings and endothelial cells) cultured at either high (25 mM) or low (5–10 mM) glucose; 4) an in vitro transfection assay using human embryonic kidney (HEK) 293T cells in which wild-type and mutant Nr4a1 constructs were tested for their ability to allow metformin to modulate hyperglycemia-induced changes in mitochondrial function; and 5) An in vivo streptozotocin (STZ) diabetes model using metformin treatment of both wild-type and Nr4a1-null STZ-diabetic mice. Isolated aorta tissues from the metformin-treated and untreated STZ-diabetic mice were evaluated for hyperglycemia-impaired endothelial vasodilator function.
Furthermore, anticipating that metformin’s vascular action to affect ROS might involve the expression of NR4A1, we interrogated a potential physical link between NR4A1 and metformin as a potential mechanism for metformin’s action. Therefore, we evaluated metformin-NR4A1 interactions using an in silico docking approach (Lanig et al., 2015) and with a direct avidin “pulldown” approach using biotinylated metformin to determine whether metformin can potentially interact directly with NR4A1 in solution. Our data indicate that indeed, metformin can potentially interact with an alternative ligand binding site in the NR4A1 C-terminal domain, which is distinct from the ligand binding pocket in NR4A1’s “classic” ligand binding domain (LBD) (Lanig et al., 2015). This alterative binding site is in keeping with the nuclear receptor alternate modulator binding sites discussed by Katzenellenbogen and colleagues (Moore et al., 2010). Furthermore, we show that metformin can bind in a reversible way to an Nr4a1 protein complex and can protect the endothelium from hyperglycemia-induced ROS-associated dysfunction at therapeutic concentrations (1–50 μM) but only for Nr4a1-expresssing tissues. Finally, we evaluated the functional consequences in our HEK cell transfection assay of mutations in NR4A1 at sites predicted by our in silico analysis to interact with metformin. The NR4A1 mutants were not able to support metformin action in hyperglycemia-treated cells to increase the mitochondrial oxygen consumption rate or to reduce proton leak in the assay.
Materials and Methods
Chemicals and Other Reagents
The PAR-activating peptide 2-furoyl-LIGRLO-NH2 (2fLI) (purity ≥ 95% validated by high performance liquid chromatography and mass spectral analysis) was synthesized in the University of Calgary, Health Sciences Centre peptide synthesis facility. Phenylephrine HCl, acetylcholine, l-arginine, L-NAME, indomethacin, sodium nitroprusside, and anhydrous glucose were purchased from Millipore Sigma, Burlington, MA (formerly Sigma-Aldrich); both high glucose (4.5 g/l, 25 mM) as well as low glucose (1 g/l, 5.5 mM) Dulbecco's modified Eagle's medium (DMEM) used for endothelial cell and aorta ring organ cultures were purchased from Thermo Fisher Scientific (Waltham, MA). Metformin-hydrochloride was purchased from Cayman Chemicals, Ann Arbor, MI, 13118. The NR4A1 agonist 1-(3,4,5-trihydroxyphenyl)-nonan-1-one (THPN; 3063200) and antagonist ethyl 2-[2,3,4-trimethoxy-6-(1-octanoyl)phenyl]acetate (TMPA; 492910), cytosporone B (3,5-dihydroxy-2-(1-oxooctyl)benzeneacetic acid ethyl ester, 2997), the guanylate cyclase inhibitor [1H-[1,2,4]oxadiazolo-[4, 3-a]quinoxalin-1-one]acetylcholine (O363), streptozotocin (N-(methylnitrosocarbamoyl)-α-d-glucosamine), acetylcholine (ACh), and phenylephrine (PE) were from MilliporeSigma (Oakville ON). Heparin for mouse anticoagulation was purchased from Leo Pharma (Thom Hill, ON, Canada). Celastrol (3-hydroxy-9β,13α-dimethyl-2-oxo-24,25,26-trinoroleana-1(10),3,5,7-tetraen-29-oic acid) was from Cayman Chemicals, Ann Arbor, MI. Other basic chemicals were purchased from either MilliporeSigma (Oakville, ON) or VWR (Radnor, PA).
Animals
We used Nr4a1+/+ [designated as wild type (WT)] and Nr4a1−/− (Nr4a1-null) male mice on a C57/Bl6 genetic background for our study. The mice were purchased from Jackson laboratory stock number 006187. Mice were used in keeping with the Canadian Council on Animal Care/2010/EU/63-approved procedures. For this study we used only mice of 2–3 months of age, body weight 20–25 g. Nr4a1+/+ is hereafter termed WT, and Nr4a1−/− mice are also termed Nr4a1-null. Wild-type and Nr4a1-null mice were not littermates but were bred in separate colonies under identical feeding and housing conditions in our facility. Our colonies were refreshed yearly with mice purchased from the Jackson Laboratory (Bar Harbor, MA). Heterozygote animals bred from the Nr4a1-null mice were not available and were therefore not used for our studies. All experiments were performed with independent colonies of wild-type and Nr4a1-null mice bred or maintained upon purchase in the same breeding environment. Work with the bred Nr4a1 wild type was done with littermates. Similarly, work with the bred Nr4a1-null mice was done with littermates. However, it was not possible to compare the Nr4a1-null mice with wild-type littermates bred from the same colony. The number of animals per group was determined based on our previous publications in accordance with the (Animal Research: Reporting of In Vivo Experiments: ARRIVE) guidelines for reporting animal research (Michel et al., 2020).
Ten-week-old C57Bl male mice either wild type or Nr4a1 homozygous-null were used for experiments. Investigators were not blinded to the group allocation. Mice were housed at the Clara Christie Centre for Mouse Genomics at University of Calgary in microisolator cages with a standard 12-hour light/dark cycle and ambient temperature 23°C and were provided standard rodent diet (Envigo/Teklad LM-485) and water ad libitum. Wild-type and Nr4a1-null mice sourced from the same supplier were bred separately under identical feeding and housing conditions in our Animal Care Facility, but the wild-type mice were not derived from a heterozygous population of Nr4a1-expressing/Nr4a1-null mice.
Animal Euthanasia with Heparinization to Obtain Aorta Tissue for Organ Culture Procedures
Prior to euthanasia, animals were injected with heparin (0.1 ml of 100 U/ml, administered intraperitoneally) and then euthanized 10 minutes later by cervical dislocation performed under isoflurane anesthetic. Blood vessels were transcardially perfused with 1 ml of 100 U/ml heparin. The descending aorta and abdominal aorta were dissected free of perivascular adipose and connective tissue and placed into ice-cold Krebs solution (115 mM NaCl, 25 mM NaHCO3, 4.7 mM KCl, 1.2 mM NaH2PO4, 10.0 mM dextrose, and 2.5 mM CaCl2), pH 7.4, aerated with 95% O2 and 5% CO2.
Organ Culture
Isolated aorta tissue was cut into rings of approximately 1 mm in length. The segments were then randomized in groups of three or more and incubated in either normoglycemic (5 or 10 mM) or hyperglycemic (25mM) glucose-containing media (DMEM high glucose media, SH30081.01) for 48 hours in the absence or presence of varying concentrations of metformin, cytosporone B, or celastrol, as indicated. The euglycemic 5 or 10 mM glucose-containing media was prepared by diluting the high glucose medium with DMEM containing 0 mM glucose (XF Assay Medium modified DMEM 0 mM glucose media from Agilent, Santa Clara, CA, 102365-100). Cultures were maintained in a humidified incubator at 37°C under an atmosphere of 5% CO2 in room air for 48 hours, with or without additions as indicated. After 48 hours, the tissues were recovered from the culture medium and mounted in a wire-myograph for the evaluation of endothelial function (below). In an alternate protocol, cultures that had been maintained in a hyperglycemic medium (25 mM glucose) for 48 hours in the absence of metformin were then supplemented or not with either 1 or 10 μM metformin and were maintained for a further 12 hours prior to their isolation for the wire myograph vasorelaxation bioassay. Finally, as indicated below, tissues cultured for 48 hours in a hyperglycemic medium were harvested and mounted directly in the organ bath for the bioassay. At that point, metformin (10–100 μM) was added or not to the organ bath in the presence or absence of 1 μM actinomycin D to block gene transcription, and the vasodilation responses to Ach or 2fLI were monitored over a 3–4-hour time frame. The wire myograph procedure was done as follows.
Tissue Bioassays/Wire-Myography Procedures for Evaluating Endothelial Function
Aorta rings were subject to bioassay either directly after isolation or after a period of organ culture (24–48 hours). The aorta ring tissues were recovered from the culture medium, transferred to tissue bioassay medium (Krebs solution, pH 7.4), and mounted in a Mulvany–Halpern myograph organ bath (610 multimyograph system coupled to Chart5 system software, AD instruments, Colorado Springs, CO) for bioassay measurements. Tissues were treated with metformin or not either during the period of organ culture, or, alternatively, vascular rings previously cultured for 48 hours under hyperglycemic conditions were treated or not with metformin after mounting the tissues in the bioassay organ bath for the vasodilation bioassay (below). In addition, rings were used for measurements of mitochondrial function using the “Seahorse” apparatus (see below). Furthermore, tissues were also removed from the bioassay instrument after treatment with metformin in the absence or presence of actinomycin D (1 µM) and quick-frozen for subsequent mRNA extraction and analysis of NR4A1 mRNA content by quantitative polymerase chain reaction: PCR. All assays to measure endothelium-dependent tissue vasorelaxation were performed at 37°C in Krebs buffer aerated with 5% CO2 in room air. A resting tension of 1 g (4.8 mN) was maintained for 1 hour prior to and during all experiments. After a 60-minute equilibration period, tissue viability was verified by monitoring a contraction in response to the addition of 80 mM KCl to the organ bath. The presence of vasoconstriction confirms the viability of the tissues. Next, the integrity of the endothelium was verified by contracting the tissue with PE (2.5 μM) followed by monitoring a relaxation caused by ACh (3 μM). A prompt ACh-mediated relaxation response was used to verify that the endothelium was functionally intact. Tissues were washed three times after reaching an equilibrium tension and allowed to re-equilibrate in bioassay buffer for 20 minutes prior to the next addition of agonists to the organ bath. After the responsiveness of the tissues to PE-induced contraction and endothelium‐dependent relaxation had been validated, the following experimental protocols were pursued.
Vasorelaxant Responses
Concentration-effect curves for endothelium‐dependent vasorelaxation induced by ACh and the proteinase-activated receptor 2 (PAR2)‐selective agonist 2‐furoyl‐LIGRLO‐NH2 (2‐fLI) were measured upon first contracting the tissues with PE (2.5 μM) to a plateau tension, which was followed by the addition of increasing concentrations of ACh or 2‐fLI to the organ bath. Relaxant responses were also evaluated in the presence of inhibitors in which tissues were pretreated with putative endothelium-targeted inhibitors (e.g., L-NAME) for 20 minutes prior to contracting the tissues with PE and then adding an endothelium‐dependent vasorelaxant agonist (ACh or 2‐fLI) to the organ bath. Relaxation responses were then calculated as % PE contraction according to the equation: Relaxation, %PE = [(tension PE alone – tension with PE in the presence of vasodilator)/tension PE alone] × 100. Concentration-effect curves were obtained for ranges of agonist concentrations used successfully in our previous work with comparable preparations (El-Daly et al., 2018; Pulakazhi Venu et al., 2018). Curves were fitted by nonlinear regression, with error bars representing the S.D. for three or more independent experiments, as recorded in the figure legends.
Endothelial Cell Isolation and Generation of Primary Cultures
Mouse aortic endothelial cells were isolated from dissected aorta tissue as described previously (Wang et al., 2016). In brief, isolated aortic segments were placed on Matrigel (Corning Matrigel Matrix GFR, LDEV-free) with the endothelium side facing the gel and were supplemented with DMEM 5 mM glucose containing d-valine CDB-131 (US biologic life sciences, MA) media supplemented with human epidermal growth factor (5 ng/ml), vascular endothelial growth factor (2 ng/ml), endothelial cell growth supplement (Bovine hypothalamus extract: BT,203, Alfa Aesar, CAAAJ64516-MF) (30 μg/ml), hydrocortisone (1 μg/ml), heparin (0.75 U/ml), glutamax, penicillin, and streptomycin. Upon sprouting, cells were moved to gelatin-coated T-25 flasks by trypsinization and passaged when 80% confluent. During this step, the cells were washed twice with isotonic phosphate-buffered saline, pH 7.4, 1 mM EDTA for 15 minutes and then dissociated for 3–5 minutes with 0.25% (w/vol) trypsin (approximately 0.1 mM enzyme) in isotonic phosphate-buffered saline, pH 7.4, containing 1 mM EDTA. The cells were transferred by scraping into new gelatin-coated T-25 flasks and allowed to attach for 20 minutes and then fed with the above endothelial cell growth medium. The medium was then changed to eliminate any contaminating cells, and the cells were refed. The cells were allowed to grow to confluence; were lifted from the plate by trypsinization, plated, and refed in gelatin-coated T-25 flasks; and were used for assay from passage 3 and on. Next, cells expressing the endothelial cell phenotype were harvested by cell sorting using expression of the CD102 marker for their identification. Sorted cells, reacting with fluorescein isothiocyanate —labeled anti-CD102 (fluorescein isothiocyanate Rat Anti-Mouse CD102 3C4 (mIC2/4) RUO 557444, BD Biosciences)—were expanded and used for the study. Confirmation of the endothelial cell phenotype was verified by monitoring VE-cadherin expression by immunohistochemistry as described previously (El-Daly et al., 2018).
Measurement of the Oxygen Consumption Rate in Aortic Segments and Cultured Endothelial Cells
Aortic segment mitochondrial oxygen consumption rate measurements were done as described previously (El-Daly et al., 2018). In brief, a single aorta tissue segment from a wild-type or Nr4a1-null mouse provided approximately 4–5 aorta tissue fragments per mouse. Aortic tissues were cut open and placed into the 24-well multiwell Seahorse islet plates (Agilent, Santa Clara, CA, 101122-100) with the endothelium side facing up, enclosed by the capture screen. This procedure enabled the tissues or endothelial cell monolayers to be held in place during the assay. The tissues or cell monolayers were first incubated in DMEM (Seahorse Bioscience North Billerica MA) containing either 25 mM or 10 mM glucose in the presence or absence of 10 or 500 μM metformin for 24 hours in a humidified incubator under an atmosphere of 5% CO2 in air at 37 °C. The oxygen consumption rate (OCR) measurements were then performed using a Seahorse analyzer (Agilent XFe24 analyzer).
To normalize the tissue oxygen consumption rate data (below) to the protein content of the vascular sections, each sample was harvested immediately after the respirometry measurements were done and solubilized to determine protein content. In brief, aorta tissue samples were put in protein lysis buffer containing protease inhibitors (PhosStop and complete ULTRA Tablets, Mini, EASYpack Protease Inhibitor Cocktail: MilliporeSigma). Stainless steel beads were added, and the samples were blended (Bullet Blender nextadvance.com; Troy, NY) for 15 minutes. Supernatant aliquots (10 μl) were added to 300 μl of precision red solution (Cytoskeleton.Inc., Denver, CO) and incubated for 5–10 minutes. The protein concentration was then calculated from the resulting optical density measured at 600 nm according to the manufacturer's formula (O.D. × 12.5 = mg/ml). The oxygen consumption rate data were normalized to the protein content of the tissue samples using the Seahorse wave software. In a similar way, endothelial cell monolayers obtained from both wild-type and Nr4a1-null mice were grown in a T25 flask to 80% confluency. At that point, both wild-type and Nr4a1-null cells were harvested by trypsinization, counted, and seeded in endothelial growth medium 5 mM glucose as described above at 50,000 cells/well into XF-cell culture microplates (Agilent Technologies Mississauga, ON, 102340-100). Allowing overnight for attachment, the cells were then switched to serum-free DMEM 25 mM glucose without or with supplementation with either 10 μM or 500 μM metformin and cultured for a further 24 hours at 37 C. The cells were then taken from the incubator and studied for their OCRs using the Seahorse analyzer. The data were analyzed using the mito-stress assay report generator supplied by Agilent technologies (Santa Clara, CA). The oxygen consumption rate data (OCRs) obtained from 5 replicate monolayer cultures were normalized to protein levels analyzed after the assay as previously described (El-Daly et al., 2018)
Measurement of the Oxygen Consumption Rate in Permeabilized Cells to Study Individual Respiratory Chain Complex-Mediated Respiration
The activity of individual respiratory chain complexes was evaluated in permeabilized cells in keeping with previously described procedures (Sumi et al., 2018). In brief, wild-type endothelial cell monolayers prepared as described in the previous paragraphs were incubated for 24 hours in 25mM glucose-DMEM treated or not with metformin (10 or 500 μM). Cells were then washed with Mitochondrial Assay Solution buffer (220 mM mannitol, 70 mM sucrose, 10 mM KH2PO4, 5 mM MgCl2, 2 mM HEPES, 1 mM EGTA, 0.2% fatty acid free bovine albumin, adjusted to pH 7.2 with KOH), and the medium was replaced with mitochondrial assay solution buffer supplemented with 10 mM pyruvate, 1 mM malate, 4 mM ADP, and 1 nM plasma membrane permeabilizer. The cells were then loaded into the XFe24 Seahorse analyzer to measure respiration rates using cycles of 30 seconds mixing/30 seconds waiting/4 minutes measurement.
Protocol A
After the measurement of pyruvate-driven respiration, rotenone (final concentration 2 μM) was injected through port A to halt the complex I–mediated respiratory activity. Next, succinate (10 mM) was injected through port B to donate electrons at complex II, bypassing complex I inhibition.
The addition of antimycin A (2 μM) via port C inhibited complex III, and N,N,N,N- tetramethyl-p-phenylenediamine (0.1 mM) combined with ascorbate (10 mM) was subsequently injected through port D to measure complex IV activity. This procedure is shown in the schema illustrated in Fig. 9.
Protocol B
As an alternative approach, cells were initially supplemented with pyruvate to measure complex I activity. After injection of rotenone, duroquinol was injected to stimulate complex III–mediated respiration. This procedure is shown in the scheme illustrated in Fig. 9.
Measurement of ROS in Cultured Endothelial Cells
Wild-type and Nr4a1-null–derived endothelial cell monolayers generated as aorta-derived primary cell cultures as described in the above methods were grown in DMEM 5 mM glucose and were switched to DMEM 25mM glucose in the presence or absence of metformin. Monolayers were incubated at 37°C for 1 hour and then stained for 30 minutes to detect reactive oxygen species using CellROX green (Thermo Fisher Scientific, C10444: reactive oxygen species = green color). The cells were then fixed with 10% formalin for 15 minutes and washed with isotonic PBS, pH 7.4, three times for 5 minutes and permeabilized using 0.5% Triton X-100 for 10 minutes. The fixed cells were washed to remove any Triton X-100 and stained using Hoechst 33342 to identify the nuclei. The samples were then washed with phosphate-buffered isotonic saline, pH 7.4, three times for 5 minutes and visualized under florescence microscopy with excitation and emission at 485/520 nm, respectively. Images were taken using a 20× objective. Fluorescence intensity was quantified using imageJ. Corrected cell fluorescence intensity was calculated according to the formula: cell fluorescence (corrected cell fluorescence intensity) = Integrated Density – (Area of selected cell × Mean fluorescence of background readings). To compare the levels of ROS observed in the wild-type versus Nr4a1-null cells, morphometric analysis was done by integrating the mean fluorescence intensity observed in three independent equivalent image fields for each condition. Data were expressed as the mean fluorescence yield (arbitrary units) per monolayer field. In separate experiments done to evaluate the impact of hyperglycemia on endothelial cells of a different tissue source, mouse microvascular endothelial cells (MMECs; ATTC, Manassas, VA, CRL-2460) were used. To assess the ability of metformin to mitigate ROS production, the MMECs were seeded into MatTek glass bottom dishes at 50,000 cells/plate. Cells were treated with mouse-derived physiologic concentrations of glucose (11 mM) and high glucose (40 mM) in DMEM (Gibco/Thermo Fisher Scientific) with and without 50 µM metformin (Sigma) for 24 hours, which was followed by staining with dihydroethidium (Invitrogen/Thermo Fisher Scientific). Imaging was done using Carl Zeiss LSM 880 confocal microscope, and 5–7 random images from equivalent microscopic field areas were obtained from each sample. Total fluorescence intensity was measured at excitation/emission wavelengths of 518/606 nm and was quantified using imageJ as mean gray values. Values were normalized to normal glucose controls.
STZ In Vivo Model of Diabetes for Wild-Type and Nr4a1-Null Mice
Uncontrolled diabetes was induced as outlined in Fig. 5A, with five consecutive daily subcutaneous doses of freshly prepared STZ (50 mg/kg), as described previously (Furman, 2015) following basic protocol 1 for mice. This model is best characterized for male mice and thus our first test of the role of NR4A1 to regulate metformin action was done with males. Work with females was not possible at the time of the project and will be done separately at a later date. Blood glucose levels were measured in tail clip blood samples 1 week after the first STZ injection using a One touch ultra-Test strips Code 25 glucometer. In brief, after STZ treatment of wild-type and Nr4a1-null animals that resulted in sustained hyperglycemia for 12–13 weeks (the same for both wild-type and Nr4a1-null mice), the mice were divided into two groups: group 1, STZ-only injected mice, and group 2, STZ-injected mice with a daily oral gavage administration of metformin (65 mg/kg/d) for 2 weeks. This dosing is predicted to yield blood metformin concentrations of about 20 to 30 µM (Martin-Montalvo et al., 2013; Wang et al., 2019). After 2 weeks of gavage, blood glucose levels were measured in all mice prior to euthanasia and were found to be equivalent for both wild-type and Nr4a1-null mice. Aortic segments were isolated from the two groups of wild-type and Nr4a1-null mice (STZ alone vs. STZ animals also treated with metformin) and were used for vasorelaxant bioassays as outlined in Methods to evaluate vascular function as described above for muscarinic (ACh) and PAR2 (2fLI)-mediated vasorelaxation. All experiments adhered to ARRIVE (Animal Research: Reporting of In Vivo Experiments) Guidelines
Transmission Electron Microscopy Imaging of Aorta and Endothelial Cells
Wild-type mouse aortic endothelial cells were grown to confluency on a gelatin-coated glass coverslip in growth medium as described above and switched to DMEM containing 25 mM glucose and incubated for a further 24 hours in the absence or presence of either 10 or 500 μM metformin. Postincubation, cells were directly fixed with 2.5% glutaraldehyde buffered with 0.1 M sodium cacodylate (pH 7.4) for a minimum of 2 hours. Cells incubated with 25 mM glucose without or with metformin were treated with same fixative. The specimens were washed in 0.1 M sodium cacodylate buffer at pH 7.4 before being post-fixed in 2% osmium tetroxide. The tissue was then dehydrated with graded acetone and then infiltrated with several changes of graded Epon: Acetone and then embedded in Epon resin. The sections were cut at 70 nm and stained with a 2% uranyl acetate and counterstained with a 4% lead citrate solution. Transmission Electron Microscope images were acquired on a Hitachi model H-7650 from 4000×–20000× magnification. The acquired images were then processed for mitochondria number, shape, and circularity using ImageJ. Morphometric analysis of the distinct mitochondrial morphologies (“spindle” vs. “circular”) was manually counted using ImageJ. In equivalent image areas, the proportion of circular to spindle-shaped mitochondria was taken as an index of increased metabolism due to hyperglycemia exposure (Hackenbrock, 1966).
Western Blot Detection of Phospho-AMPKinase and Phospho-eNOS
Wild-type endothelial cells were grown to 80% confluency endothelial cell growth medium (described above) in gelatin-coated 24-well multiple-well plates of 15.6 mm diameter/well. Cells were then switched to either 5 mM or 25 mM glucose-DMEM for 24 hours. Monolayers were subsequently treated or not for 1 hour at 37°C with metformin (10 μM or 500 μM) or with the AMPKinase activator AICAR (as a positive control: 500 μM, added to DMEM 5 mM glucose wells; MilliporeSigma, A9978). After 1 hour, the cells were then lysed and homogenized using ice-cold phosphoprotein lysis buffer containing NP40 (20 mM Tris-HCl, pH 7.5, 100 mM NaCl, buffer: MgCl2, 1 mM EDTA, 1 mM EGTA, 0.5% NP40, 2.5 mM sodium pyrophosphate, 1 mM β-glycerophosphate, 1 mM Na3VO4, 25 mM NaF, and 1 mM dithiothreitol). The lysis buffer (1 ml) was also supplemented with 10 μl of Proteinase Inhibitor Cocktail set III (MilliporeSigma, 539134) containing 1 mg/ml leupeptin, 1 mg/ml aprotinin and 1 mM phenylmethylsulfonyl fluoride. Western blot analysis was done essentially as previously described (Mihara et al., 2013). Equivalent amounts of protein from each cell monolayer extract were heat-denatured at 92 °C for 6 minutes in denaturing Laemmli buffer and resolved on 4%–20% gradient Novex Tris-Glycine gels (Thermo Fisher scientific) run at 120 V for 2 hours. Transfer of proteins onto PVDF membrane was done using a semidry method. The resolved proteins were transferred to PVDF membrane, blocked for hour at room temperature in phosphate-buffered isotonic saline, pH 7.4, supplemented with 0.1% (v/v) Tween-20 buffer containing 0.1% ECL Advance Blocking Agent (GE Healthcare, Waukesha, WI). Western blot detection of phospho-eNOS and phospho-AMPK was performed using rabbit anti-phospho-eNOS (Thr-495) and anti–phospho-AMPK antibodies (Cell Signaling Technology, Danvers MA, 9574 and 2535, respectively). A β-actin signal was measured as a loading control denominator (Cell Signaling Technology, Danvers MA, 3700). After washing the membrane with phosphate-buffered isotonic saline, pH 7.4, supplemented with 0.1% (v/v) Tween-20 buffer, the peroxidase activity was detected with the chemi-luminescence reagent ECL-Advance (GE Healthcare, Waukesha, WI) using a Chemdoc imager (Biorad, Mississauga, ON). Band intensities representing eNOS or phospho- AMPK were quantified using Image J software and normalized to the signal generated in the same lane on the same gel by re-reprobing for β-actin (Cell Signaling Technology, 3700. The measurements were done for a minimum of three replicates.
Western Blot Detection of eNOS in Aorta Tissues
Western blot analysis, done essentially as described in the above section, was used to determine the abundance of vascular eNOS in wild-type and Nr4a1-null aortic tissues. The aortic tissues were excised and cleaned in Kreb’s buffer as described above. The tissues were immediately weighed and snap-frozen in liquid nitrogen. After this procedure, tissues were stored at −80°C. The stored tissues were put into ice-cold NP40-containing lysis buffer (composition as above) and blended using stainless steel beads in a Bullet Blender (Nextadvance.com Troy NY) in NP40-proteinase-inhibitor–supplemented lysis buffer (above). Protein concentration was determined using precision red reagent (Cytoskeleton Inc Denver CO) as described previously (El-Daly et al., 2018). Equivalent amounts of protein from each tissue extract were analyzed. Detection of total eNOS was performed using anti-rabbit eNOS antibody (Cell Signaling Technology, 32027). The β-actin signal for each sample was measured as a gel-loading control (Cell Signaling Technology, 3700S). Band intensities representing eNOS were quantified using the Image J quantification (Rueden et al., 2017; http://rsbweb.nih.gov.ezproxy.lib.ucalgary.ca/ij/). eNOS levels were normalized for differences in protein loading by expressing the densitometry data in arbitrary units relative to the corresponding total protein and β-actin band detected in the same sample. Data were obtained from a minimum of three replicate tissue samples.
Measurement of Nr4a1 mRNA in Bioassay-Derived Tissues before and after Metformin Treatment in the Organ Bath in the Absence and Presence of Actinomycin
Aorta rings were maintained in organ culture for 48 hours in the presence of 25 mM glucose as outlined above and were then mounted in the wire myograph for a vasodilator bioassay also as described above in keeping with the experiments shown in Fig. 13, D and E. Metformin (10–100 µM) was then added or not to the organ bath in the presence or absence of actinomycin D (1 µM), and tissues were allowed to incubate for 3 hours at 37°C. Aorta tissues were then removed from the myograph, pooled (2–3 rings/sample), snap-frozen in liquid nitrogen, and stored at −80°C until RNA was isolated. Tissues were thawed in an ice-cold tube containing Zirconium beads (Beads Lysis green kits for tough tissue, Next Advance Inc., Troy, NY), immersed in RNA lysis buffer, and then homogenized for 10 minutes with a Bullet Blender (Next Advance Inc., Troy, NY). The lysate was clarified by passage through a QIAshredder (Qiagen, Hilden, Germany). RNA was extracted with a Zymo Micro kit according to the company’s protocol (Zymo Research, Irvine, CA). cDNA was synthesized with SuperScript IV (ThermoFisher, Waltham, MA), and real-time PCR amplification was done in triplicate using a StepOne Real-Time PCR system with PowerUp SYBR Green Master Mix (ThermoFisher, Waltham, MA). Since the amounts of total RNA from aorta tissues were very small and could not be readily quantified spectrophotometrically, we used all of the purified total RNA to synthesize cDNA and then standardized/normalized our Quantitative Polymerase Chain Reaction data for triplicate qPCR measurements relative to the abundance of mRNA for glyceraldehyde‐3‐phosphate dehydrogenase (GAPDH) (delta-delta Ct method/GAPDH), a “house-keeping” gene internal control that is not affected by actinomycin D. The primer pair sequences were Nr4a1 (NM_010444.2) forward: GCTCAGGCCTGGTACTACAC and reverse: GCAAAGGCGGGAACATCAAC and GAPDH (NM_001289726.1 v1, NM_008084.3 v2, XM_017321385.1 X1) forward: GCCTCGTCCCGTAGACAAAA and reverse: CTCGCTCCTGGAAGATGGTG.
Synthesis of Biotinylated Metformin
The chemical reaction pathway for the synthesis of biotinyl metformin is shown in scheme 1 of Supplemental Fig. 1. The synthesis of biotin-tagged decyl amine (1), free of metformin, to serve as a “control” was completed by the reaction of 1-decylamine (Sigma-Aldrich, CAS 2016-57-1) with biotin-pentafluorophenyl ester [prepared according to procedure reported by Papatzimas et al. (2019)], in dimethylformamide at room temperature for 1 hour. Compound 1 was purified by trituration with diethyl ether. S-Methyl-guanylisothiouronium iodide (2) was prepared according to the published procedure by (Wilkinson et al., 2011) from amidinothiourea (Combi-Blocks, CAS 2114-02-5) and methyl iodide (Sigma-Aldrich, CAS 74-88-4). Reaction of compound 2 with 1-decylamine in dimethylformamide at 60°C for 10 hours produced crude metformin-decylamine (3) that was purified using a Biotage Isolera Prime 30 chromatography instrument using a Biotage SNAP KP-NH column (MeOH/CHCl3). Tetradecanedioic acid (Sigma-Aldrich CAS 821-38-5) was reacted with oxalyl chloride to produce the diacyl chloride intermediate that was then reacted with aqueous NH3 to prepare the diamide. The diamide was then reduced with LiAlH4 to produce 1,14-diaminotetradecane. This diamine was reacted with Biotin-Pfp to prepare the monofunctionalized derivative. The intermediate was then reacted with compound 2 in dimethyl formamide at 60°C for 12 hours and purified using a Biotage Isolera Prime 30 chromatography instrument using a Biotage NAP KP-NH column (MeOH/CHCl3) to furnish the biotin-tagged metformin (4).
Using Biotinyl Metformin to Assess Metformin-Nr4a1 Interactions
Expression of C-Terminally myc- and Monomeric Red-Fluorescent Protein–Tagged Mouse Nr4a1 in HEK 293T Cells
Mouse Nr4a1 with a C-terminal myc or mRFP tag was expressed in a human embryonic HEK 293T cell background to serve as a source of Nr4a1 protein to test its interaction with biotinylated metformin. The coding cDNA sequence of mouse Nr4a1 was cloned into the pCDN3.1+ plasmid vector under the control of a cytomegalovirus promoter. The coding sequence of Nr4a1 cDNA (double-stranded DNA fragment of NM_010444.2, obtained from Integrated DNA Technologies, Inc., Coralville, Iowa) was cloned into the pCDNA 3.1+ EcoRI vector XhoI site with a linker. The C-terminal stop codon was replaced with a XhoI cleavage site and then fused to either a myc epitope peptide or an mRFP tag sequence. For Nr4a1 protein expression, HEK-background LX293 cells (Takara Bio USA, Mountain View, CA) were grown in 10% fetal calf serum–supplemented Dulbecco’s modified minimal essential medium (Thermo Fisher. Scientific) to 20% confluence in T75 flasks. When at 20% confluency, cells were transfected with pCDNA3.1-mNR4a1-mRFP or pCDNA3.1-mNr4a1-myc using Lipofectamine 3000 transfection reagent (Thermo Fisher Scientific). Cell growth medium was replaced the following day, and the monolayer was cultured further overnight. Cells were washed and lifted with isotonic phosphate-buffered saline pH 7.4, containing 1 mM EDTA. Cells pellets were collected in 5 ml round-bottom polystyrene tubes by centrifugation at 200 g for 3.5 minutes and resuspended in 500 μl of binding buffer (50 mM Hepes/KOH, pH 7.4, 78 mM KCl, 4 mM MgCl2, 2 mM EGTA, 0.2 mM CaCl2, 1 mM dithiothreitol, and protease inhibitor cocktail) (Protease Inhibitor Cocktail Set III, Sigma-Aldrich, Canada) that was prepared at 2× concentration for cell freezing. The cell suspension was snap-frozen with liquid nitrogen and stored at −80°C until use.
Preparation of Soluble Nr4a1 for Use in “Pulldown” Experiments
Cells, were thawed, cooled in ice-water, and homogenized in 2× concentrated binding buffer (above) to dissociate Nr4a1 from DNA using a polytron (Kinematica, PT10/35 with 5 mm saw tooth generator) at maximum speed, with controller value at 9, for 30 seconds. The homogenate was clarified by centrifugation at 20,000 g for 5 minutes and was then diluted with an equal volume of ice-cold deionized water to yield 1× binding buffer.
Harvesting the Biotinylated Metformin-Nr4a1 Complex
Duplicate samples of the lysate (0.25 ml each) in 1.5-ml microfuge tubes were supplemented with the biotinylated metformin construct (4 μg in 2 μl DMSO) or with the same amounts of either the metformin-free biotinylated C10 linker or a biotin-free metformin-C10 linker construct. Binding was allowed to proceed on ice for 15 minutes. Neutravidin crosslinked magnetic beads (Sera-Mag SpeedBeads Neutravidin Magnetic Beads, GE Healthcare Life Sciences, Marlborough, MA) were used to harvest the biotinylated metformin and biotinylated linker from the cell extract. A 4-μl suspension of beads per reaction was transferred to 100 μl of Hanks buffered isotonic saline solution, pH 7.4, containing 0.1% (w/v) fatty acid–free bovine serum albumin and washed three times with same buffer. The washed beads were resuspended in 20 μl of binding buffer for each reaction and were added directly to the cell lysates containing either biotinylated metformin or the control constructs (biotinylated metformin-free C10 linker; biotin-free metformin-C10 linker). Beads were sedimented magnetically using a magnetic particle concentrator (Dynal MPC, Oslo, Norway). The bound NR4A1 in the neutravidin bead bound biotin complex was then eluted from its metformin complex by incubation of the sedimented beads for 30 minutes at 30°C in 10 µl of binding buffer containing 100 μM metformin. The high metformin concentration was added to prevent a reassociation of released proteins with the resin-bound biotinylated metformin. Eluted Nr4a1 was detected by Western blot analysis of the bead-eluted solution as previously described (Mihara et al., 2013) with detection using an Nr4a1 antibody (mouse anti-nur77, 554088, BD pharmigen/BD biosciences, San Jose, CA).
In Silico Molecular Docking
The atomic coordinates of NR4A1 were downloaded from Protein Data Bank (PDB) (PDB ID: 2QW4). The amino acid coordinates shown in the docking figures correspond to those used by Lanig et al. (2015) for their docking procedures. Thus, for example, proline 139 shown in the metformin docking image (Fig. 15) corresponds to 501P in the full-length sequence of NR4A1, whereas proline 184 shown in Fig. 15 corresponds to P546 in the full-length sequence of NR4A1 (see legend to Fig. 15). The ligand used for docking was metformin obtained from PubChem (CID-4091; https://pubchem.ncbi.nlm.nih.gov/compound/4091#section=3D-Conformer). Both the protein and the ligand were prepared using Autodock tools (Morris et al., 2009) and were converted to pdbqt files for docking. The ligand was docked into the binding pocket near N-terminal sequence of the ligand binding domain of Nr4A1that is situated toward the C terminus of the intact protein (Lanig et al., 2015) by defining grid box dimensions with 1-Å spacing and size of 52 × 52 × 58 pointing in X, Y, and Z directions using Autodock Vina (Trott and Olson, 2010). Default parameters were used during the docking simulations.
Molecular Dynamics Simulation
Molecular dynamics (MD) simulation was performed on the metformin-NR4A1 complex using Gromacs 2019.4 (Abraham et al., 2015) at 300 K temperature using Charmm36 force field (Huang et al., 2017). The ligand file from the complex of metformin-NR4A1was extracted using gmx grep module. The topology and force-field parameters of the ligand were generated using CGenFF server (Vanommeslaeghe et al., 2010). The complex was solvated with water molecules in a dodecahedron box with an edge margin of 2.0 Å from each side. Simple point charge water model was used to solvate the complex. Ions were added to replace the solvent molecules with monoatomic ions using gmx genion module. Energy minimization was performed using steepest-descent algorithm followed by equilibration and molecular dynamics run. The resultant trajectories and calculated binding affinities (kcal/mol) were thoroughly analyzed using different GROMACS modules including gmx energy, gmx trjconv, gmx rms, gmx hbond, gmx analyze, and gmx sasa. The three-dimensional models were visualized and prepared using Pymol (Schrodinger, LLC.) and visual molecular dynamics (VMD) (Humphrey et al., 1996) software.
Evaluating Nr4a1-Metformin Interactions to Affect Mitochondrial Function in an HEK 293T Cell Expression System Using Wild-Type and Proline PPGG Mutants of Nr4a1
Due to the very low transfection efficiency in endothelial cell cultures like Human umbilical vein endothelial cells (HUVEC) s (<1%) we selected the highly transfectable (∼100%) embryonic human kidney HEK cells HEK 293T to assess the function of Nr4a1 mutants containing proline-to-glycine mutations in the alternative ligand binding pocket illustrated in Fig. 15, for which our in silico modeling revealed a potential metformin-NR4A1 docking interaction, P505G/P549G, designated as PPGG mutants (mouse sequence corresponds to human P501G/P546G). The Nr4a1 mutants containing proline-to-glycine substitutions were generated as outlined below. We used a mitochondrial functional assay in an HEK 293T cell background transfection system to assess the function of expressed wild-type and mutant Nr4a1 to enable metformin action: A Seahorse mitochondrial oxygen consumption assay was done to monitor the overall oxygen consumption rate and proton leak parameters in the absence and presence of 10 μM metformin treatment, which increased the OCR and reduced proton leak.
Wild-Type and Mutant Constructs of Nr4a1
The protein coding region of the mouse Nr4a1 DNA fragment (protein accession number P12813-1) (obtained from IDT Technologies, Coraville, IO) was cloned into the pCDNA3.1+ plasmid vector under the control of a cytomegalovirus promoter. Using restriction sites in the DNA fragment, proline-to-glycine mutations were introduced at the murine amino-acid residues 505 and 549 (P505G; P549G: PPGG) to generate the mutant NR4a1 plasmid clone. The resulting wild-type and proline PPGG mutant construct vectors were used to transfect HEK 293T cells as per the following protocols.
Oxygen Consumption Rate Assay to Monitor the Effect of Metformin in HEK 293T Cells Transfected with Wild-Type or Proline-Mutated PPGG Nr4a1
Hyperglycemia can affect the mitochondrial OCR, and we observed that metformin can change the OCR in hyperglycemia-exposed endothelial cells (Fig. 8). Because we were unable to generate transfected endothelial cell lines, we used HEK 293T cells as a host transfection cell to evaluate the function of wild-type and PPGG-mutated Nr4a1 in response to metformin. In brief, vectors for the expression of mouse wild-type and the P505G/P549G Nr4a1 mutants (PPGG), generated as outlined above were used to transfect HEK 293T cells to overexpress the WT (HEK) and mutant Nr4a1 constructs (HEK, PPGG). The mitochondrial oxygen consumption rate and proton leak for wild-type or mutant-transfected HEK 293T cells was then monitored for cells grown in 10% fetal bovine serum–supplemented DMEM that had a glucose concentration of 25 mM in the absence or presence of added metformin (10 μM). Details of the methods used follow.
Transfection of HEK 293T Cells and Monitoring Mitochondrial OCR and Proton Leak without or with Metformin Treatment
Wild-type and mutant constructs were transfected into HEK 293T cells using the jetOPTIMUS transfection reagent according to manufacturer’s instructions (Polyplus, New York, NY). For that process, the HEK 293T cells were subcultured to subconfluency overnight in six-well 4 cm2 area cell culture plates (Thermo Fisher Scientific) in 10% fetal calf serum–supplemented DMEM at 37°C in a humidified atmosphere of 5% CO2 in room air. Monolayers were then transfected overnight under the same conditions with vector alone with wild-type or with PPGG Nr4a1 vector with 0.5 µg/well of plasmid DNA. Transfected cells were then lifted by the addition of 50 µl of 0.25% trypsin in PBS containing 1mM EDTA added to the 2 ml medium. Aliquots of the cell suspension (100 µl) were then subcultured in the same growth medium under the same conditions into the 24-well multiwell Seahorse islet plates at 80% cell confluency and allowed to adhere to the bottom of the wells for 3 hours. The multiwells were then supplemented or not with 10 µM of metformin, and cells were treated in the incubator for an additional 16 hours. At that point, wells were transferred to the Seahorse apparatus to monitor the mitochondrial oxygen consumption rate and proton leak using the Seahorse protocols.
Statistical Analyses
For the concentration-response curves, data are presented as mean ± S.D. In addition, in selected figures, the maximal response data are shown as histograms with mean ± S.D. values. Relaxation within each experiment was expressed as a percentage of the tension generated by phenylephrine in each tissue (%PE relaxation). Concentration-response curves were fit (nonlinear regression curve fit) to the data of each experiment using prism, which includes the algorithm used Y = bottom + (top – bottom)/(1+ 10^(log EC50 − X) (wherein X is the logarithm of concentration) based on the equation as shown in previous publications (El-Daly et al., 2018; Pulakazhi Venu et al., 2018). Unweighted nonlinear regression was performed by Prism (v. 9.02; GraphPad, San Diego, CA). Values of maximum response (E max) are also shown separately for some figures and were compared by Tukey's multiple comparisons test. Statistical significance for differences between maximal responses for the bioassays and the oxygen consumption rate values for Nr4a1 wild-type or PPGG mutant-transfected HEK T293 cells were also evaluated using Tukey's multiple comparisons test. The mean ± S.D. are recorded along with 95% confidence limits for the values. Differences between the means for measurements made for samples or animals treated or not with metformin were calculated along with the 95% confidence intervals. When appropriate, P values to denote statistical significance are recorded in the text and figure legends, either as P < 0.05 or as the actual P values.
Results
1. Metformin at Low (1 μM:Fig. 1, B and D) but Not High Concentrations (500 μM:Fig. 1, C and E) Protects the Endothelium from Hyperglycemia-Induced Endothelial Dysfunction, Maintaining Acetylcholine (Muscarinic) and PAR2 (2fLI)-Induced Vasorelaxation
When aorta rings were placed in organ culture for 48 hours under hyperglycemic conditions (25 mM vs. euglycemic 10 mM glucose; schema shown in Fig. 1A), the maximal vasorelaxant actions of both acetylcholine (Fig. 1B) and the PAR2 agonist, 2-fLI (Fig. 1D), were appreciably reduced compared with their actions on aorta rings cultured using euglycemic glucose concentrations (10 mM: compare open diamonds versus solid diamonds, Fig. 1B; open squares versus solid diamonds, Fig. 1D). For instance, for acetylcholine, the mean reduction in the % maximal relaxation response for tissues incubated at 25 mM glucose versus 10 mM glucose was 42% (open diamonds versus solid diamonds, Fig. 1, B and F; 95% confidence interval, 36% to 47%; adjusted P value <0.0001; Fig. 1F). A comparable difference in relaxation caused by 2fLI was also observed (Fig. 1G; a reduction of 55%, CI = 51%–59% PE, P < 0.0001).

Metformin improves hyperglycemia-impaired endothelial function for acetylcholine (muscarinic) and 2fLI (PAR2)-stimulated vasorelaxation. (A) Scheme explaining the incubation of metformin along with different glucose concentrations followed by wire-myography assay. (B–E) Concentration-effect curves for ACh (B and C) and 2fLI (D and E)-induced vasorelaxation in wild-type aortic rings incubated with either 10 or 25 mM glucose without or with 1 or 500 µM metformin for 48 hours. Data points represent the mean ± S.D. (error bars) for measurements done with up to six independently assayed tissue rings obtained from at least eight independently harvested aorta tissue segments for each agonist concentration. Error bars smaller than the symbols are not shown. Statistically significant differences are indicated by an asterisk *. For panels B and D: *P = 0.03, comparing the vasorelaxation for the metformin-untreated 25 mM glucose cultures (open diamonds and open squares) with the increased vasodilation for 1 µM metformin-treated tissues (solid squares), and *P < 0.05, comparing metformin-treated tissues maintained in 25 mM glucose with metformin-untreated tissues maintained in 10 mM glucose. The increase in agonist-stimulated maximal relaxant responses (%PE) between 1 µM metformin-treated vs. untreated hyperglycemic rings (F and G) was 19% PE tension for acetylcholine-mediated relaxation (95% confidence interval, 13%–24% PE) and 29% for 2fLI/PAR2-mediated relaxation (95% confidence interval, 25%–33% PE). For (C and E), 500 µM metformin treatment (solid squares) impaired rather than improved ACh and 2fLI-mediated relaxation compared with untreated tissues, reducing vasodilation by 20% (*P < 0.05). The histograms in (F and G) show the maximal relaxations (Emax) observed for acetylcholine (F) or 2fLI (G), expressed as % relaxation ± S.D. (bars) for tissues treated or not with 1 µM metformin under culture conditions of high (25 mM) glucose concentrations. For (B and D), *P < 0.0001 comparing tissues treated or not with metformin; in (F and G), P < 0.0001 (Tukey’s multiple comparison) for the difference in the relaxation responses observed for tissues cultured for 48 hours at 25 mM glucose (G) (48 hours) in the absence and presence of metformin. There was no statistical difference for cultures done in 10 mM glucose plus or minus metformin.
However, the concurrent presence of 1 μM metformin in the 25 mM glucose-containing culture medium preserved both the muscarinic and PAR2-mediated vasorelaxant responses, shifting the maximal responses of the concentration-response curves downward (solid squares, Fig. 1, B and D) toward those for tissues cultured at euglycemic glucose concentrations (10 mM: solid diamonds, Fig. 1, B and D). Thus, the mean increase in ACh-mediated % relaxation between tissues cultured at 25 mM glucose along with metformin versus those cultured without metformin was 19% (95% CI, 13% to 24% relaxation, P < 0.0001, Fig. 1F). For the 2fLI response of tissues cultured at 25 mM glucose in the presence versus the absence of metformin, there was also an improved relaxation of 29% (95% confidence interval, 25%–33%; adjusted P value for tissues without and with metformin <0.0001). The presence of 1 μM metformin in the organ cultures maintained at 10 mM glucose resulted in a concentration-response curve that overlapped with the response curve observed in the absence of metformin (solid diamonds for 10 mM glucose alone, Fig. 1, B and D; not shown for 10 mM glucose plus metformin but plotted for Emax in Fig. 1, F and G). The ability of metformin to prevent hyperglycemia-induced dysfunction was observed up to a maximal concentration of 100 μM (unpublished data). However, surprisingly, a high concentration of metformin (500 μM or higher: solid squares, Fig. 1, C and E) not only failed to improve the vasorelaxant action of acetylcholine (Fig. 1C, solid squares) and 2fLI (Fig. 1E, solid squares) for tissues cultured under hyperglycemic conditions (25 mM glucose) but reduced the maximal relaxation response from 40% to 20% (Fig. 1, C and E: P < 0.05). All of the vasorelaxant responses in the tissues cultured under all conditions were abolished in the presence of 1 mM L-NAME, indicating the dependence on endothelial eNOS. The ability of 1 μM metformin to preserve vascular vasodilator function in hyperglycemia-exposed tissues is summarized by the histograms in Fig. 1, F and G showing the responses at near maximally active concentrations of acetylcholine and 2fLI (1 μM). In sum, our data showed that metformin in the concentration range from 1 to 100 μM was able to preserve endothelial function for tissues maintained at high glucose concentrations, whereas higher concentrations of metformin (≥250–500 μM) did not (Fig. 1, B and E; unpublished data).
2. An Nr4a1 Antagonist Reverses the Ability of Metformin to Attenuate Hyperglycemia-Induced Vascular Endothelial Dysfunction as Assessed by a Tissue Bioassay
To assess the possible link between metformin action and the orphan nuclear receptor Nr4a1, an Nr4a1 antagonist, TMPA, was used (Zhan et al., 2012). As shown in Fig. 2, B and C (solid squares, B; solid diamonds, C), when tissues maintained under hyperglycemic conditions (25 mM glucose) were treated with metformin in the concurrent presence of TMPA (50 μM, Fig. 2, B and C), the vasorelaxation responses caused by Ach and 2fLI were not significantly increased (P > 0.05) by metformin, as was observed for the data shown in Fig. 1 obtained for tissues incubated with metformin in the absence of TMPA. The antagonist action thus pointed to a direct link between the actions of metformin and the function of Nr4a1 in the tissues.

An Nr4a1 antagonist reverses the ability of metformin to attenuate hyperglycemia-induced vascular endothelial dysfunction as assessed by a tissue bioassay. (A) Scheme outlining the protocol to demonstrate the block by the Nr4a1 antagonist, TMPA, of the protective effect of metformin to preserve endothelial dysfunction after culture of WT aortic rings in 25 mM glucose. (B) Concentration-effect curves for ACh-induced relaxations in wild-type aortic rings cultured in 25 mM glucose and 50 µM TMPA without or with 1 µM metformin for 48 hours. (C) Concentration-effect curves for 2fLI-induced relaxations in wild-type aortic rings cultured in 25 mM glucose without or with 1 µM metformin for 48 hours in the absence (open and solid squares) or presence of 50 µM TMPA (solid diamonds). Data points represent the mean ± S.D. (bars) for n = 8. Error bars smaller than the symbols are not shown. As per Figure 1, metformin preserved hyperglycemia-compromised vasodilator function for 2fLI vasodilation [solid squares, compared with open squares, (C): P < 0.05], whereas TMPA prevented the metformin effect to preserve both ACh and 2fLI vasodilation [(B), open squares versus solid squares and (C), open squares vs. solid diamonds) with no significant difference between metformin-untreated tissues and tissues treated with metformin in the presence of TMPA (ns: P > 0.12). ns, not significant.
3. Metformin Does Not Prevent Hyperglycemia-Induced Endothelial Dysfunction in Organ Cultures of Aorta Tissue from Nr4a1-Null Mice
To explore further the link between Nr4a1 and the ability of metformin to preserve vascular endothelial function in the setting of hyperglycemia, we used aorta ring preparations obtained from Nr4a1-null mice that were maintained in hyperglycemic organ cultures with or without metformin. Both acetylcholine and 2fLI were able to cause vasorelaxation in the Nr4a1-null tissues. The sensitivity of the Nr4a1-null tissues was comparable to that of the wild-type tissues, with the mean relaxant responsiveness to 1 μM acetlycholine of the Nr4a1-null tissues being 80% of the response of the wild-type tissues lower (solid squares vs. open squares, Fig. 3A). The maximal relaxant response of the Nr4a1-null tissues to 1 μM 2fLI did not differ from the wild-type tissues (Fig. 3B). Thus, the Nr4a1-null–derived tissues were fully functional in terms of their endothelium-dependent vasorelaxant responses, which were at a level comparable to the function of the wild-type tissues. Furthermore, all vasorelaxant responses in the Nr4a1-null tissues were blocked by L-NAME combined with the guanylyl cyclase inhibitor, [1H-[1,2,4]oxadiazolo-[4, 3-a]quinoxalin-1-one] (unpublished data).

Aorta tissues from Nr4a1-null mice display comparable muscarinic/acetylcholine and PAR2 (2-fLI)-mediated vasorelaxation compared with wild-type tissues and express lower levels of eNOS. Freshly isolated aorta rings from either WT (open squares) or Nr4a1-null mice (solid squares) were constricted with 2.5 µM phenylephrine, and the relaxant effects of increasing concentrations of the ACh (A) or the PAR2-selective peptide agonist 2fLI (B) was measured as described in methods. (C) Representative Western blot analysis showing the total eNOS in aortic segments from Nr4a1-null and WT mice relative to the signal for β-actin. D) Histograms showing the abundance of eNOS relative to the β-actin signal as measured by densitometry for aorta tissues from WT (right-hand histogram) and from Nr4a1-null mice (left-hand histogram). Individual data points are shown in the histograms ± S.D. (D) P = 0.034, comparing total eNOS in WT vs. Nr4a1-null tissues (n = 5).
The impact of hyperglycemia on the endothelium-dependent vasorelaxant responses in the Nr4a1-null tissues maintained in organ cultures was next evaluated. As shown in Fig. 4, elevated glucose concentrations (25 mM versus 10 mM) did not significantly reduce the maximal relaxant response of Nr4a1-null tissues to 1 μM Ach (compare open diamonds versus open squares, Fig. 4B, P > 0.05) as it did for the wild-type tissues (Fig. 1B). Furthermore, in contrast with the wild-type tissues (Fig. 1, B and D), the presence of metformin in the hyperglycemic cultures of the Nr4a1-null tissues did not improve the endothelial vasorelaxant actions of either acetylcholine or 2fLI (Fig. 4, C and E, solid squares vs. open squares: P > 0.05) as it did for the tissues from the wild-type mice (Fig. 1, B and D). These data supported the conclusion obtained using the Nr4a1 antagonist TMPA that Nr4a1 itself plays a key role for the ability of metformin to improve endothelial vasorelaxant function in the setting of hyperglycemia.

Metformin does not improve hyperglycemia-reduced vasorelaxant responses in Nr4a1-null tissues. A) Scheme showing the time frame for organ culture of Nr4a1-null aorta rings in 10 or 25 mM glucose, with (solid symbols) or without (open symbols) either 1 or 25 µM metformin prior to wire myograph bioassays (B–E). (B and C) Concentration-effect curves for acetylcholine-induced vasorelaxation in Nr4a1-null aortic rings cultured in 10 or 25 mM glucose without or with 1 µM (B) or 25 µM metformin (C) for 48 hours. (D and E) Concentration-effect curves for 2fLI-induced vasorelaxation in Nr4a1-null aortic rings incubated in 10 or 25 mM glucose, without or with either 1 µM (D) or 25 µM (E) metformin for 48 hours. Data are presented as mean ± S.D. (bars) for n = 6 for each group. Error bars smaller than the symbols are not shown. ns, no significant difference in maximal vasorelaxant responses between untreated and metformin-treated tissues (P = 0.2). ns, not significant.
4. Metformin Administered In Vivo Preserves Vascular Endothelial Vasorelaxant Function in Aorta Tissues from Streptozotocin-Induced Hyperglycemic Wild-Type but Not in Tissues from Hyperglycemic Nr4a1-Null Mice
In view of the ability of metformin to preserve endothelial function in the hyperglycemic murine vascular in vitro organ culture system for wild-type animals (Fig. 1) but not for Nr4a1-null mice (Fig. 4), we sought to determine whether vascular endothelial function could be preserved in the setting of streptozotocin-induced diabetic hyperglycemia in vivo, as outlined by the scheme in Fig. 5A. The ambient blood glucose concentrations in the streptozotocin-treated wild-type and Nra1-null animals were the same and were greater than 30 mM compared with about 10 mM in the control STZ-untreated mice. There was no statistical difference between the blood glucose levels in the metformin-treated versus the untreated STZ-diabetic animals. In accordance with data obtained previously using a male mouse streptozotocin model (Furman, 2015), the maximal endothelium-dependent vasorelaxant actions of ACh and 2fLI (50%–60% relaxation) measured in vitro for aorta rings isolated from these STZ-diabetic mice and measured in vitro for both acetylcholine and 2-fLI were both diminished compared with the responses of tissues obtained from euglycemic mice (>80% relaxation: compare open diamonds and open squares in Fig. 1, B and D with open circles in Fig. 5, B and D). However, the vasorelaxant actions of both acetylcholine and 2-fLI were markedly improved in aorta tissues obtained from the metformin-treated animals compared with untreated wild-type STZ-diabetic animals (Fig. 5, B and D: compare open versus solid circles; Fig. 5, F and G, compare first and second histograms from left). Thus, the mean increases for the tissue maximal relaxation responses caused by acetylcholine and 2fLI for metformin-treated versus untreated animals (Fig. 5, F and G) were, respectively, 26% (95% confidence interval, 21%–32%, P < 0.0001) and 17% (95% confidence interval, 6%–27%, P = 0.0013). In contrast, the vasorelaxant actions of both acetylcholine and 2-fLI were the same for aorta rings obtained from the STZ-diabetic Nr4a1-null animals whether or not the animals were treated with metformin (Fig. 5, C and E: compare open squares with solid squares; third and fourth histograms from the left, Fig. 5, F and G). The mean difference in the maximal relaxant responses caused by ACh and 2fLI in tissues from the STZ-diabetic Nr4a1-null mice, whether or not they were treated with metformin (Fig. 5, F and G), were, respectively, 0.6% (95% confidence interval, 3%–4%) and 9.4% (95% confidence interval, 2.4%–21%). There was no statistical difference in the vasorelaxation responses for the Nr4a1 tissues whether the animals were treated or not with metformin (Fig. 5, F and G; adjusted P values for ACh, P = 0.96, and for 2fLI, P = 0.14). To conclude, metformin administered in vivo was able to improve vascular endothelial vasorelaxant function in the setting of streptozotocin-induced hyperglycemia but only for mice expressing Nr4a1.

Metformin treatment in vivo improves acetylcholine and PAR2 (2fLI)-mediated vasorelaxation in aortic ring preparations from wild-type but not from Nr4a1-null STZ-induced diabetic mice. Aorta rings from either wild-type (B and D) or Nr4a1-null (C and E) streptozotocin-diabetic mice, treated or not with metformin in vivo according to the schema in (A) were isolated after 2 weeks of metformin treatment and evaluated by wire myography for their vasorelaxant responses to increasing concentrations of either ACh (B and C) or 2fLI (D and E), as described in Methods. Data for the concentration-effect curves represent the mean relaxation responses ±S.D. (bars) for 6 independently assayed aorta rings. *P < 0.05, comparing the relaxant responses to either ACh or 2fLI for tissues from untreated versus metformin-treated wild-type mice. The differences in the maximal tissue relaxant responses (%PE) to ACh and 2fLI between the wild-type metformin-treated versus untreated STZ mice were 26% PE tension for acetylcholine-mediated relaxation (95% confidence interval, 21–32% PE, P < 0.0001) and 17% for 2fLI/PAR2-mediated relaxation (95% confidence interval, 6%–27% PE, P = 0.0012). The histograms in (F and G) show the average increases ±S.D. in vasorelaxation at maximally active concentrations (1 µM) of ACh (F) and 2fLI (G) as shown in (B to E) for the tissues derived from the wild-type metformin-treated STZ-diabetic animals [second histogram from left, (F and G)] compared with the untreated STZ diabetic wild-type mice [first histogram on left, (F and G)] [P < 0.0001, comparing metformin-treated versus untreated wild-type mice, as per (B and D)]. In contrast, the relaxation responses for the tissues from the Nr4a1-null–derived tissues did not differ statistically (P = 0.96 for ACh; P = 0.11 for 2fLI) whether the mice were treated with metformin [(F and G), third and fourth histograms from left]. ns, not significant.
5. Metformin’s Ability to Prevent Hyperglycemia-Induced ROS Production in Cultured Aorta-Derived Endothelial Cells Is Blocked by an NR4A1 Antagonist
In keeping with our published work (El-Daly et al., 2018), it is generally accepted that hyperglycemia causes endothelial dysfunction by the generation of ROS (Brownlee, 2001; Shah and Brownlee, 2016). Furthermore, it has been reported that metformin can decrease the intracellular production of ROS in cultured bovine aorta-derived endothelial cells (Ouslimani et al., 2005). Therefore, using cultures of mouse aorta-derived endothelial cells, as in our previous work (El-Daly et al., 2018), the production of reactive oxygen species was monitored in cells exposed to 25 mM versus 5 mM glucose (Fig. 6). In accordance with the data obtained previously using bovine aorta-derived endothelial cells (Ouslimani et al., 2005), high glucose concentrations led to a marked increase in ROS (Fig. 6, GFP signal, top panels, B and C), that was not observed for cells cultured at 5 mM glucose (Fig. 6, E and F). The increase in ROS observed in the presence of 25 mM glucose was suppressed for cells cultured in the concurrent presence of 50 μM metformin (Fig. 6, H and I). However, the Nr4a1 antagonist TMPA was able to reverse the ability of metformin to eliminate the production of ROS in the presence of 25 mM glucose (Fig. 6, K and L). Morphometric analysis comparing images like those shown in Fig. 6, B and K indicated that TMPA was able to reverse the effect of metformin up to about 40% of the ROS fluorescence yield observed in the absence of both metformin and TMPA (Fig. 6B). For reasons we were not able to determine, the elevation of ROS, as indicated by the CellROX green reagent, was quite variable, frequently yielding lower signals than those shown for the representative experiment illustrated in Fig. 6, B and C. Notwithstanding, the presence of metformin uniformly reduced the hyperglycemia-induced increase in ROS. Furthermore, we assessed the ability of metformin to prevent the hyperglycemia-induced increase in ROS in mouse microvascular endothelial cells (MMECs) as opposed to those derived from aorta. As shown in Supplemental Fig. 2, metformin was also able to reduce the abundance of ROS in MMECs exposed to hyperglycemia, as indicated by the reduction in the dihydroethidium reactivity.

Metformin’s ability to prevent hyperglycemia-induced ROS production in cultured aorta-derived endothelial cells is blocked by an NR4A1 antagonist, TMPA. Wild-type mouse aorta-derived primary endothelial cell cultures were incubated as outlined in Methods, with either 25 mM (A–C; G–L) or 5 mM glucose (D–F) in the absence (A–F) or presence (G–L) of 50 µM metformin. The metformin-treated cultures also did (J–L) or did not (G–I) contain the Nr4a1 antagonist TMPA. Increased cellular ROS observed after 1 hour was indicated by increased Cell-ROX green fluorescence. Nuclei are stained blue with DAPI: 4′,6-diamidino-2-phenylindole. The presence of TMPA clearly reversed the ability of metformin to suppress ROS up to a level of about 40% of the signal observed in the cells exposed to high glucose in the absence of either metformin or TMPA (B).
6. Metformin Does Not Attenuate Hyperglycemia-Induced ROS in Cultured Endothelial Cells from Nr4a1-Null Mice
In contrast with the ability of metformin to attenuate the production of ROS in primary mouse aortic endothelial cells from wild-type mice exposed to 25 mM glucose (Fig. 6, compare B with H, and in Fig. 7, compare A with B and C), metformin was not able to eliminate ROS in the Nr4a1-null–derived endothelial cells exposed to 25 mM glucose (Fig. 7, compare D with E and F). Although the wild-type and Nr4a1-null cells grew to different cell densities, the fluorescence yield data showed that metformin was able to reduce ROS fluorescence in the wild-type cells (Fig. 7G, 3nd and 4th histograms from left). The mean reduction caused by metformin for the wild-type cells treated with 25 mM glucose (Fig. 7G, 3rd and 4th histograms from left) was 32,600 fluorescence units (95% confidence interval, 18,100 to 63,300 units; adjusted P value for the difference between untreated and metformin treated wild-type cells, <0.018). In contrast, for the Nr4a1-null cells maintained at 25 mM glucose (Fig. 7G, 5th and 6th histograms from left), the mean fluorescence difference caused by metformin relative to Nr4a1-untreated cells was 15,600 fluorescence units (95% confidence interval, 29,000–30,000 units). The adjusted P value for the difference between metformin-treated versus untreated Nr4a1-null cells was >0.99, indicating no significant effect of metformin for the Nr4a1-null cells. Even at a low glucose concentration (5 mM) the Nr4a1-null–derived endothelial cells showed detectable ROS activity compared with the wild-type cells (compare A and D, Fig. 7). In sum, the cell fluorescence measurements showed that although 5 μM metformin was able to reduce the increase in the CellROX signal in the wild-type endothelial cells, it was not able to diminish the fluorescence signal in the Nr4a1-null cells (histograms, Fig. 7G, 5th and 6th histograms from left, P > 0.99). Taken together, the data indicated that the action of Nr4a1 is linked not only to the ability of metformin to preserve vascular endothelial vasorelaxant function in intact tissues exposed to hyperglycemia (above) but also to the ability of metformin to attenuate the production of endothelial ROS caused by elevated concentrations of glucose in endothelial cell cultures.

Metformin reduces intracellular ROS in wild-type but not Nr4a1-null aortic endothelial cells. WT (A to C) or Nr4a1-null (D to F) aorta-derived endothelial cells were incubated for 24 hours with either 5mM or 25mM glucose (G), without (A, B, D, and E) or in combination with (C and F) 5 μM metformin. Increased ROS is indicated by increased Cell-ROX green fluorescence; nuclei are stained blue with DAPI: 4′,6-diamidino-2-phenylindole. The histograms in (G) show the corrected “green” fluorescence intensity (arbitrary units) calculated by fluorescence yield analysis of at least six equivalent fields from three independent microscopic images, as outlined in Methods. Although the wild-type and Nr4a1-null cells grew to different cell densities, the fluorescence yield data showed that metformin was able to reduce ROS fluorescence in the wild-type cells (third and fourth histograms from left) but not in the Nr4a1-null cells (fifth and sixth histograms from left). * P = 0.018 (Dunnett’s multiple comparison) for the reduction of fluorescence for wild-type cells in 25 mM glucose with metformin, compared with metformin-untreated cells. There was no significant difference in fluorescence for Nr4a1-null cells cultured in 25 mM glucose treated or not with metformin (P > 0.99: Dunnett’s multiple comparison).
7. Metformin-Preservation of Hyperglycemia-Impaired Mitochondrial Oxygen Consumption Rate in Aorta Ring Organ Cultures and Cultured Aorta-Derived Endothelial Cells Is Nr4a1-Dependent
Although the precise mechanism whereby metformin enhances insulin action is uncertain, it has been suggested that metformin’s antidiabetic effects may relate to its ability to compromise mitochondrial complex I function (discussed by Kinaan et al., 2015; Triggle and Ding, 2017). Of note, it has been pointed out that the impact on mitochondrial complex I function observed in vitro is found only at metformin concentrations more than an order of magnitude higher (e.g., 500 μM) than those plasma levels (about 20 μM) observed for individuals treated with metformin (Kinaan et al., 2015; Triggle and Ding, 2017). We therefore evaluated the impact of hyperglycemic conditions (25 mM glucose) on the oxygen consumption rate for intact aorta ring tissues (Fig. 8, A and B) and cultured endothelial cells (Fig. 8C) in the absence (solid blue or black circles, Fig. 8, A and C) and presence (solid red or magenta symbols, Fig. 8, A and C) of metformin at a concentration in the range that we found to protect the endothelium from hyperglycemia-induced dysfunction and to prevent hyperglycemia-induced endothelial ROS production (between 1 and 50 μM metformin: see Figs. 1 and 6).

Metformin improves the OCR in wild-type but not in Nr4a1-null mouse aortic segments and endothelial cells exposed to hyperglycemia. Aorta rings from either wild-type (A) or Nr4a1-null mice (B), with the endothelium side facing up in the Seahorse chamber were incubated with 25 mM glucose for 24 hours without (solid blue circles) or with (solid red squares) metformin, and the OCRs were measured as in Methods. The OCR shown on the y-axis was normalized to the protein content of the tissues using wave software as in Methods. (C) Primary replicate monolayer cultures of endothelial cells derived from either wild-type (red and blue symbols) or Nr4a1-null mice (magenta and black symbols) were maintained under hyperglycemic conditions (25 mM glucose) for 24 hours in the absence (blue and black solid circles) or presence (red and magenta squares) of 10 μM metformin. The OCRs of six replicate monolayers were then measured as outlined in Methods. Values represent the mean ± S.D. (bars) for n = 6 for each timed data point calculated by the Seahorse software. *P = 0.001, comparing wild-type tissues maintained in 25 mM G/24 hours + 10 μM metformin vs. wild-type tissues maintained without metformin in 25 mM G/24 hours in (A); *P = 0.001in (C), comparing wild-type endothelial monolayers maintained in 25 mM G/24 hours + 10 μM metformin vs. wild-type cell monolayers maintained without metformin. Also, P = 0.001, comparing metformin-treated wild-type cells [red symbols, (C)] with Nr4a1-null cell monolayers maintained in 25 mM G/24 hours without or with 10 μM metformin [black and magenta symbols, (C)]. Metformin failed to cause a statistically significant increase in the oxygen consumption rate for tissues or cells derived from the Nr4a1-null mice [compare red vs. blue symbols in (B) (P = 0.18) and magenta vs. black symbols in (C) (P = 0.20)]. G, glucose.
As shown in Fig. 8A, in isolated aortic rings from wild-type mice maintained in 25 mM glucose, metformin (10 μM: solid red squares) increased the mitochondrial oxygen consumption rate by about 2-fold from level caused by hyperglycemia in the absence of metformin (Fig. 8A: compare solid blue with solid red symbols). A comparable effect of metformin was observed in wild-type aorta ring–derived cultured endothelial cells exposed to 25 mM glucose (Fig. 8C: compare solid blue versus solid red symbols). Thus, a concentration of metformin that preserves endothelial function both in intact tissues and in endothelial cultures improves rather than compromises mitochondrial function. The basal oxygen consumption rates in the tissues and endothelial cells derived from the Nr4a1-null mice maintained in hyperglycemic 25 mM glucose were in the same range as the rates for the wild type–derived samples (blue circles, Fig. 8B; black circles, Fig. 8C). However, metformin (10 μM) failed to improve the oxygen consumption rate either in hyperglycemia-maintained aorta ring segments or for hyperglycemia-exposed endothelial cell cultures obtained from the Nr4a1-null mice (Fig. 8B, compare blue and red symbols; Fig. 8C, compare black and magenta symbols). Thus, Nr4a1 was required to enable metformin to rescue the mitochondrial oxygen consumption rate that was diminished by hyperglycemia.
We also found in wild-type tissues maintained under hyperglycemic conditions (25 mM glucose) that the addition of 10 μM metformin improved the basal oxygen consumption rate, indicating that metformin at this concentration did not affect mitochondrial complex I to reduce the oxygen consumption rate. Also, the cellular respiration parameters indicating the ability to respond to stress, such as spare respiratory capacity, were improved. Moreover, the mitochondrial structural integrity as indicated by proton leak and the total ATP production remains unaffected (Supplemental Fig. 3, A and B). However, in Nr4a1-null tissues, glucose affected the mitochondrial respiration at the level of basal respiration. The Nr4a1-null tissues could not withstand the 25mM glucose incubation (Supplemental Fig. 3C) and metformin had little or no impact on the basal oxygen consumption rate. Nonetheless, we found no difference in ATP production or spare respiratory capacity (Supplemental Fig. 3, C and D). These data indicate that Nr4a1 is a critical factor for the function of metformin.
8. Endothelial Mitochondrial Complex I and III Function Are Compromised by High (500 μM) but Not Low (10 μM) Concentrations of Metformin, and Complex IV Functions Are Improved at the Low Metformin Concentration
To verify the differences in the impact of high (500 μM) versus low (10 μM) metformin concentrations on endothelial mitochondrial function, the cultured endothelial cell oxygen consumption rates were measured for cells exposed to 25 mM glucose in the absence or presence of either 10 μM or 500 μM metformin (Fig. 9, A–H), and cellular oxygen consumption rates were monitored (Fig. 9). The protocols shown in the figure evaluated the effects of metformin on mitochondrial complex functions I to IV in cultured endothelial cell samples exposed to 25 mM glucose. Metformin (10 μM) had no effect on complexes I and III (P = 0.95, Fig. 9C, solid red squares versus solid blue circles and middle histograms, Fig. 9, E and G). Furthermore, neither 10 nor 500 μM metformin affected complex II (Fig. 9F). For complex IV, 10 μM metformin increased the mean oxygen consumption rate by 141 pmol/min (Fig. 9H, P = 0.009, 95% confidence interval, 33–250 pmol/min). However, 500 μM metformin did not affect complex IV (P = 0.99). The 10 μM metformin-mediated increase in complex IV function enhanced mitochondrial spare respiratory capacity. This increase in principle may promote cell survival. In sum, 10 μM metformin had no effect on complexes I and III but increased the OCR for complex IV.

Metformin at a concentration that prevents endothelial oxidative stress (10 μM) does not affect complex I and complex III oxygen consumption rates in mouse aortic endothelial cells. (A–B) Scheme showing the experimental procedures done to study the mitochondrial complex–mediated respiration in primary cultures of wild-type mouse aortic endothelial cells. (C and D) Cells were assessed for mitochondrial OCR upon maintaining them in 25 mM glucose (G) per 24 hours in the absence (solid blue circles) or presence of either 10 μM (solid red squares) or 500 μM (magenta triangles) metformin. (E–H) Quantification of the OCR for complexes I–IV shows that 10 μM metformin does not affect complexes I and III, whereas at 500 μM, metformin reduces the oxygen consumption rate by 40% to 50% for both complexes I and III [(E and G) P = 0.0053 when comparing cells maintained in 25 mM G/24 hours without or with 10 μM metformin versus cells in 25mM G/24 hours+ 500 μM metformin]. Neither concentration of metformin affected the complex II OCR [(F) P > 0.3]. (H) Metformin at 10 μM but not 500 μM increased the complex IV OCR for cells maintained in 25mM glucose (G)/24 hours (P = 0.009, Tukey’s multiple comparison). Histograms show the mean ± S.D. (bars) for n = 5 replicate monolayers.
In contrast with the low metforminFig. 10. concentration, 500 μM metformin, as expected from published data, reduced the basal oxygen consumption rates for complexes I and III (Fig. 9C, magenta triangles; Fig. 9, E and G, right-hand histograms). The ability of 500 μM metformin to cause cell death has been reported elsewhere (Szabo et al., 2014; Samuel et al., 2017; Fontaine, 2018; Triggle et al., 2020). These data support the conclusion that the lower concentration of metformin functions differentially in response to hyperglycemia compared with the high metformin concentration and does not affect complex I mitochondrial oxidative phosphorylation as does 500 μM metformin.
Figure 9: metformin at a concentration that prevents endothelial oxidative stress (10μM) does not affect Complex I and Complex III oxygen consumption rates in mouse aortic endothelial cells.
These data led us to assess the impact of low (10 μM) and high (500 μM) concentrations of metformin on the extracellular acidification rate (Supplemental Fig. 4) providing us a snapshot of glycolysis. We found that 500 μM metformin treatment caused a basal increase in extracellular acidification rate compared with 10 μM metformin treatment, eventually contributing to a reduction in glycolysis, thereby pointing to a differential role of 10 μM metformin in the context of hyperglycemia. These data indicate that cellular metabolism is dampened by 10 μM metformin, whereas 25 mM glucose alone or in combination with 500 μM metformin has an adverse impact on glycolysis.
9. Mitochondrial Morphology Is Changed by ExposingFig. 11. Cells and Tissues to Hyperglycemia, and This Change Is Prevented by Metformin
Figure 9: metformin at a concentration that prevents endothelial oxidative stress (10μM) does not affect Complex I and Complex III oxygen consumption rates in mouse aortic endothelial cells.
It has been known for over 40 years that mitochondrial morphology changes from a spindle to circular shape, which is indicative of an increased mitochondrial metabolic state (Hackenbrock, 1966). We therefore monitored mitochondrial structure via electron microscopy to evaluate the impact of hyperglycemia on organelle shape in the setting of hyperglycemia, which induces the production of ROS and to assess the effect of metformin on hyperglycemia-induced changes in mitochondrial morphology (Fig. 12). We observed that the wild-type cells cultured in the presence of 5 mM glucose for 24 hours displayed large numbers of elongated “spindle-shaped” mitochondrial structures with visible cristae (yellow arrows, Fig. 12A) along with a proportion of mitochondria showing a “circular” shape (green arrows, Fig. 12A). However, compared with exposure to 10 mM glucose, cells incubated under hyperglycemic conditions (25 mM glucose for 24 hours) displayed a much higher proportion of mitochondria with “circular” shapes (green arrows) compared with elongated “spindle” shapes (yellow arrows, Fig. 12B). In contrast, in the concurrent presence of 10 μM metformin, the mitochondrial morphology of endothelial cells exposed to 25 mM glucose showed a more “normal” proportion of elongated “spindle-shaped” phenotype (compare Fig. 12, C and B), reflecting the abundance relative to the circular morphology observed at a low glucose concentration (Fig. 12A). Morphometric analysis was done to evaluate the impact of hyperglycemia on mitochondrial shape, that reflects oxidative activity (Hackenbrock, 1966). The manual count of circular and spindle-shaped mitochondria in equivalent image fields of a set of six independent micrographs like the ones shown in Fig. 12, A–D revealed a differential abundance of spindle-shaped versus circular-shaped mitochondria under the different conditions (Fig. 12E). There was an increase in the relative abundance of circular versus spindle-shaped mitochondria when cells were switched from low (10 mM) to high (25 mM) mM glucose (compare the two histograms on the left in Fig. 12E). As a result, the ratio of spindle-shaped to circular-shaped mitochondria was markedly reduced [High glucose (HG) , asterisk, Fig. 12E]. However, the presence of 10 μM metformin (M) in the hyperglycemic cultures (HG+M,10, Fig. 12E) prevented the increase in circular-shaped mitochondria caused by hyperglycemia raising the ratio of spindle/circular phenotypes (compare first and third histograms from the left in Fig. 12E). Surprisingly, treatment with 500 μM metformin (HG+M,500, Fig. 12E) led to a predominance of mitochondria with a circular shape and a reduced ratio of spindle/circular morphology (green arrows, Fig. 12D; right-hand histogram, Fig. 12E), which is indicative of oxidative stress. The morphology changes can be correlated with the changes in the oxygen consumption rates shown in Fig. 8, A and C. Thus, the impact of metformin at low concentrations to improve the oxygen consumption rate of hyperglycemia-exposed endothelial cells was reflected by its impact on mitochondrial morphology, and the morphology effect of a high metformin concentration was in agreement with the effect of 500 μM metformin to impair the oxygen consumption rate. Taken together, these data show that at concentrations of metformin that reverse the ability of hyperglycemia to compromise the mitochondrial oxygen consumption rate and that preserve vascular endothelial vasodilator function in the setting of hyperglycemia, metformin also preserves the morphology of mitochondria observed under euglycemic conditions.

Metformin treatment preserves mitochondrial integrity in aortic endothelial cells exposed to hyperglycemia. (A–D) Electron microscopic images of wild-type primary cultures of aorta-derived endothelial cells incubated with 10 mM [low glucose: (A)] or 25 mM [high glucose: (B–D)] glucose concentrations for 24 hours in the absence (A and B) or presence of either 10 μM (C) or 500 μM (D) metformin. Circular and spindle-shaped organelles of different area size were observed (F). Baseline “spindle” mitochondrial morphology comprising elongated structures with visible cristae are denoted with yellow arrows. Circular morphology indicative of increased oxidative activity and increased mitochondrial fission is denoted by green arrows. A reduced ratio of spindle-to-circular structures is associated with increased oxidative stress. The ratio was calculated as outlined in Materials and Methods [histograms, (E)] to quantify the reduction in the ratio of spindle/circular mitochondria that was caused by a switch from low (10 mM; LG) to high glucose (25 mM; HG), as shown in (E) (compare first and second histograms from left: *P < 0.05). Under high glucose conditions, the presence of 10 μM [HG+M,10: third histogram from left, (E)] but not 500 μM metformin [HG+M,500: fourth histogram from left, (E)] increased the ratio of spindle/circular mitochondria [(E): compare third and fourth histograms from the left with second histogram from left: *P < 0.05]. (F) shows the two-dimensional size measure of circular and spindle shaped mitochondria in the different images (averages ± S.D.: in arbitrary units, A.U.: P = 0.03, comparing the areas of spindle to circular-shaped mitochondria). Data represent the mean ratios [green/yellow images, (A–D)] ± S.D. (bars) from measurements done for equivalent image areas for at least 6–10 cells per condition.
10. “Rescue” of Aorta Rings Exposed to Hyperglycemia for 48 Hours and Then Treated with Metformin Either for 12 Hours in Organ Culture or for 2 to 3 Hours in the Organ Bath
Since endothelial vasorelaxant function was compromised when tissues were maintained under hyperglycemic conditions but preserved when metformin was present in the culture medium (Fig. 1, B and D), it was of interest to determine whether metformin could also reverse the impact of hyperglycemia if added at 48 hours after the initiation of hyperglycemia instead of at the beginning of the culture period. As shown in Fig. 13, A–C, metformin was added or not to the organ cultures that had already been exposed to hyperglycemia for 48 hours, and metformin was allowed to act for a further 12 hours prior to evaluating the vasorelaxant actions of acetylcholine and the PAR2 agonist 2fLI, as outlined in Methods (Fig. 13, B and C). As expected, after 48 hours of hyperglycemia, the metformin-free tissues were poorly responsive up to agonist concentrations in the micromolar range in terms of their vasorelaxant responses (solid squares, Fig. 13, B and C). However, metformin treatment of tissues that had already been exposed to hyperglycemia (open and half-filled squares, Fig. 13, B and C) restored the vasorelaxant responses.

Metformin rescues endothelial vasorelaxant action subsequent to hyperglycemia- induced dysfunction either after long (12-hour) or short (2–3-hour) incubation times. As shown by the schema in (A), intact vascular organ cultures were maintained for 48 hours under hyperglycemic conditions (25 mM glucose) and were then supplemented or not by the addition of either 1 or 10 μM metformin for a further 12 hours. Tissues were then recovered from the culture medium and evaluated for the vasorelaxant actions of ACh (B) and 2fLI (C). (D and E) After exposure to hyperglycemia for 48 hours in the absence of metformin as shown in (A), aorta rings were harvested and mounted in the organ bath and equilibrated as for a bioassay, as described in Methods. Metformin (100 μM) was then added to the organ bath, and the vasodilator actions of ACh (D) and the PAR2 agonist [2fLI, (E)] were measured over a 2–4-hour time frame as described in Methods and as illustrated in (B and C). Relaxant responses (% of tension generated by PE) represent the mean ± S.D. (bars) for measurements done with six independently assayed tissue rings. Error bars smaller than the symbols are not shown. *P < 0.05 for comparing wild-type tissues treated or not with metformin for all panels.
In addition, tissue rings that had been cultured for 48 hours under hyperglycemic conditions (25 mM glucose) were mounted in the organ bath to which metformin was then added or not, and the vasorelaxation responses to acetylcholine and 2fLI were measured after a 2–3-hour incubation time (Fig. 13, D and E). As shown in Fig. 13, D and E, even this relatively short incubation time with metformin restored the vasodilator responses to acetylcholine (Fig. 13D, open squares) and the PAR2 agonist 2fLI (Fig. 13E, solid squares) compared with tissues that were not treated with metformin (*P < 0.05, square symbols vs. solid circles, Fig. 13, D and E). Thus, the action of metformin can be seen to be both “prophylactic” and “therapeutic” in terms of protecting the endothelium from hyperglycemia-induced vasorelaxant dysfunction by treating the tissues either before or after they are exposed to hyperglycemia.
11. Metformin at a Concentration that Preserves Vascular Endothelial Function Increases AMPKinase Phosphorylation
Because the actions of metformin have been attributed to its activation of AMPKinase (Hawley et al., 2002; Kukidome et al., 2006; Wang et al., 2019), we sought to determine whether the same concentration of metformin that could rescue endothelial function in intact vascular tissue could activate AMPKinase in isolated aortic endothelial cells incubated under hyperglycemia conditions, with this being followed by 10 μM metformin treatment. Western blot analysis showed that this concentration of metformin caused an increase in phospho-AMPK that was up to 50% of the level stimulated by the AMPKinase agonist AICAR (Fig. 14, A and B). Our results, in keeping with the data of Kukidome et al. (2006) and Wang et al. (2019), support the likelihood that 10 μM metformin is sufficient to activate phospho-AMPK, as does 500 μM metformin treatment. However, the 500 μM metformin concentration that activates AMPKinase at a higher level than 10 μM metformin not only compromises mitochondrial complex I function (Fig. 9E) but also fails to prevent hyperglycemia-induced endothelial dysfunction (Fig. 1, C and E). Thus, both low and high concentrations of metformin were able to activate AMPK, but only the low concentration of metformin was able to reverse hyperglycemia-compromised endothelial vasodilator function. A direct link between the level of AMPK activation and the ability of metformin to preserve hyperglycemia-induced endothelial dysfunction could not therefore be established.

Metformin activates AMPKinase at concentrations that both protect and impair endothelial cell function. Based on the endothelial-protective action of metformin at 10 μM, which does not affect mitochondrial complex I, and the endothelial-impairing action of 500 μM metformin, which inhibits mitochondrial complex I, the impact of metformin on AMPKinase activation-phosphorylation in cultured endothelial cells was assessed by Western blot analysis as outlined in Methods at concentrations of both 10 and 500 μM (A and B). Densitometry measurements of the activation/phosphorylation of AMPKinase normalized to the β-actin signal illustrated in the representative gel in (A), are shown by the histograms in (B). Metformin (10 μM) increased the AMPK phosphorylation ratio by 0.27 units [95% CI 0.04–0.50; P = 0.034, comparing 25 mM glucose minus/plus 10 μM metformin, Tukey’s multiple comparison; second and third histograms from the left, (B)]. At 500 μM, metformin increased the AMPK phosphorylation ratio 0.59 units [95% CI 0.50–0.69; P = 0.0001, comparing 25 mM glucose minus/plus 500 μM metformin; second and fourth histogtrams from left, (B)]. Values for histograms in (B) represent the average densitometric ratio of phospho-AMPK/β-actin ± S.D. (bars) for n = 6. Increased activation of AMPK by its agonist AICAR is also shown in (A and B).
12. Metformin Is Predicted to Interact with NR4A1 by In Silico Modeling
The data described in the previous sections indicating a requirement for the expression of Nr4a1 to enable metformin to protect the endothelium from hyperglycemia-induced dysfunction suggested that, as for other compounds with a structure related to metformin, Nr4a1 might be able to interact directly with metformin. Molecular docking studies have identified an alternative ligand binding site in Nr4a1 in its C-terminal domain that is distinct from the ligand binding pocket in Nr4a1’s “classic” ligand binding domain (Lanig et al., 2015). Additionally, NMR data suggest an interaction of some ligands with the ligand binding pocket in the “canonical” steroid hormone NR4 receptor LBD (Munoz-Tello et al., 2020). In keeping with the results outlined by (Lanig et al., 2015), we found that an in silico docking approach revealed a predicted accurate and preferred metformin docking site in NR4A1 that was the same as the one identified by Lanig et al. (2015) (Fig. 15). The best-docked conformation was selected on the basis of binding affinity and interaction energy parameters. As per the findings of Lanig et al. (2015), metformin was docked in the binding site near N terminus of the C-terminal domain of NR4A1 and showed close interactions with Leu228, Leu178, Val179, and Thr182 [amino-acid residue numbering as per Lanig et al. (2015)]. As shown in Fig. 15B, important interactions were also predicted for Asp137, Pro139, and Pro184. Metformin would thus be predicted to bind closely in the “noncanonical” NR4A1 alternative ligand binding site that is distinct from the “canonical” steroid hormone ligand binding pocket site evaluated by Munoz-Tello et al. (2020) for NR4A2. The predicted interacting amino-acid residues and atoms leading to the metformin-NR4A1 binding interaction are shown in Fig. 15B. The residency of metformin in the ligand binding pocket is shown in Fig. 15C. Strong H-bonds are predicted between metformin and NR4A1. The H-bonds shown persisted during the entire 30-ns simulation. Many of the H-bonds were predicted to persist until the end of the simulation. The docking analysis clearly indicates that metformin could in principle interact closely within the previously proposed Nr4a1 noncanonical alternative ligand binding site described by Lanig et al. (2015). The sequence of this alternative binding site in NR4A1 is very different from the equivalent sequence in the NR4A2 family member (only 23% similarity). However, there is close sequence identity for the alternative ligand binding site between human and mouse NR4A1. In contrast, there is a high degree of sequence similarity between NR4A1 and NR4A2 in their canonical ligand binding domains (>60%). Whether metformin might also interact with the NR4A1 “canonical” ligand binding domain, as assessed with an NMR approach used to evaluate NR4A2/Nurr1 ligand binding (Munoz-Tello et al., 2020), is an issue that must also be considered.

Metformin docks with NR4A1 in silico and the interactions of metformin with NR4A1. (A) Representation of NR4A1 (ribbon model) interacting with metformin (stick model). (B) Active site residues of metformin (ball and stick model) along with bond lengths. (C) Surface representation of Nr4a1 pocket within which metformin binds. The numbering of the proline and aspartic acid residues in (B) is in accord with the numbering used by Lanig et al. (2015). However, in the full-length sequence of NR4A1 (see protein database identifier P22736-1), Asp137 in Fig. 15 = 499D; Pro139 in Fig. 15 = 501P; and Pro184 in Fig. 15 = 546P.
We compared the docking of metformin with another NR4A1 agonist, cytosporone B, which is also known to affect gluconeogenesis (Zhan et al., 2008). As found previously (Zhan et al., 2012) and by us, it was possible to identify a putative docking site for cytosporone B with NR4A1 in the alternative ligand binding site described by Lanig et al. (2015) (Supplemental Fig. 6). Thus, the putative NR4A1 agonists metformin and cytosporone B, both of which are implicated in regulating glucose metabolism, were able in principle to dock with the C-terminal alternative ligand binding site of NR4A1. The conformations of docked metformin, cytosporone B, and the NR4A1 agonist THPN are shown in Fig. 15, Supplemental Fig. 6, and Supplemental Fig. 7, respectively. As mentioned, metformin showed close potential interactions with the defined binding pocket site residues Asp137, Pro139, and Pro184 by forming H-bonds and salt bridges (Fig. 15, B and C). Cytosporone B showed possible interactions with more residues than metformin, including Asn1, Asp137, Pro139, Ala140, Ala179, Glu183, Pro184, and Gln185 (Supplemental Fig. 6, upper panel cytosporone, image B), by forming conventional H-bonds, alkyl bonds, and π-alkyl bonds. The surface representation of cytosporone B is also shown in Supplemental Fig. 6. Thus, cytosporone B, by binding to the C-terminal alternative ligand binding site, might be expected to drive the NR4A1 “receptor” in a way similar to but distinct from the actions of metformin. That said, cytosporone B has also been shown interact with the “classical” ligand binding pocket of NR4A2 (Munoz-Tello et al., 2020) that has strong structural similarity with the comparable sequence in NR4A1. Thus, cytosporone B could in principle affect cell function by binding both to the NR4A1 C-terminal alternative ligand binding site and to the classic NR4A1 ligand binding domain.
Like metformin, the NR4A1 agonist THPN (Wu and Chen, 2018) showed possible interactions with Asn1, Asp137, Pro139, Ala140, Ala179, and Glu183 (Supplemental Fig. 7, A and B) by forming conventional H-bonds, Van der Waals interactions, alkyl bonds, and π-alkyl bonds. The surface representation of the NR4A1 agonist THPN lying within the binding pocket is shown in Supplemental Fig. 7C. Furthermore, TMPA, an NR4A1 antagonist, showed conventional H-bonds and carbon hydrogen interactions with Asn1, Glu175, and Gln185 (Supplemental Fig. 8, A to C). TMPA fits in the predicted NR4A1 alternative ligand binding site, as shown in Supplemental Fig. 8C.
Finally, we assessed the potential interaction of celastrol with NR4A1, as described by Hu et al. (2017). Importantly, celastrol has been found not to interact with the classic ligand binding pocket of NR4A1. As shown in the lower portion of Supplemental Fig. 6, we were able to confirm a potential interaction of celastrol with the ligand binding pocket of NR4A1. In sum, metformin, cytosporone B, celastrol, and the antagonist we used to modulate the effects of metformin on maintaining endothelial cell function in the setting of hyperglycemia (TMPA) were all able in principle to dock with the C-terminal alternative ligand binding site of NR4A1 described by Lanig et al. (2015).
13. Cytosporone B, Like Metformin, Protects the Endothelium from Hyperglycemia-Induced Dysfunction but Only at Low Concentrations, as Does Celastrol
Given that the in silico analyses done by us and others indicate that cytosporone B and celastrol can both in principle interact with NR4A1, we predicted that these compounds, like metformin, might protect the endothelium from hyperglycemia-induced dysfunction. Indeed, it was found using the vascular ring organ culture test system that low concentrations of cytosporone B in the nanomolar concentration range (50 nM) were able, like metformin, to preserve endothelial function for the vasorelaxant actions of 1 μM of either 2fLI or acetylcholine (Fig. 16A; 14B: *P = 0.03; **P = 0.01, T-test). However, exposure to higher concentrations of cytosporone B (500–1000 nM) appeared to be toxic, leading to an elimination of the vasorelaxant action of both ACh and 2fLI at a concentration of 1 μM (solid triangles, Fig. 16, A and B). This effect of cytosporone B is possibly due to the ability of cytosporone B at these concentrations to promote cellular apoptosis over a 24–48-hour time frame (Zhan et al., 2008, 2012). Similarly, celastrol at a concentration of 250 nM in the tissue organ cultures was also able to preserve the vasodilator actions of ACh and 2fLI for aorta rings cultured under hyperglycemic conditions [Fig. 16C: **P = 0.01, comparing untreated tissues (first and third histograms from the left) with celastrol-treated tissues (second and fourth histograms from left)]. As already pointed out, unlike cytosporone B, which is in principle capable of binding to both the classic ligand binding domain (Munoz-Tello et al., 2020) and to the C-terminal alternative ligand binding site, ligand binding measurements and an in silico approach have shown that celastrol cannot interact with the classic ligand binding pocket but can potentially interact with the C-terminal alternative ligand binding site of NR4A1 (Hu et al., 2017). That study was not able to identify whether that alternative ligand binding site was responsible for the actions of celastrol in vitro. To conclude, the Nr4a1-interacting ligands cytosporone B and celastrol, like metformin, were able to protect the endothelium from hyperglycemia-induced dysfunction at concentrations in the 10–250 nanomolar range. Of those two compounds, both were able in principle to dock with the NR4A1 alternative ligand binding site of NR4A1, but only cytosporone B, as opposed to celastrol, is also capable to bind also to the “classic” ligand binding domain pocket of NR4A1.

Cytosporone B and celastrol protect against hyperglycemia-induced vasodilator function at low concentrations (50–250 nM). However, high cytosporone B concentrations (500–1000nM) impair vascular vasodilator function. (A andB) Concentration-effect curves for 2fLI (A) and ACh (B)-induced vasorelaxation in wild-type aortic rings maintained for 48 hours in 25 mM glucose without (solid circles) or with 50 nM (solid diamonds), 500 nM (solid squares), or 1 μM (solid triangles) cytosporone B. (C) Vasodilator responses in wild-type aortic rings maintained for 48 hours in 25 mM glucose without or with 250 nM celastrol (+Cel) were evaluated for vasodilation responses to ACh (solid histograms) and 2fLI (light- and dark-striped histograms) using a vasodilation assay as shown in (A and B). The histograms in C show the average vasodilation responses ±S.D. observed at 3 μM of either ACh or 2fLI. Data are presented as mean ± S.D. (bars), n = 3 to 6 tissues for each group in (A and B). For (A and B), *P = 0.03 and **P = 0.01, respectively (T-test), comparing responses of untreated tissues vs. tissues treated with 50 nM cytosporone B. For (C), **P = 0.01, comparing untreated tissues (first and third histograms from the left) with tissues treated with 250 nM celastrol (Cel) (second and fourth histograms from the left: Tukey’s multiple comparison).
14. Metformin Does Not Increase Nr4a1 mRNA Transcription in the Organ Bath, and Transcription Is Not Required for Metformin to Rescue the Vasodilator Response to Vascular Tissues Exposed to Hyperglycemia
Since the cellular actions of NR4A1 are believed to be due in part to its transcriptional upregulation as an “early response gene” affected by many agonists (Maxwell and Muscat, 2006), we measured the abundance of Nr4a1 mRNA by qPCR in the tissues treated in the organ bath with metformin in the absence and presence of actinomycin D that would block transcription. As shown in Supplemental Fig. 5A, treatment of the tissues with metformin did not increase the abundance of Nr4a1 mRNA. However, treatment with 1 µM actinomycin D led to a marked reduction of Nr4a1 mRNA over the 2-hour time period of the bioassay [Supplemental Fig. 5A, Metformin (Met) + actinomycin D (AD)], implying a rapid turnover of Nr4a1 mRNA in the tissue. Because metformin did not increase Nr4a1 transcription in tissues maintained in the organ bath, we evaluated whether transcription per se was required for the ability of metformin to restore the vasodilator responses of tissues that had been exposed to 25 mM glucose for 48 hours. Thus, we tested the ability of metformin to restore the vasodilator responses of acetylcholine and 2fLI (as illustrated in Fig. 1) for hyperglycemia-exposed tissues within 3 hours in the organ bath in the presence of metformin and to determine whether the action of metformin was affected by preventing transcription by 1 µM actinomycin D (AD). As shown in Supplemental Fig. 5B, metformin was able to “rescue” the vasodilator responses of hyperglycemia-exposed tissues to acetylcholine within 3 hours in the organ bath, and actinomycin D did not block the vasodilator-restorative actions of metformin. The response to 2fLI was similarly restored by metformin in the absence or presence of actinomycin C (unpublished data). To sum up, the ability of metformin to improve the vasodilator response of hyperglycemia-treated tissues did not appear to require either an upregulation of Nr4a1 mRNA or a transcriptional response potentially caused by NR4A1 in the tissues.
15. MD Calculations for Metformin-Nr4a1 Complex Stability in a Simulated In Vivo Environment
Given the data above showing the potential ability of metformin to interact with the NR4A1 C-terminal alternative ligand docking site, molecular dynanics (MD) simulations were done to determine the structural stability in a simulated in vivo environment of NR4A1 after binding with metformin within a nanosecond time scale. This complex was selected based on the least binding affinity and was subjected to 30-ns MD simulations, and the results were analyzed. The root mean square deviation (RMSD), a crucial parameter to analyze the equilibration of molecular dynamics trajectories, was estimated for backbone atoms of the metformin and metformin-NR4A1 complex. Measurements of the backbone RMSD for the complex provided insights into the theoretical conformational stability of the metformin- NR4A1 complex in solution. Slight deviations can be seen during the time period of 10–20 ns. After that, a slight decrease in the RMSD value can be seen that remained stable afterward (Fig. 17A). The overall RMSD value fluctuated between 8 and 10 nm. The root mean square fluctuation calculates the standard deviation of atomic positions. The plot showed residual fluctuations in NR4A1 at several regions during the simulation (Fig. 17B). The calculated total energy and average potential energy was found to be −1.77e+006 KJ/mol and −2.175e+006 KJ/mol, respectively (Fig. 17, C and D). As the molecular recognition between a receptor and a ligand lies in H-bonding, we calculated the number and distance of potential hydrogen bonds between metformin and NR4A1 in the putative in silico complex. Multiple H-bonds can be seen in the plot during the time period of 10–30 ns (Fig. 17, E and F). This result implies that metformin can bind to the ligand binding pocket of NR4A1 with several H-bonds that remain stable during the 30-ns simulation. Longer simulations showed comparable results. The calculated average H-bond distance ranged between 0.2 and 0.35 nm. Solvent Accessible Surface Analysis (SASA) estimates the conformational changes in protein upon ligand binding. Fluctuations can be observed in SASA plot during the first 15-ns simulation, and no major change was observed afterward showing the stable conformation of metformin-Nr4a1 complex (Fig. 17G). Based on these in silico analyses, we conclude that the metformin-Nr4a1 complex can be stable and can be predicted to exist under physiologic conditions in solution as well. As mentioned above, the strong H-bonds predicted between metformin and NR4A1 appeared to persist during the entire 30 ns simulation. The calculated binding affinities of the complexes: NR4A1-metformin, NR4A1-cytosporone B, along with theNR4A1-THPN agonist, and NR4A1-TMPA antagonist complexes were found to be −4.3 Kcal/mol, −5.5 Kcal/mol, −5.3 Kcal/mol, and −3.5 Kcal/mol respectively.

Molecular dynamics of metformin-NR4A1 complex. (A) Root mean square deviation (RMSD) plot of Nr4a1 as a function of time. (B) Backbone root mean square fluctuation plot. (C) Total energy of the system during simulation. (D) Average potential energy of the protein. (E) Number of H-bonds between metformin and Nr4a1. (F) Distance of H-bonds present between the metformin and Nr4a1. (G) Solvent-accessible surface (SASA) plot as a function of time.
16. Biotinylated Metformin Can Interact Directly with Nr4a1
Because the above-described in silico data predicted a physical interaction between metformin and Nr4a1, we tested the hypothesis that Nr4a1 could interact directly with metformin in a cell expression system. To this end, we synthesized biotinyl-metformin along with a metformin-free biotin linker in keeping with previously published work (Horiuchi et al., 2017). Murine Nr4a1, incorporating either an myc or an mRFP tag on its C terminus, was prepared and expressed in HEK 293T, an HEK cell background cell as described in Methods. Expression of the construct was verified by imaging the presence of fluorescent mRFP in the nucleus. Extracts of tagged Nr4a1-expressing HEK 293T cells were made and supplemented with either biotinyl-metformin or metformin-free biotinyl linker. The potential complex between biotinyl-metformin and tagged Nr4a1was adsorbed to neutravidin beads, which were harvested and washed as outlined in Methods. The metformin-Nr4a1 complex adhering to the neutravidn beads was then dissociated in the presence of 100 μM free metformin, and the released proteins were solubilized in electrophoresis buffer for Western blot analysis to detect either the myc or mRFP-tagged Nr4a1 using an anti-Nr4a1/Nur77 antibody. As shown in Fig. 18, a Western blot signal for Nr4a1 was detected for the analysis of the avidin-bead pulldowns using biotinylated metformin but not for pulldowns using either the metformin-free C10 linker or the biotin-free metformin-C10 linker alone (lanes N1 and N2, Fig. 18, A and B). For reasons we were not able to determine, the avidin bead pulldowns showed variable amounts of mRFP-Nr4a1 Western blot reactivity, most likely depending on the efficiency of extraction of the tagged mRFP-Nr4a1 constructs from the HEK cell expression system. Nonetheless, no signal was ever detected from the pulldowns obtained using the metformin-free biotinylated linker control or the biotin-free metformin-linker control. We concluded that indeed metformin was able to interact with tagged myc/mRFP-Nr4a1 in the HEK cell extracts either on its own or in a complex with other constituents.

Isolation of a biotinylated-metformin/Nr4a1 complex using Neutravidin affinity beads. The complex between solubilized myc-tagged or mRFP-tagged Nr4a1 and biotinylated metformin was harvested using Neutravidin crosslinked magnetic beads as outlined in Methods. Proteins attached to biotinylated metformin (Bio-Met) on the neutravidin beads were dissociated from biotinyl-metformin by the addition of 100 μM free metformin, and the proteins eluted were analyzed by Western blot detection of either myc-tagged (A) or mRFP-tagged Nr4a1as outlined in Methods. No signal was observed when the Neutravidin bead-harvesting procedure was done using either the metformin-free biotin C10 linker [Bio-CONH-CAD10: N1, (A and B)] or the biotin-free metformin-C10 linker construct [metformin-NH-C10: N2, (A and B)].
17. Mutation of Nr4a1 Prolines Predicted to Interact with Metformin Impairs the Ability of Metformin to Affect Hyperglycemia-Induced Changes in the Mitochondrial Oxygen Consumption Rate or in Proton Leak
At this point, we had established that metformin’s ability to protect the endothelium from hyperglycemia/oxidative stress–induced dysfunction and to maintain the endothelial mitochondrial oxygen consumption rate in the setting of hyperglycemia required the presence of Nr4a1 (Figs. 4, 5, and 8). Metformin was also able to reverse the hyperglycemia-induced mitochondrial shape change (Fig. 12) that can correlate with changes in mitochondrial membrane polarization. Furthermore, the pulldown data demonstrated an interaction between metformin and Nr4a1 that could be either direct or indirect and possibly involve an intermediary protein. Our in silico docking data predicted interactions between metformin and NR4A1 prolines 139 and 184 [Fig. 15: Lanig et al. (2015) numbering that corresponds to murine Nr4a1 prolines 505 and 549 in the database]. The agonist cytosporone B was also predicted to interact with the same two prolines in Nr4a1 (Supplemental Fig. 6). The challenge was to determine whether these two Nr4a1 prolines might be involved in the cellular actions of metformin via a presumed interaction predicted by our in silico analysis.
To meet this challenge, we site mutated prolines 139 and 184 to glycines [Lanig et al. (2015) numbering: PPGG mutants, database murine Nr4a1 prolines 505 and 549] and evaluated the ability of metformin to affect cellular mitochondrial function in an HEK transfection assay. HEK T293 cells, which have a high transfection efficiency (∼100%) were used because we found that tissue-derived endothelial cells like human umbilcal vein–derived cells showed a transfection efficiency of less than 1%.
We had already found that HEK cells, which express a low level of NR4A1, are a good host for expressing the tagged Nr4a1 used in our pulldown assays. Thus, using transfected HEK 293T cells, we first established using the oxygen consumption rate Seahorse assay that as for endothelial cells elevated glucose concentrations reduced the oxygen consumption rate of wild-type HEK cells (unpublished data). The Seahorse approach was thus used to monitor the oxygen consumption rates in HEK 293T cells transfected with WT or proline-mutated Nr4a1 (PPGG) cultured under hyperglycemic conditions (25 mM glucose) and treated or not with metformin (Fig. 19). OCR measurements were also used to monitor proton leak. It has been suggested that the OCR reflecting proton leak is a reliable index of the status of the electron transport chain that can be compromised by oxidative stress (Hill et al., 2012). HEK 293T cells were transfected with either WT or Nr4a1 mutated at prolines in the C-terminal Nr4a1 alternative ligand binding site (P139G/P184G-Nr4a1: PPGG). The key prolines putatively responsible for metformin interactions as revealed by the in silico docking data (Pro139; Pro 184: Fig. 15) were changed to glycines (Nr4a1: PPGG). These constructs were transfected into the HEK 293T cells that were exposed to hyperglycemia in the absence or presence of metformin, as outlined in Methods.

Wild-type but not PPGG-mutated Nr4a1 enables metformin to affect mitochondrial oxygen consumption rates and proton leak in hyperglycemia-treated transfected HEK 293T cells. HEK 293T cells were transfected with either WT or proline mutant Nr4a1 (PPGG) and cultured under hyperglycemic conditions as outlined in Methods in the absence or presence of metformin (MET: 10 μM). Transfected cells were then monitored for their OCRs and proton leak using the Seahorse assay, as outlined in Methods. For WT-transfected cells, metformin caused a mean increase in the OCR [(A), first and second histograms from left] of 59 pmol/min (95% CI 5.8–113 pmol/min; P = 0.029 comparing metformin-treated vs. untreated cells/Tukey’s multiple comparison). Metformin caused a decrease in proton leak (B) of 90 pmol/min (95% CI, 44–135 pmol/min, P = 0.0002). No statistical difference (P > 0.25) was observed for the OCRs or proton leak for PPGG Nr4a1 mutant-transfected cells treated with metformin [third and fourth histograms from the left, (A and B)].
As shown in Fig. 19A, when treated with metformin, there was an increase in the OCR for hyperglycemia-cultured HEK 293T cells expressing wild-type Nr4a1 (mean increase, 59 pmol/min, 95% confidence interval 5.8–113 pmol/min, P = 0.029, Tukey’s multiple comparison). In contrast, in the PPGG mutant transfected cells, the effect of metformin failed to reach statistical significance (third and fourth histograms from the left, Fig. 19A, P = 0.26). In addition, the transfected wild-type Nr4a1 enabled metformin to reduce the mitochondrial proton leak (Fig. 19B, first and second histograms from left), whereas metformin was not able to do so for the transfected PPGG mutant (Fig. 19B, third and fourth histograms from the left: P = 0.91). The mean decrease in proton leak caused by metformin in the wild-type Nr4a1-transfected cells compared with nontransfected cells (Fig. 19B) was 90 pmol/min (95% confidence interval, 44–135 pmol/min; P = 0.0002). The data indicated that the two prolines predicted to have interactions with metformin and cytosporone B by the in silico data are key residues for mediating the action of metformin to affect mitochondrial function very possibly via a direct interaction with metformin.
Discussion
1. Main Findings
The main finding of our study was that NR4A1/Nur77 is required for metformin’s ability to protect the endothelium from hyperglycemia-induced vasorelaxant dysfunction. Our data indicate not only that 1) metformin is able to protect the endothelium both in vitro and in vivo from hyperglycemia-induced vasorelaxant dysfunction by minimizing oxidative stress (ROS production) but also 2) the “orphan nuclear receptor” Nur77/NR4A1 is an essential partner for this action of metformin in vitro and in vivo. The data thus point to an unexpected novel mechanism involving a role for the orphan nuclear receptor NR4A1 in the endothelium-protective actions of metformin that are independent of its impact on blood glucose levels. This role for NR4A1 can be added to its multiple pleiotropic metabolic and central nervous system actions outlined elsewhere (Chao et al., 2009; Pearen and Muscat, 2010; Mohankumar et al., 2018; Zhang et al., 2018). Although our data apply so far only to the impact of NR4A1 on metformin action in male mice, we expect to find a comparable effect in females in future work. This positive impact of metformin on vascular endothelial function in subjects of both sexes was observed in vivo for patients with diabetes some time ago (Mather et al., 2001), but the mechanism for this action was not determined. In interpreting our data, we note that the in vivo streptozotocin data compared wild-type and Nr4a1-null mice that were not littermates but were bred in the same animal care location under identical feeding and environment conditions.
2. Mechanism of Metformin Action: Does It Act via the Classic Ligand Binding Pocket of NR4A1 in Its Classic Ligand Binding Domain or via the Alternative Ligand Binding Site of NR4A1?
We aimed to interrogate the mechanism of metformin action. Although subject to further validation by direct ligand binding studies in our ongoing work, our data point to a physical interaction of metformin with NR4A1 either directly via its alternative surface ligand binding site or possibly via its “classic” ligand binding pocket site. That NR4A1 is required for the actions of metformin we observe would appear to rule out an NR4A1-independent molecular interaction of metformin that can also bind to other cellular constituents like alarmin-high-mobility box protein B1 (HMGB1) (Horiuchi et al., 2017). The possibility that metformin can potentially interact with NR4A1 via the noncanonical alternative ligand binding site identified by Lanig et al. (2015) that is distinct from the canonical steroid hormone receptor ligand binding pocket was supported by our in silico analysis identifying a potential docking of metformin with the NR4A1 C-terminal domain (Fig. 15). That docking site pointed to close interactions of metformin with two key prolines in NR4A1. A physical interaction (direct or indirect) is implied by the ability of tagged NR4A1 to bind to biotinylated metformin reversibly (eluted by unlabeled metformin) in our avidin bead affinity isolation procedure. Importantly, metformin can be predicted to bind to the alternative ligand binding site of both mouse and human NR4A1 since the sequences of human NR4A1 and mouse Nr4a1 have a high degree of amino-acid identity with 100% concordance in the predicted alternative ligand binding site (534C to 551C in the human sequence). The C-terminal alternative ligand binding site sequence is quite distinct in NR4A1 compared with NR4A2 and NR4A3, which do not have the prolines (P501, P546) predicted to be involved in the interactions of NR4A1 with metformin [designated as Pro139 and Pro184 in Fig. 15B: Lanig et al. (2015) numbering]. Thus, our data pointing to the interaction between biotinylated metformin with mouse Nr4a1, possibly via the C-terminal alternative ligand binding site, will undoubtedly apply to both human and mouse NR4A1 but very likely not to other NR4A family members.
Our in silico modeling pointed to amino acids in the alternative ligand binding site of NR4A1 that are in common for its potential interactions with metformin, cytosporone B, and celastrol. Notably, prolines 139 and 184 [Lanig et al. (2015) nomenclature; human residues P501 and P546 in the NR4A1 sequence database] are implicated in the ligand-receptor interactions (Fig. 15 and Supplemental Fig. 6). The potential role of the predicted alternative ligand binding site for the action of metformin was strongly supported by our functional assays for metformin action assessing mitochondrial function in an HEK 293T cell background, with cells transfected with either wild-type or mutant Nr4a1 in which the prolines predicted to interact with metformin (Fig. 15) were mutated to glycines. In the HEK 293T cell oxygen consumption rate assays, metformin was able to have an effect for cells transfected with wild-type NR4a1 but not for the PPGG mutant (Fig. 19). The result can indicate either that metformin interacts directly with the alternative ligand binding site via the prolines, as predicted by our in silico analysis, or that mutating the prolines can potentially affect the function of Nr4a1 via a conformational switch that prevents its metformin-driven activation upon binding metformin. Further in-depth direct metformin-Nr4a1 ligand binding assays will be required to distinguish between those hypotheses.
The avidin bead pulldown experiments demonstrated a reversible metformin-Nr4a1 interaction, but the site(s) of interaction (e.g., the canonical LBD or the alternative ligand binding site) could not be identified. Biotinylated metformin might have been bound indirectly to NR4A1 in a complex with other proteins so as to be dissociated from the complex by added metformin (Fig. 18). This possibility merits investigation in the future using a proteomic approach to analyze the metformin-NR4A1 complex that adhered to the avidin beads enabling the release of NR4A1 in the presence of metformin itself from the avidin bead complex. Furthermore, pulldown experiments using the site-mutated PPGG Nr4a1 mutants used in the HEK 293T cell assays will also be informative in this regard.
Of note, our in silico analysis showed that the NR4A1 antagonist TMPA is in principle also able to dock with the NR4A1 C-terminal alternative ligand binding site domain (Supplemental Fig. 8), whereas TMPA is not able bind to the NR4A2 “classic” ligand binding pocket, which has high sequence identity with the NR4A1 ligand binding domain (Munoz-Tello et al., 2020). Yet, TMPA blocks rather than mimics the action of metformin (Fig. 2), implying that it inhibits the access of metformin to an alternative NR4A1 ligand binding site distinct from a canonical ligand binding pocket in the “classic” ligand binding domain. It is feasible that the “metformin-antagonist” activity of TMPA because of its possible occupancy of the NR4A1-metformin C-terminal alternative ligand binding site may concurrently activate other signal pathways as a “biased” agonist/antagonist. It is also possible that the differences in the actions of metformin and TMPA may be due to the higher predicted binding affinity at the C-terminal alternative ligand binding site for the metformin-NR4A1 complex (−4.3 Kcal/mol) compared with the TMPA-NR4A1 complex (−3.5 Kcal/mol). In this regard, cytosporone B, which acted like metformin in our vascular organ cultures, had a higher predicted affinity for the NR4A1 alternative ligand binding site (−5.5 Kcal/mol) than either metformin or TMPA. This issue merits further investigation since TMPA itself can trigger the release of NR4A1-bound constituents like LKB1. Once released, LKB1 can exit from the nucleus so as to affect cell function via cytosolic AMPK-regulated signaling (Zhan et al., 2012; Wang et al., 2019).
Like TMPA, celastrol, which was able to protect the endothelium from hyperglycemia-induced dysfunction (Fig. 16C), has been predicted by us and by others to bind to a C-terminal alternative ligand binding site of NR4A1 [Supplemental Fig. 6 and Hu et al. (2017)]. Yet, celastrol is unable to bind to the ligand binding domain of NR4A2 (Munoz-Tello et al., 2020) that has >60% amino acid identity with the same domain in NR4A1. Thus, binding of celastrol to the C-terminal alternative ligand binding site of NR4A1 may be sufficient to protect the endothelium from oxidative stress–induced dysfunction. Our data thus suggest that like celastrol and TMPA, the endothelium-preserving actions of metformin may result from its interaction with the alternative ligand binding site of Nr4a1 and not to the receptor’s classic ligand binding pocket in its ligand binding domain.
Although NMR measurements indicate that cyosporone B can interact with the classic NR4A2 ligand binding domain’s ligand binding pocket, cytosporone B does not affect NR4A2/Nurr1 transcriptional activity. Rather, at high concentratons, cytosporone B diminishes the NR4A2 reporter construct activity in an HEK cell backgound expression system (Munoz-Tello et al., 2020). However, cytosporone B does drive transcription via an Nur1/NR4A1 reporter construct (Zhan et al., 2008). Thus, increased NR4A1-mediated transcription caused by cytosporone B may possibly account for its actions that we have observed. Yet, we show that cytosporone B can potentially bind to the C-terminal alternative ligand binding site of NR4A1 (upper panel, Supplemental Fig. 6). The endothelial effects of cytosporone B may thus be due to its combined interaction with the alternative C-terminal binding site of NR4A1 and also with the classic ligand binding pocket in the NR4A1 ligand binding domain.
3. Is NR4A1-Stimulated Transcriptional Activity Required for Its Action to Prevent Hyperglycemia-Induced Endothelial Dysfunction?
In terms of increased transcriptonal activity of Nr4a1 itself that is believed to mediate NR4A1 effects in some cells (Maxwell and Muscat, 2006), our data showed that in the vascular bioassay system, metformin did not cause the transcriptional upregulation of Nr4a1 mRNA, which was rather downregulated by actinomycin D. Moreover, in the wire myograph bioassay system, the ability of added metformin to cause a time-dependent improvement in the hyperglycemia-compromised vasodilator response to muscarinic receptor activation was not blocked by actinomycin D (Supplemental Fig. 5B). Thus, a transcriptionally mediated “rescue” of the vasodilator response due to metformin’s binding to the classic ligand binding domain appears unlikely. Whether a direct NR4A1-triggered transcriptional process is required for the actions of metformin, cytosporone B, and celastrol on the vasculature, apart from their potential interaction with the NR4A1 ligand binding domains, it is therefore unlikely but merits future investigation.
4. Metformin Action to Prevent Hyperglycemia-Induced Endothelial Dysfunction Does Not Affect the Mitochondrial Complex I Oxygen Consumption Rate
Our data show that the concentrations of metformin that were able to preserve endothelial function under hyperglycemic conditions (e.g., 1 to 10 μM) were well below those found in other studies to impair mitochondrial complex I function (in the 5–70 mM range; El-Mir et al., 2000; Owen et al., 2000), as discussed elsewhere (Kinaan et al., 2015; Triggle and Ding, 2017; Wang et al., 2019). Thus, we found no impact on the mitochondrial oxygen consumption rate at concentrations of metformin that preserved endothelial function in the setting of hyperglycemia (Figs. 8 and 9). Of importance, the concentrations of metformin that we observed were able to improve hyperglycemia-exposed endothelial cell function both in vitro and in the STZ-diabetes model in vivo in the therapeutic plasma concentration range observed in metformin-treated type-2 patients with diabetes and mice (mouse levels predicted to be in the 20 μM range; Wang et al., 2019). However, this concentration of metformin, which did not affect mitochondrial complex I function, was able to cause an improvement in the function of complex IV. Thus, metformin’s effect on complexes II and IV in the setting of hyperglycemia may be protective.
Although we were not able to measure the intracellular concentrations of metformin in the cells and tissues under the conditions of our assays, our preliminary PCR data show that endothelial cells (HUVECs) express both inward (OCT) and outward transporters (MATE1) and in HUVECs MATE1 > OCT (unpublished data). Data reported for murine Hepa 1-6 hepatocyte cell line exposed to 1 mM metformin show that mitochondria do not contain concentrations that would not affect complex I (<100 μM; Wang et al., 2019). Thus, there may be little intracellular mitochondrial accumulation of metformin. Moreover, its cellular concentrations under the conditions of our assays would reflect those obtained in metformin-treated patients with blood levels in the therapeutic 20 µM range. Our data demonstrating a lack of effect of therapeutic concentrations of metformin on complex I activity in the vascular tissue are entirely in agreement with the findings of Wang et al. (2019) using hepatocytes, wherein metformin concentrations that improve mitochondrial respiratory activity are lower than those that would affect complex I activity.
The low metformin concentration (10 μM) caused a modest increase in the phosphorylation of AMPKinase (Fig. 14, A and B) in accordance with the data of Kukidome et al. (2006). This result indicated that the activation of AMPKinase may possibly play a role in metformin’s endothelium-preserving function even though the low metformin concentration did not affect complex I function. Indeed, activation of AMPK has been found to be essential for the ability of metformin to augment mitochondrial respiratory activity in liver tissue (Wang et al., 2019). However, as already noted, the high concentration of metformin (500 µM), which on its own compromises endothelial cell function, also increases AMPK phosphorylation. Furthermore, the NR4A1/Nur77 antagonist TMPA that blocks the action of metformin to maintain endothelial function can liberate nuclear NR4A1-bound LKB1 to migrate to the cytosol and activate AMPKinase (Zhan et al., 2012). Possibly by interacting with NR4A1, metformin like TMPA may also dissociate LKB1 from NR4A1 to result in LKB1 exit from the nucleus to activate AMPK. Thus, although AMPK kinase activation is suggested to be a key factor by previously published work (Zou et al., 2004; Kukidome et al., 2006; Meng et al., 2015; Wang et al., 2019), the activation of AMPK per se at low concentrations of metformin (<10 µM) may be unrelated to its endothelium-protective action. Therefore, establishing the role of metformin-stimulated AMPK activation for preserving endothelial cell function is a challenge that we have elected to leave for future work.
5. Biphasic Concentration-Dependent Actions of Metformin and Cytosporone B
The actions of metformin to protect the endothelium from hyperglycemia-induced dysfunction were mimicked by cytosporone B, which, although it is structurally dissimilar from metformin, like metformin it is predicted to interact directly with the NR4A1 C-terminal surface alternative ligand binding site in addition to its ability to bind to “classic” NR4A1 ligand binding pocket in the ligand binding domain (Supplemental Fig. 6; Zhan et al., 2008; Munoz-Tello et al., 2020). Similar to the effects of metformin, cytosporone B had a “biphasic” action protecting the endothelium at relatively low concentrations (e.g., 50 nM) but impairing vascular function (both endothelium and smooth muscle) at high concentrations (500 nM: Fig. 16, A and B). As already mentioned, cytosporone B has been shown to bind to the canonical ligand binding pocket of NR4A1 and to stimulate transcription of an NR4A1/Nur77 reporter construct (Zhan et al., 2008). The potential interaction of metformin with the ligand binding pocket in the “classic” ligand binding domain of NR4A1 for cytosporone B is thus possible but not yet verified.
We suggest that the distinct concentration-dependent actions of metformin and cytosporone B via NR4A1 and not via the other NR4A receptors may possibly be due to their differential interactions with the two potential binding sites on NR4A1: 1) the canonical LBD ligand pocket site and 2) the alternative potential ligand binding site identified by the in silico analysis we have done. This alternative ligand binding site could function like the alternate modulator nuclear receptor sites discussed previously by Katzenellenbogen and colleagues (Moore et al., 2010). Thus, we speculate that it is possible that both metformin and cytosporone B, which are structurally distinct, upon interacting with the classic ligand binding domain pocket versus the C-terminal surface alterntive ligand binding site of NR4A1 can possibly drive the receptor in a “biased” manner to stimulate different signaling via distinct ligand-NR4A1 interactions that are concentration-dependent. It is notable that celastrol is not able to bind to the canonical NR4A ligand binding pocket (Munoz-Tello et al., 2020) but can potentially bind to the NR4A1 alternative ligand binding site (Hu et al., 2017; lower panel, and Supplemental Fig. 6). As shown in Fig. 16C, celastrol (250 nM) does, like low concentrations of metformin and cytosporone B, protect the endothelium from hyperglycemia-induced dysfunction. Thus, metformin binding to the alternative ligand binding site alone may result in its ability to protect the endothelium from hyperglycemia-induced dysfunction. This issue clearly merits further study. Alternatively, metformin and cytosporone B may bind to effectors other than NR4A1 to cause their distinct adverse actions apart from protecting the endothelium from oxidative stress. Based on our findings, it may be possible to generate new compounds related to celastrol that interact selectively with NR4A1 at a unique binding site (e.g., the alternate surface ligand binding site alone) to stimulate only the “beneficial” vascular protective signals and to avoid the deleterious effects observed at the relatively high concentrations of the two NR4A1-interacting ligands we have evaluated in more depth (i.e., metformin itself and cytosporone B). It is hoped that the in silico analyses that we provide will aid the discovery of more selective NR4A1-stimulating agonists that will avoid the cytotoxic actions observed for both cytosporone B and metformin. Work to distinguish the interaction of metformin, cytosporone B and other NR4A1-interacting ligands with the “canonical” LBD versus the C-terminal surface alternate ligand binding site remains a most important issue to be pursued in continuing work.
6. Implications for the Use of Metformin to Treat Diabetic Vascular Dysfunction
As alluded to above, from in vivo measurements of endothelial vasodilator function done in male and female human type-2 patients with diabetes, it has been known for 2 decades now that metformin can improve blood vessel endothelial function (Mather et al., 2001). The results we report here suggest (e.g., Fig. 13) that metformin may be “protective” not only if administered prior to a hyperglycemic event but can also “rescue” the endothelium from hyperglycemia-induced dysfunction in the organ bath within 3 hours, even after a prolonged period of hyperglycemia. Our data not only provide a potential mechanistic rationale for this action of metformin to protect the endothelium from hyperglycemia-induced dysfunction by reducing oxidative stress but also reveal an unexpected link between this action of metformin and the orphan nuclear receptor, NR4A1. Thus, it will be of much interest to see whether the ability of metformin to enhance insulin action might also be tied to its interaction with NR4A1 and to assess whether the action of metformin in other tissues like the liver is also dependent on NR4A1. Since it is known that a subset of type-2 patients with diabetes do not respond well to metformin treatment, it will be of value to explore the potential link between possible genetic polymorphisms in the NR4A1 gene and the success or failure of metformin to treat patients with diabetes. Moreover, given the potential off-target effects that our data imply for the actions of metformin (e.g., high concentrations impair rather than preserve endothelial function), the door would appear to be open by using the in silico approach we describe here to design more targeted NR4A1 agonists that might replace metformin as a therapeutic agent to protect the endothelium from hyperglycemia-induced dysfunction.
Acknowledgments
The authors thank the Electron Microscopy facility at University of Calgary for generating the electron microscopic images. The authors also thank Dr. Vineetha Warriyar K.V., SIPRC, faculty of Kinesiology, University of Calgary, Calgary, AB, Canada for invaluable assistance with the statistical analysis.
Authorship Contributions
Participated in research design: Venu, Saifeddine, Mihara, Gorobets, Flewelling, Derksen, Triggle,, Hollenberg.
Conducted experiments: Venu, Saifeddine, Mihara, Faiza, Marej, Al-Majid, Motahhary.
Contributed new reagents or analytic tools: Mihara, Faiza, Gorobets, Flewelling, Derksen.
Performed data analysis: Venu, Saifeddine, Mihara, Faiza, Hirota, Marej, Al-Majid, Triggle, Hollenberg.
Wrote or contributed to the writing of the manuscript: Venu, Saifeddine, Mihara, Faiza, Flewelling, Derksen, Hirota, Ding, Triggle, Hollenberg.
Footnotes
- Received August 19, 2020.
- Accepted August 17, 2021.
Funding support for this article was provided by the grants from the Canadian Institutes of Health Research [P JT148565] to M.D.H., C.R.T., and S.A.H., The Qatar Foundation National Priorities Research Program (NP RP) [08165-3-054] to C.R.T., H.D., and M.D.H. and [4-910-3-244] to C.R.T. and H.D., and a Basic Medical Research Program (BMRP) Pilot Project to H.D. V.K.P.V. was funded by a Mitacs Accelerate postdoctoral fellowship.
Data related to information described in this manuscript were presented at a 2018 meeting of The British Pharmacology Society: CR, Venu VK, Saifeddine M, Alston LA, Motahhary M, Ding H, Hirota SA, Hollenberg MD 2019 Prevention of hyperglycaemia-related oxidative-stress-induced endothelial dysfunction by metformin: Novel involvement of orphan nuclear receptor, NR4a1/Nur77. Brit.J.Pharmacol. 176:2993-2994; Abstract P55. https://bpspubs.onlinelibrary.wiley.com/doi/epdf/10.1111/bph.14681.
↵
 This article has supplemental material available at molpharm.aspetjournals.org.

Abbreviations
- ACh
- acetylcholine
- AICAR
- 5-aminoimidazole-4-carboxamide ribonucleotide
- AMPK
- AMPKinase
- CI
- confidence interval
- DMEM
- Dulbecco’s modified Eagle’s medium
- eNOS
- endothelial nitric oxide synthase
- 2fLI
- 2-furoyl-LIGRLO-NH2
- GAPDH
- glyceraldehyde-3-phosphate dehydrogenase
- HEK
- human embryonic kidney
- LBD
- ligand binding domain
- L-NAME
- Nω-nitro-l-arginine methyl ester hydrochloride
- MMEC
- mouse microvascular endothelial cell
- NR4A1
- human nuclear receptor 4A1
- OCR
- oxygen consumption rate
- PAR2
- proteinase-activated receptor 2
- PCR
- polymerase chain reaction
- PE
- phenylephrine
- PPGG
- Nr4a1 mutant with glycine substitution for prolines
- qPCR
- quantitative PCR
- MD
- molecular dynamics
- mRFP
- monomeric red fluorescent protein
- RMSD
- root mean square deviation
- ROS
- reactive oxygen species
- SASA
- Solvent Accessible Surface Analysis
- STZ
- streptozotocin
- THPN
- 1-(3,4,5-trihydroxyphenyl)-nonan-1-one
- TMPA
- ethyl 2-[2,3,4-trimethoxy-6-(1-octanoyl)phenyl]acetate
- WT
- wild type
- Copyright © 2021 by The American Society for Pharmacology and Experimental Therapeutics


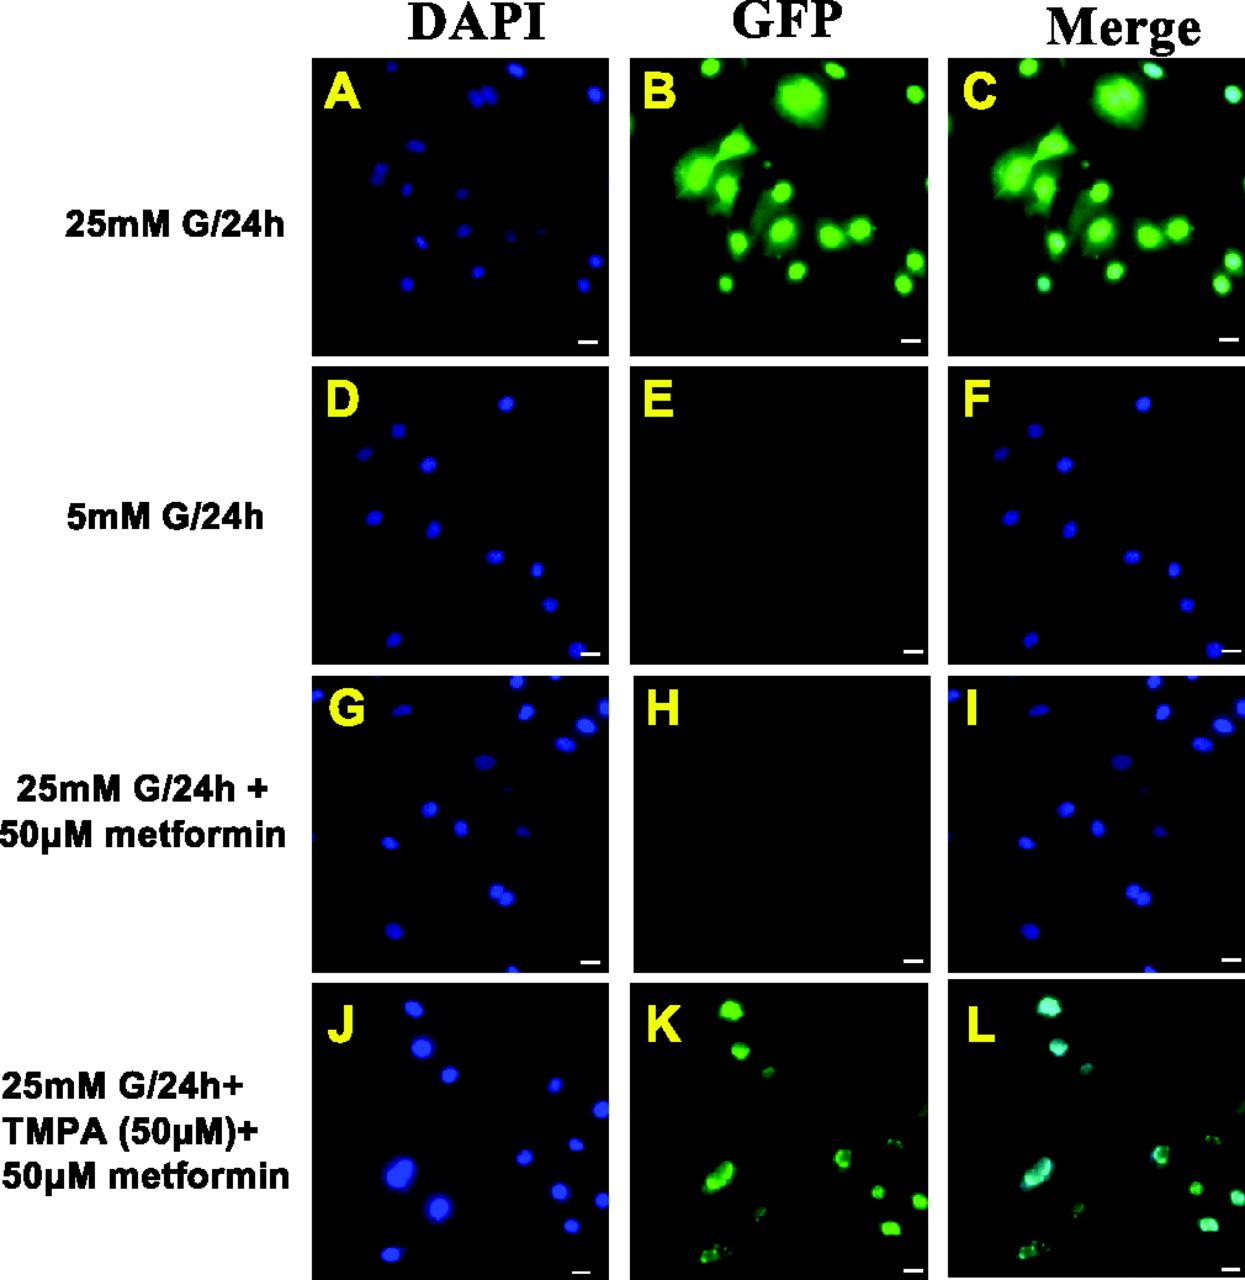
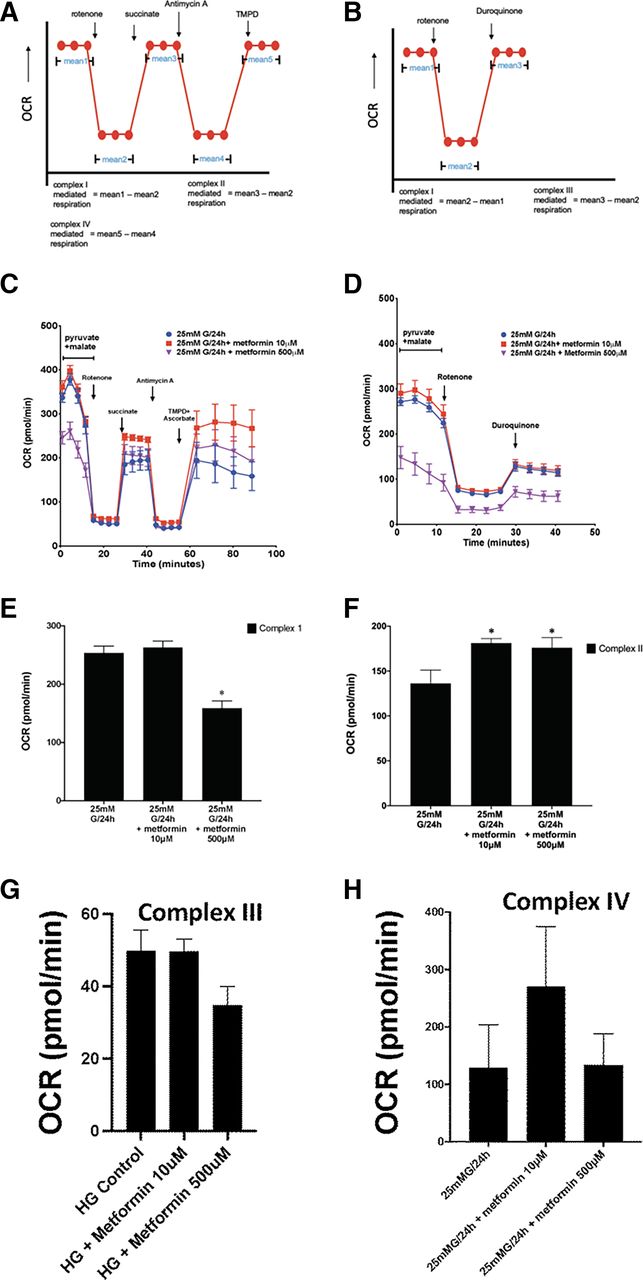
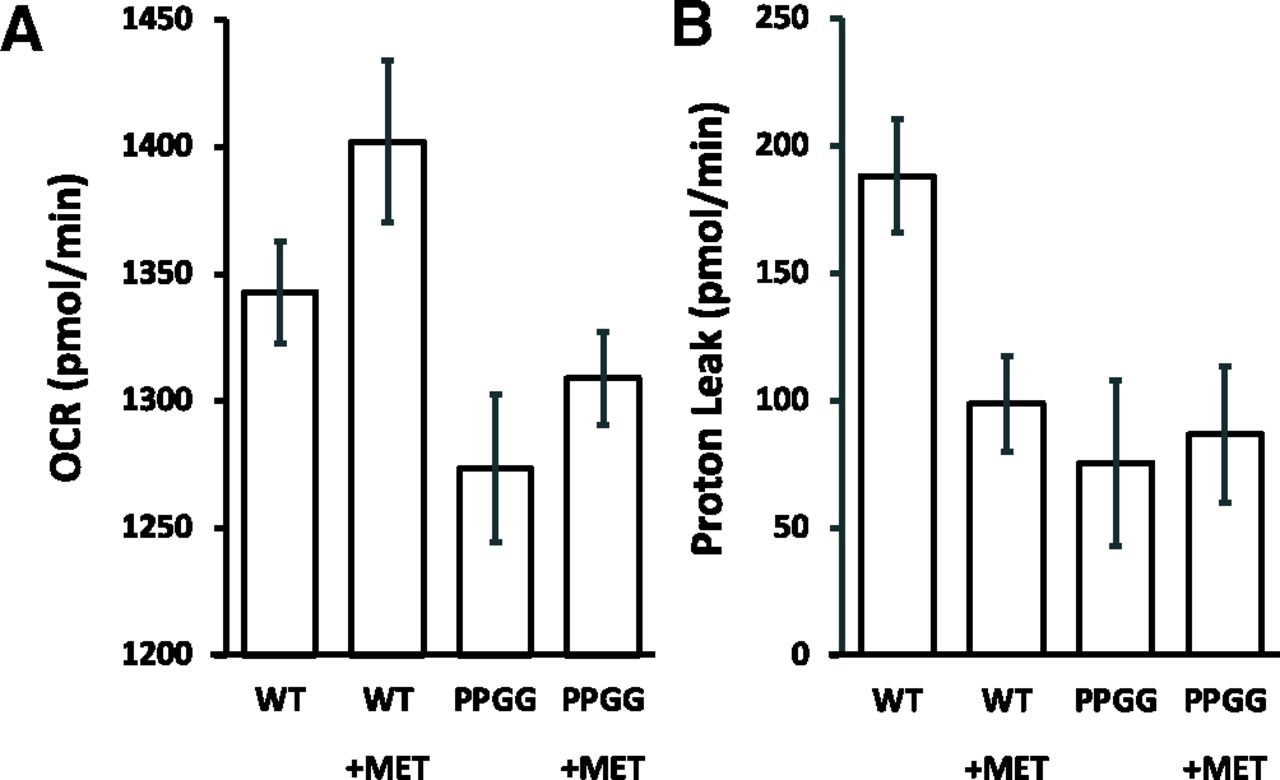