


Article Figures & Data
Figures
- Fig. 1.
Agonist-specific dichotomous expression of stc2 and cyp1a1. WT mice were treated with 20 µg/kg of TCDD and 12 mg/kg of CA for the indicated time. RT-PCR was performed to quantitate (A) cyp1a1 and (B) stc2 mRNA levels in liver normalized against 18S ribosomal RNA. For statistical analysis, a mixed-effects multivariate ANOVA (MANOVA) model was used. After an overall significant F test from the MANOVA model, the post hoc multiple-comparison tests were performed for the prespecified comparisons adjusted by Tukey procedure. *P < 0.05, and n = 3 independent mice.
- Fig. 2.
Identification of CA- and TCDD-specific, AhR-associated epigenetic modifications. WT mice were gavaged with 20 µg/kg of TCDD or intraperitoneally injected with 12 mg/kg of CA for the denoted time period. Two-step crosslinking chromatin immunoprecipitation was performed on livers using anti-AhR antibody followed by liquid chromatography coupled tandem mass spectrometry. (A) summarizes mutually exclusive histone modifications detected (denoted by D) upon TCDD and CA treatments at various time-points. * denotes H4 K5 acetylation previously detected by mass spectrometry and Western blotting after 2- and 24-hour CA treatment. (B) Representative high-resolution MS/MS spectra of STGG14KacAPR (encompassing residues 10–17), QLAT23KacAAR (residues 19–26), 27Kme2SAPATGGVK (residues 27–36) and EIAQDF79KmeTDLR (encompassing residues 73–83) in histone H3. For CA-specific H4 K5 acetylation, high-resolution spectra of G5KacGGKGLGKGGAKR (encompassing residues 4–17 in histone H4) with detailed information regarding theoretical and observed mass-to-charge ratio (m/z) values for fragment ions were published previously (Joshi et al., 2017).
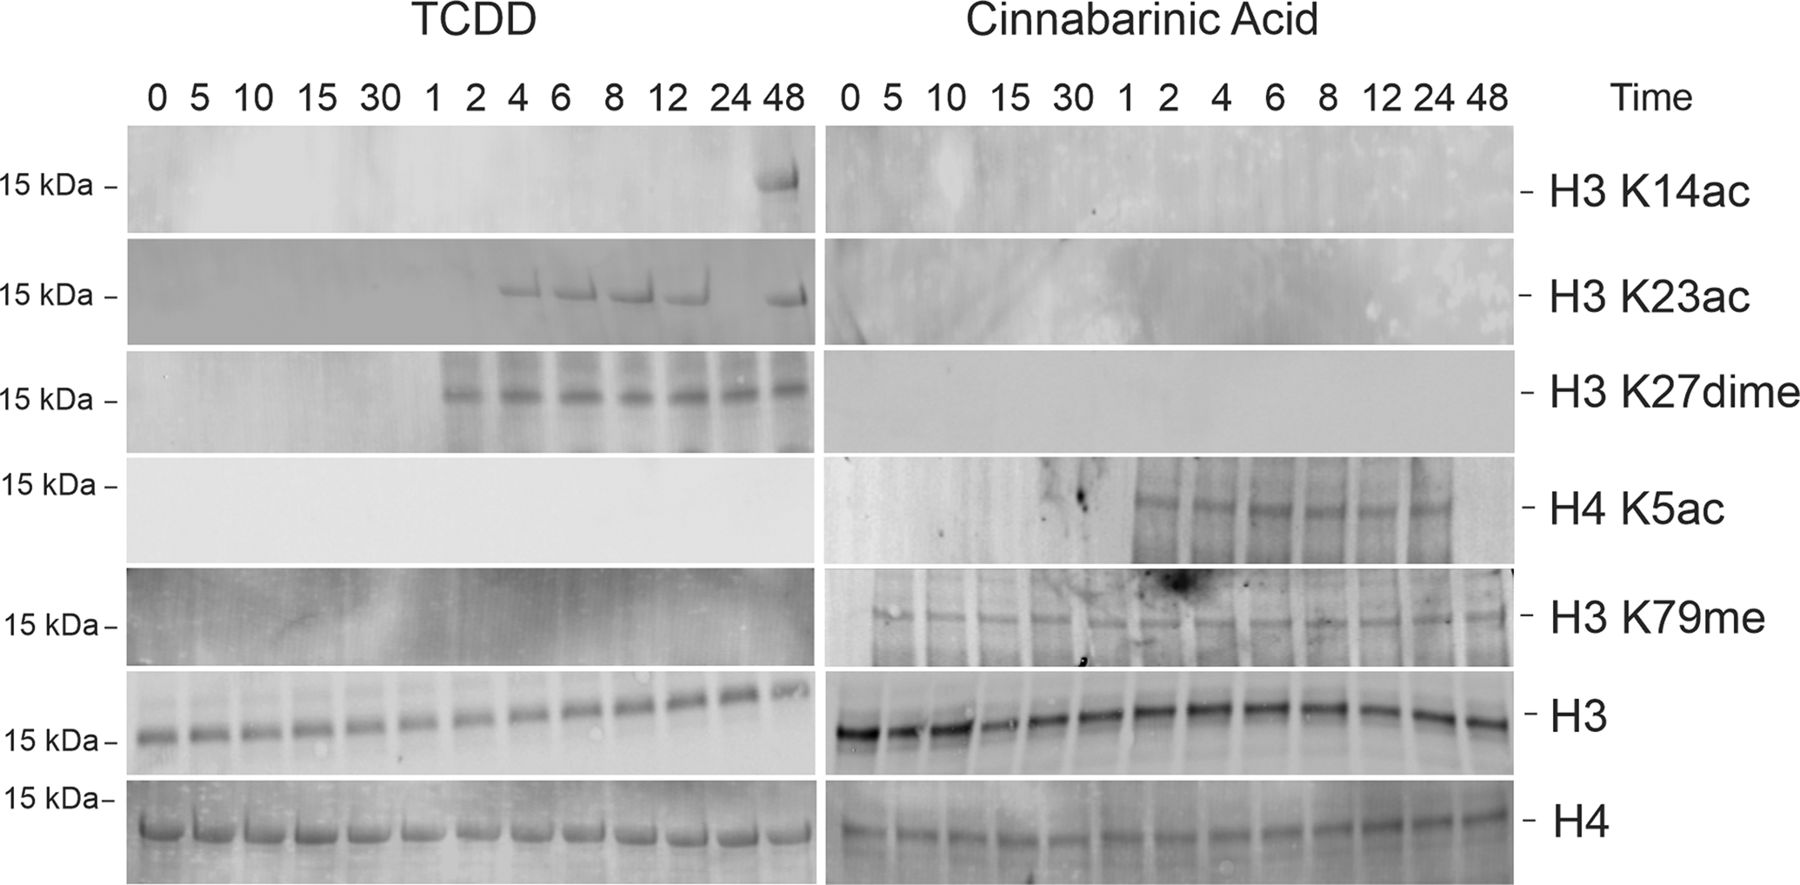
- Fig. 3.
Histone H4 K5 acetylation and H3 K79 methylation at the AhR-chromatin complex exclusively upon CA treatment. Crosslinked chromatin immunoprecipitated (with anti-AhR antibodies) protein extracts were subjected to Western blotting and probed with anti-histone modification antibodies. One representative blot is shown (n = 3 independent mice). Histone H3 and H4 were used as loading controls. Times 0, 5, 10, 15, and 30 indicate minutes and 1, 2, 4, 6, 8, 12, 24, and 48 are hours of 20 µg/kg of TCDD and 12 mg/kg of CA treatment.
- Fig. 4.
Identification of AhR-associated chromatin modification writers of H4 K5 acetylation and H3 K79 methylation. Livers of TCDD- and CA-treated WT mice were chromatin immunoprecipitated with anti-AhR antibody as described in Materials and Methods. Immunoblotting was carried out to detect enrichment of known histone modification writers of H4 K5 acetylation and H3 K79 methylation. Western blots shown are representative results from three independent experiments. 0, 5, 10, 15, and 30 indicate time in minutes and 1, 2, 4, 6, 8, 12, 24, and 48 are hours of 20 µg/kg of TCDD and 12 mg/kg of CA treatment.
- Fig. 5.
CA-dependent Atf2 and Dot1l binding to the stc2 promoter in vivo. ChIP assays were performed on livers from WT mice treated with TCDD (20 µg/kg) and CA (12 mg/kg) for 0, 5, 10, 15, and 30 minutes and 1, 2, 4, 6, 8, 12, 24, and 48 hours. Antibodies against the histone modification writers Atf2 and Dot1l and against AhR were used to immunoprecipitate the target proteins. Anti-IgG and anti-H3 antibodies were used as negative and positive controls, respectively. PCR using primers targeting XRE clusters in the stc2 and cyp1a1 promoters were used to amplify the precipitated DNA. PCR products were separated on two 5% polyacrylamide gels and visualized with SYBR Green dye. Samples were run, stained with SYBR Green, and imaged on Chemidoc MP (Bio-Rad) simultaneously with exactly the same acquisition parameters. Representative images from the ChIP gels are shown. Quantitation of PCR products was performed using ImageLab software (Bio-Rad). The bound fraction values were calculated as a percentage of the input DNA used in the immunoprecipitation representing 100% and are shown as means of percentage bound from three independent experiments.
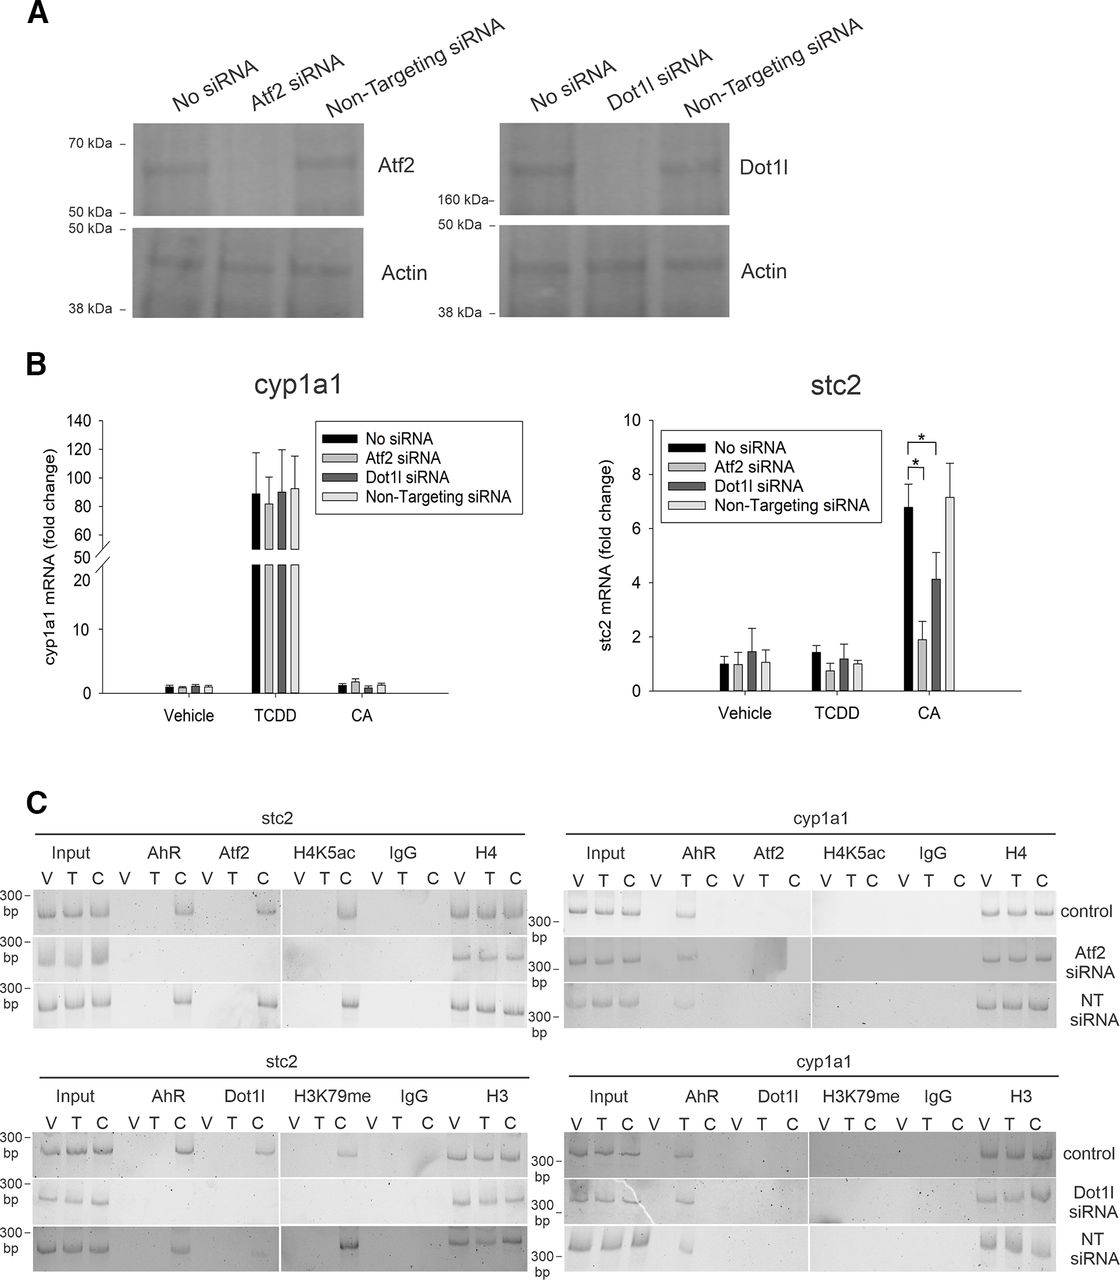
- Fig. 6.
Atf2 and Dot1l are required for the transcription regulation of stc2. (A) AML12 cells were transiently transfected with Atf2 and Dot1l siRNAs or nontargeting siRNA (NT siRNA). Twenty-four hours later, Western blotting on cell lysates was performed to monitor both Atf2 and Dot1l protein expression. Actin was used as a loading control. (B) AML12 cells, transiently transfected with Atf2, Dot1l, and nontargeting siRNA for 24 hours were treated with vehicle (DMSO), 6 nM TCDD, and 30 µM CA for 2 hours. Quantitative RT-PCR was performed to measure cyp1a1 and stc2 mRNA normalized to 18S rRNA. For statistical analysis, a mixed-effects multivariate ANOVA (MANOVA) model was used. After an overall significant F test from MANOVA model, the post hoc multiple-comparison tests were performed for the prespecified comparisons adjusted by Tukey procedure. *P < 0.05, and n = 3 independent batches of AML12 cells. (C) ChIP assays were performed on AML12 cells transiently transfected with targeted and NT siRNA and treated with vehicle, TCDD, and CA. PCR products were loaded onto two 5% polyacrylamide gels (represented by space), run, stained with SYBR Green, and imaged on Chemidoc MP imager (Bio-Rad) simultaneously with exactly identical acquisition parameters. n = 3 for stc2, and n = 2 for cyp1a1.
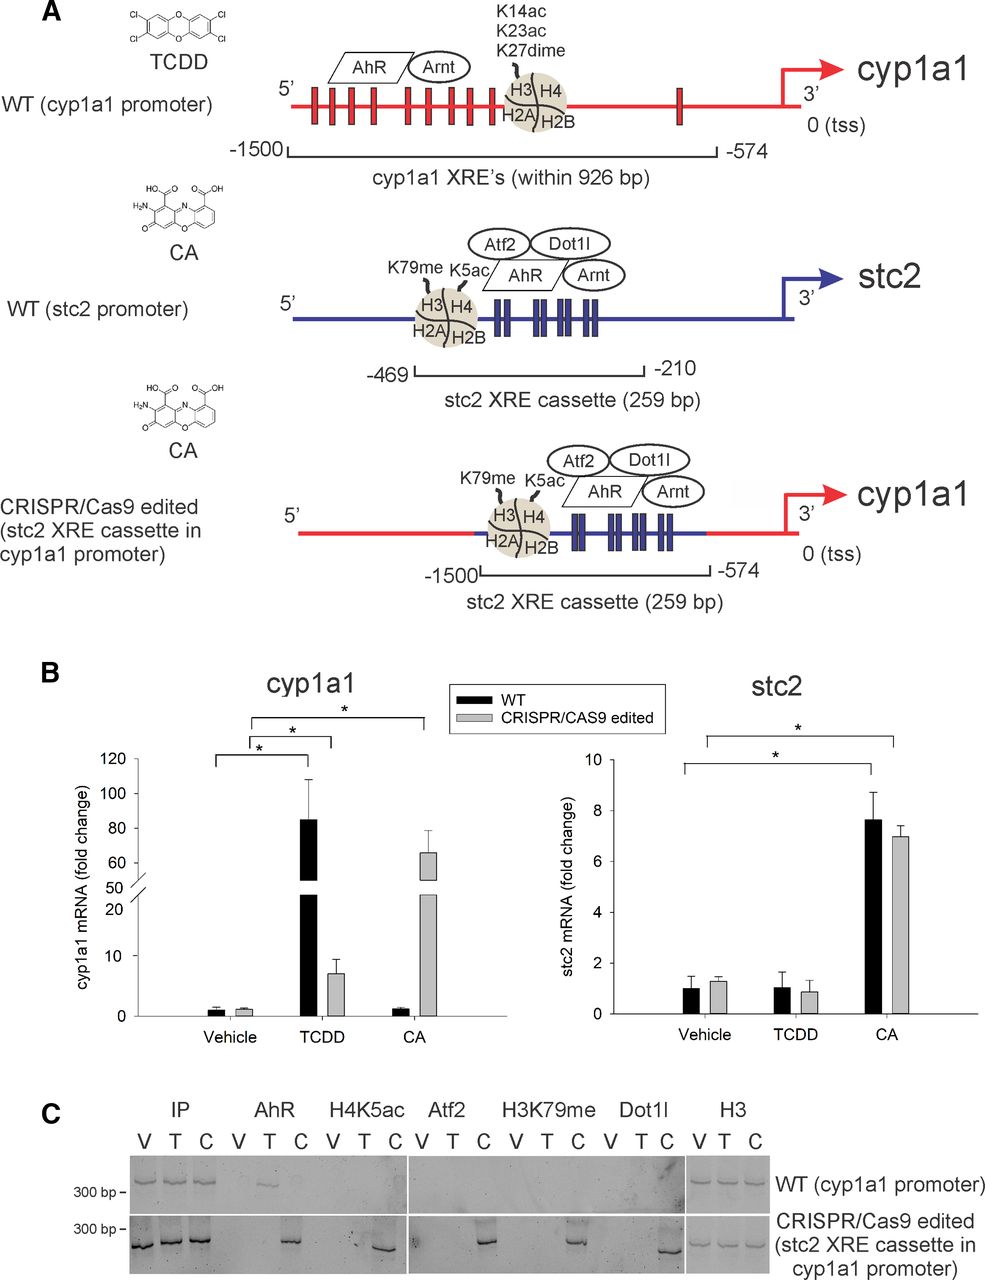
- Fig. 7.
Agonist-specific AhR target-gene expression transfers with the gene-specific “XRE cassette” in the context of chromatin architecture. An edited AML12 cell line was constructed by replacing the 926-bp cyp1a1 promoter region containing 10 XREs (between −574 and −1500 bp from the transcription start site) with the stc2 promoter containing eight XREs (the 259-bp region termed “stc2 XRE cassette” – between −210 and −469 bp from the transcription start site) using CRISPR/Cas9 technology. (A) Illustration of cyp1a1 and stc2 promoter regions. Red and blue rectangles represent XREs (5′-GCGTG-3′) within cyp1a1 and stc2 promoters respectively. CRISPR/Cas9-edited AML12 cells, wherein the 259-bp stc2 XRE cassette is inserted by replacing cyp1a1 XREs within −574 and −1500 bp, is depicted. (B) WT (black bars) and CRISPR/Cas9-edited (gray bars) AML12 cells were treated with vehicle (DMSO), 6 nM TCDD, and 30 µM CA for 2 hours. Quantitative RT-PCR was performed to measure RNA expression of cyp1a1 and stc2 and normalized to 18S rRNA. For statistical analysis, a mixed-effects multivariate ANOVA (MANOVA) model was used. After overall significant F test from MANOVA model, the post hoc multiple-comparison tests were performed by Tukey procedure. *P < 0.05, n = 3 independent batches of AML12 cells. (C) Vehicle-, TCDD-, and CA-treated, WT and edited AML12 cells were subjected to chromatin immunoprecipitation using antibodies against AhR, H4 K5ac, Atf2, H3 K79me, Dot1l, and H3 (positive control). PCR products were fractionated and visualized on 5% polyacrylamide gels stained with SYBR Green. Samples were run on separate gels (represented by space), stained with SYBR Green, and imaged on Chemidoc MP imager (Bio-Rad) synchronously with exactly the same acquisition parameters (n = 3 independent batches of AML12 cells).


Additional Files
Data Supplement
- Supplemental Figures -
Supp. Fig. 1 Junction PCR indicating successful replacement of cyp1a1 promoter XREs with the ‘stc2 XRE cassette’.
Supp. Fig. 2 Vehicle treatment does not result in target gene induction and histone post-translational modifications.
- Supplemental Figures -


