


Article Figures & Data
Figures
- Figure 1
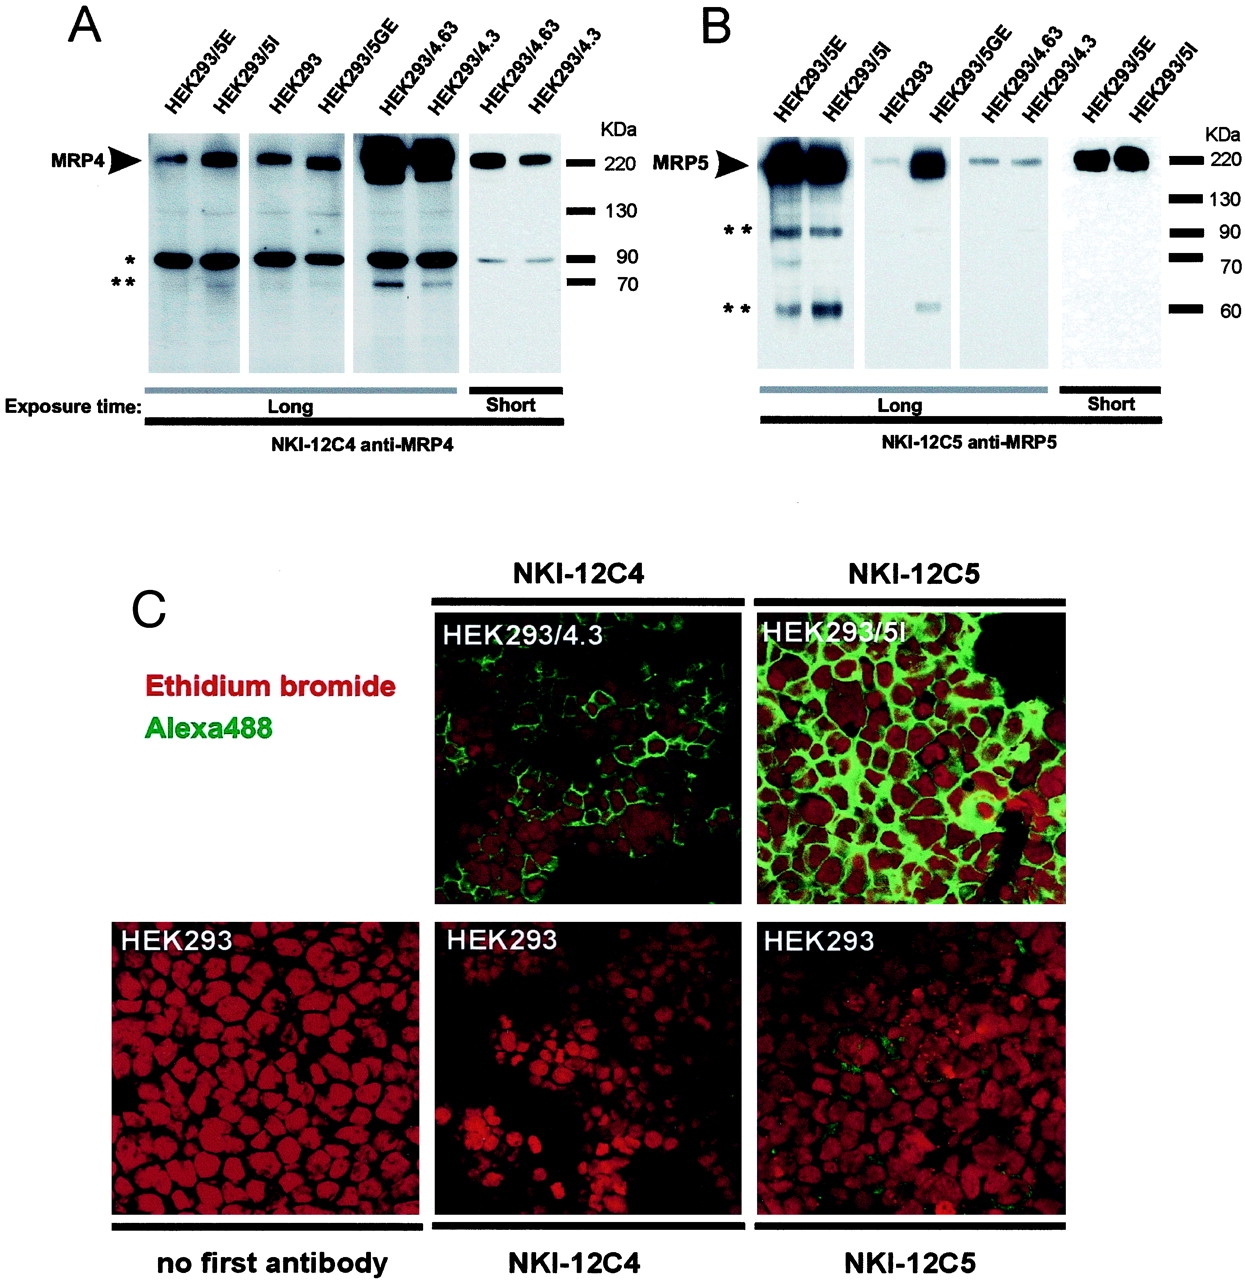
Western blot analysis and immunofluorescent detection of MRP4 and MRP5. MRP4 and MRP5 expression in the three cell lines used in this study is shown. For the Western blot, 15 μg of total protein was loaded per lane. MRP4 was detected by rat anti-human MRP4 monoclonal antibody NKI-12C4 (A) and MRP5 by rat anti-mouse MRP5 monoclonal antibody NKI-12C5 (B). Detection of MRP4 and MRP5 by immunofluorescence (C) was done on methanol-fixed cells using the indicated antibodies as outlined under Materials and Methods. MRP4- and MRP5-specific staining is shown in green, and the nuclear DNA stained by ethidium bromide is shown in red. *, ∼90 kDa band recognized by NKI-12C4 found in all cell lines; thus, it is most probably an endogenous protein. **, ∼75 kDa band in A, two bands of ∼95 and ∼60 kDa in B, of which the intensity increases with increasing MRP4 or MRP5 expression. The shorter film exposures demonstrate the relative levels of the introduced protein in the MRP4- and MRP5-overexpressing cells.
- Figure 2
HPLC analysis of reference compounds. Chromatograms of mixtures of nucleobases, nucleosides and nucleotides separated by reversed-phase ion-pairing HPLC. A, chromatogram showing the separation of guanosine (1), inosine (2), IMP (3), GMP (4), adenosine (5), AMP (6), and ATP (7), detected at 260 nm. B, chromatogram showing the separation of 6MP (8), TX (9), MPrib (10), tIMP (11), TXrib (12), and tXMP (13), detected at 330 nm. *, peaks that were derived from the Hanks' balanced salt solution in which thiopurines were dissolved. UV absorbance is given in arbitrary units. The insets show examples of absorbance spectra of indicated peaks, which were used to identify different metabolites.
- Figure 3
Uptake of 6MP. A, concentration-dependent uptake of 6MP was determined after 4 h for the HEK293 (■), HEK293/5I (○), and HEK293/MRP4.3 (▵) cells. Initial 6MP concentrations in the incubation medium were 0.5, 2.5, and 12.5 μM. After 4 h of incubation at 37°C, the 6MP concentration in the medium was determined. Uptake was determined by the difference in 6MP concentration in the medium at t = 0 andt = 4 h. B, time-dependent uptake of 2.5 μM 6MP, with symbols as in A. The extracellular 6MP concentration is plotted as picomoles per 106 cells calculated using the volume of incubation medium (1 ml) and number of cells (2 × 10⁶). Data are the mean ± S.E.M. of three independent determinations.
- Figure 4
6MP metabolites excreted by HEK293 cells. Metabolites excreted from the HEK293 (■), HEK293/5I (○), and HEK293/4.3 (▵) during continuous incubation with 6MP (initial concentration 2.5 μM). The levels of tIMP (A), tXMP (B), MPrib (C), and TXrib (D) were quantified at their UVmax wavelength, using chromatograms similar to those shown in Fig. 2. The amounts of the various thioinosine and thioxanthosine metabolites were calculated by relating the peak area of the detected metabolites with the peak area obtained with standard amounts of either 6MP or TX. The data are the mean ± S.E.M of three independent determinations. The indicated data points were significantly different (*, p < 0.05) from the parental cells in a Student's t test.
- Figure 5
Intracellular 6MP metabolites. Metabolites found in the intracellular fractions from the HEK293 (A), HEK293/4.3 (B), and HEK293/5I (C) during continuous incubation with 6MP (initial concentration, 2.5 μM). Levels of tIMP (▵), MPrib (○), tXMP (▴), and TXrib (●) were quantified by relating the peak areas of detected metabolites with the peak area obtained with a 6MP and TX standards. TX levels were below the detection limit (< 1 pmol/106 cells). The data are the mean ± S.E.M. of three independent determinations.
- Figure 6
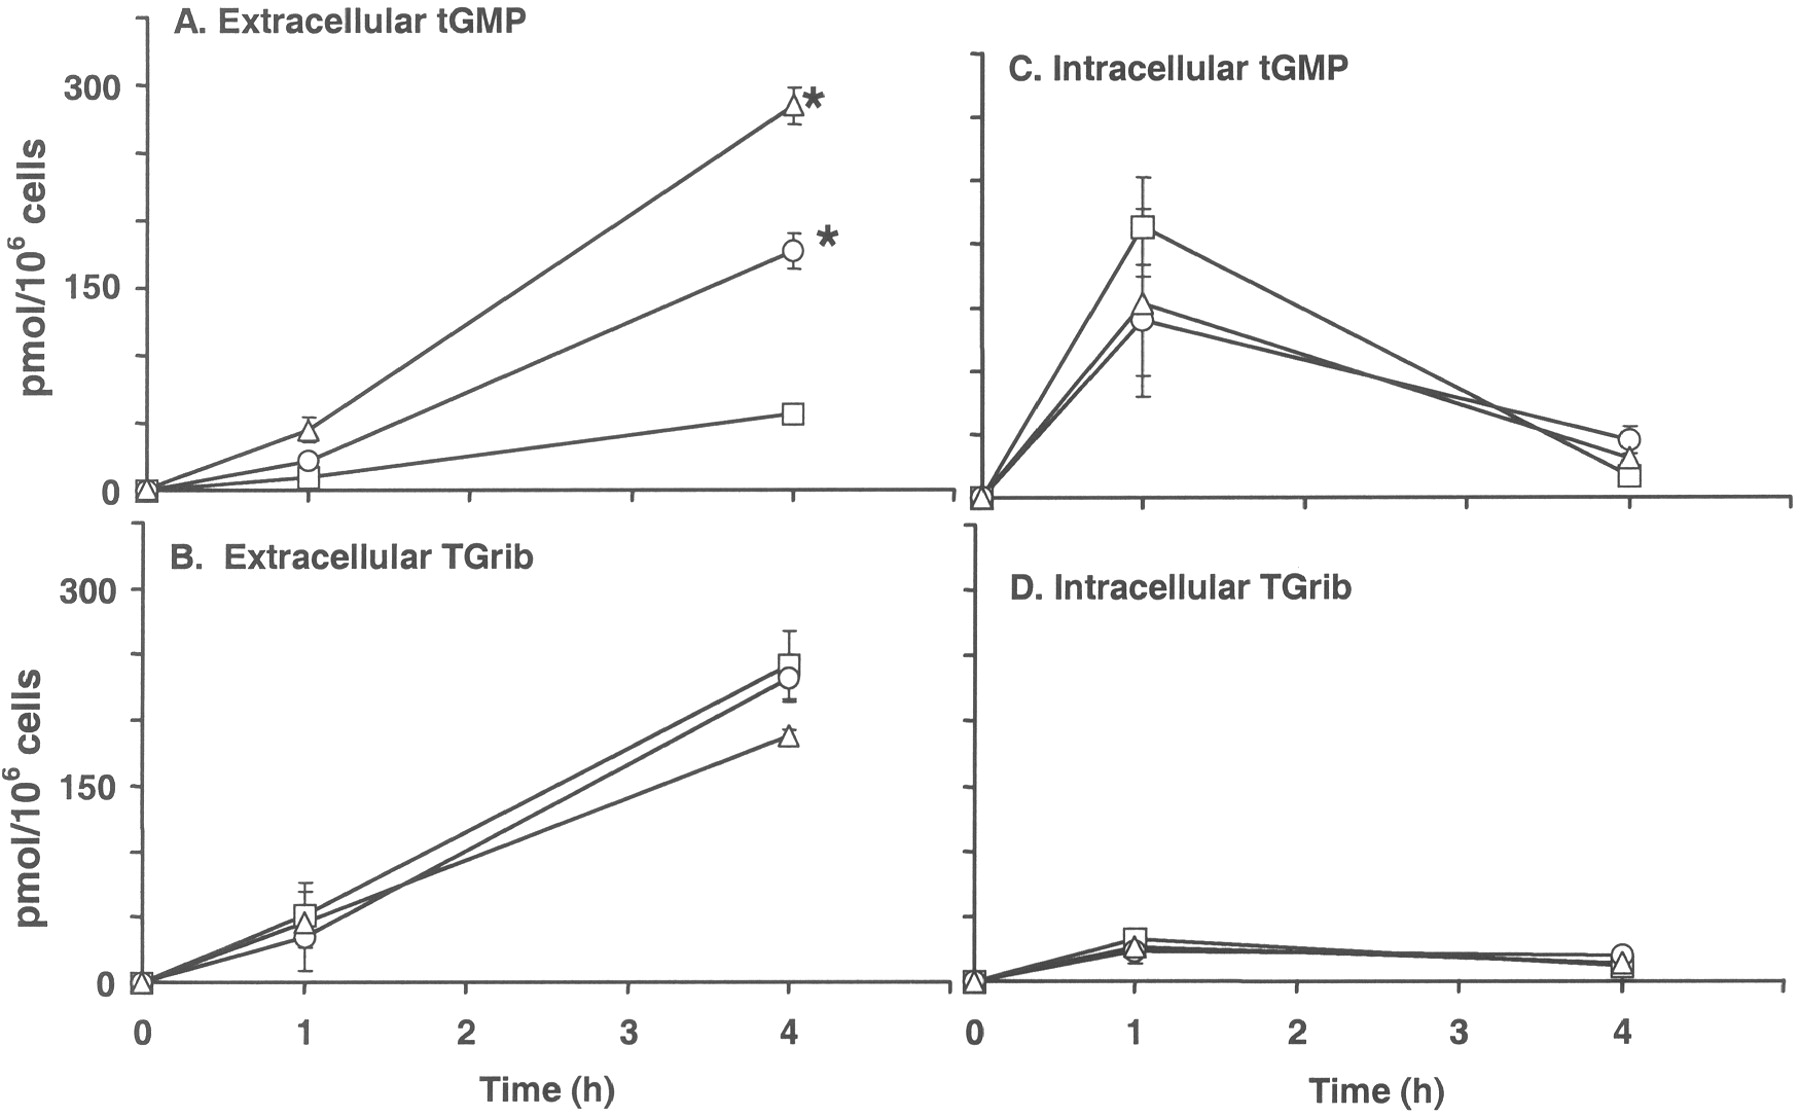
Continuous incubation with TG. Thiopurine metabolites found in the extracellular (left, A and B) and intracellular (right, C and D) fractions from the HEK293 (■), HEK293/5I (○), and HEK293/4.3 (▵) cells during continuous incubation with TG (initial concentration 2.5 μM). Thioguanine metabolite levels were quantified by relating the peak areas of detected metabolites with the peak area obtained with a TG standard. The data are the mean ± S.E.M. of three independent determinations. The indicated data points were significantly different (*, p < 0.05) from the parental cells in a Student's t test.
- Figure 7
Continuous incubation with MeMPrib. Thiopurine metabolites found in the extracellular (A) and intracellular (B) fractions from the HEK293 (squares), HEK293/5I (circles), and HEK293/4.3 (triangles) cells during continuous incubation with MeMPrib (initial concentration, 2.5 μM). Metabolite levels were quantified by relating the peak areas of detected metabolites with the peak area obtained with a standard amount of MeMPrib. The data are the mean ± S.E.M. of three independent determinations. The indicated data points were significantly different (*, p < 0.05) from the parental cells in a Student's t test.
- Figure 8
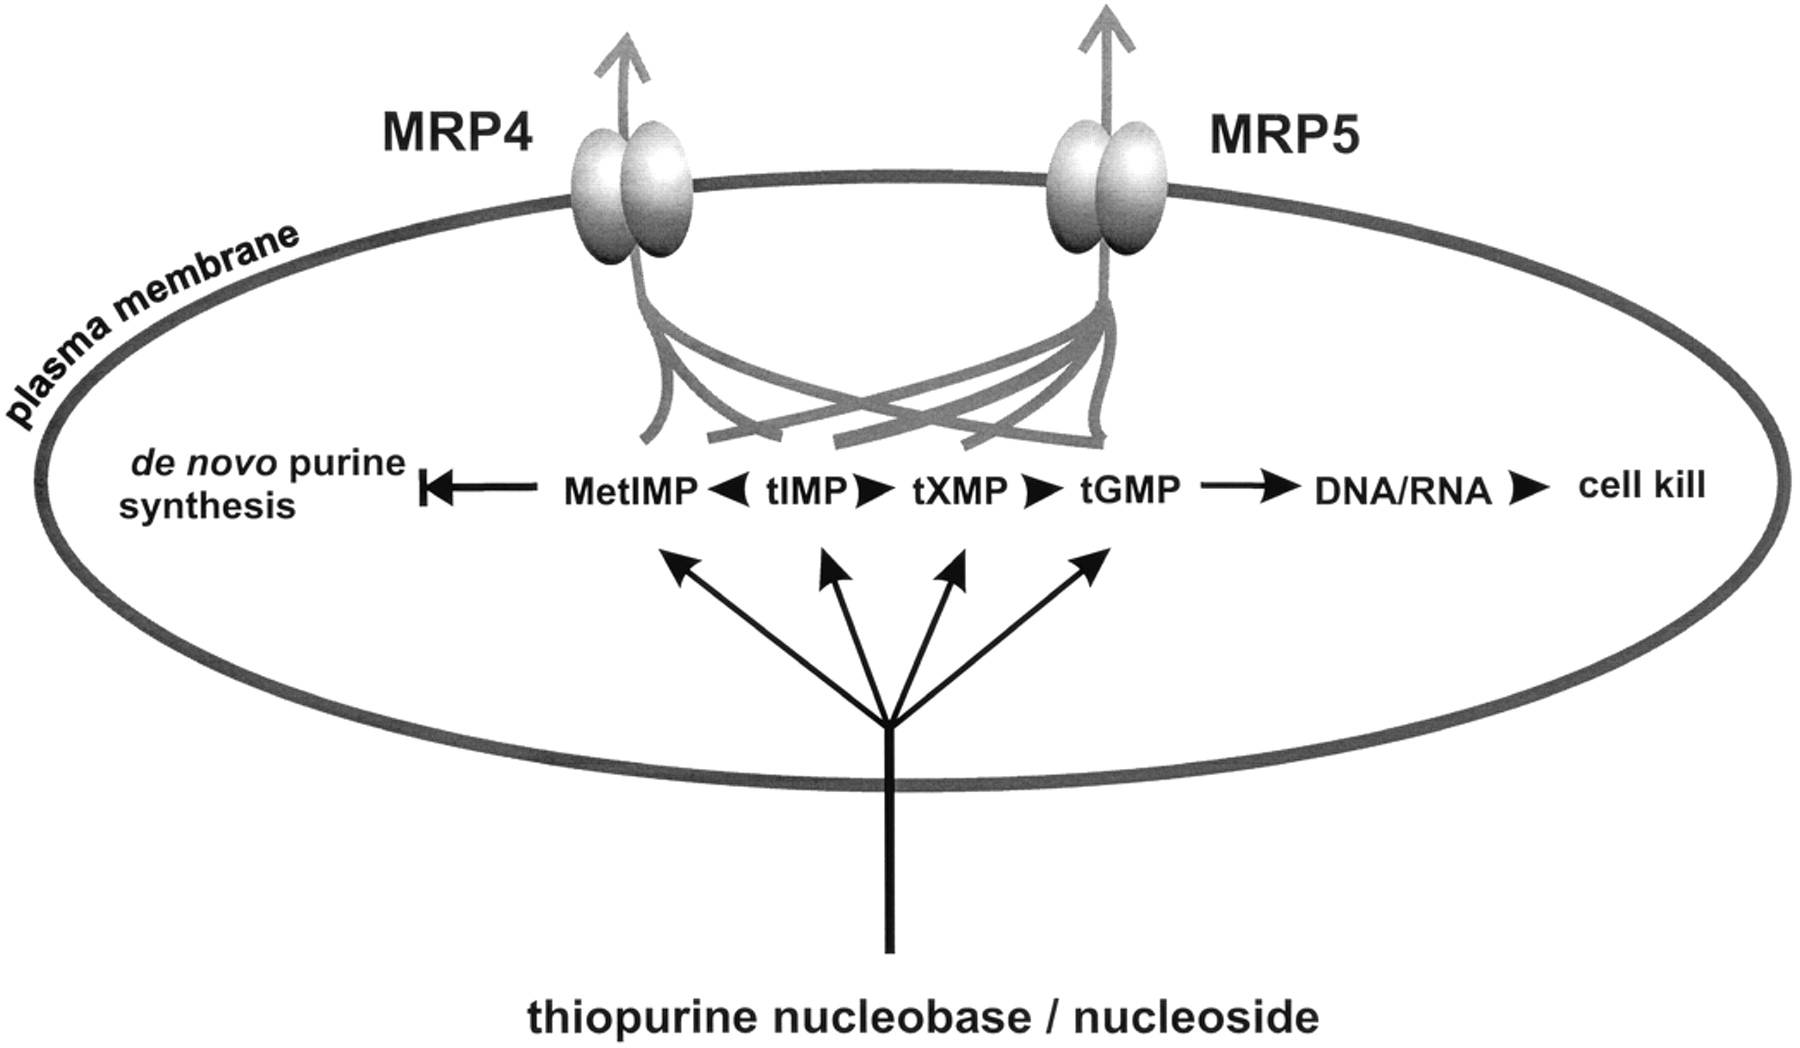
Simplified scheme showing how tNMP transport by MRP4 and MRP5 might contribute to thiopurine resistance. The tNMPs transported by MRP4 and/or MRP5 are indicated. The blocked arrow indicates inhibition of de novo purine synthesis by MetIMP.


Tables
- Table 2
Ultraviolet absorbance maximum (UVmax) and the retention times in reversed HPLC analysis for several nucleobases, nucleosides, and nucleotides used in this study
Retention Times UVmax Nucleobase Nucleoside NMP NDP NTP nm min Thioguanines 342 8.2 13.2 16.1 22.3 29.2 Thioinosines 323 7.6 12.9 15.6 22.8 29.2 Thioxanthines 343 12.6 21.5 26.2 N.D. N.D. 6-Methylated thioinosines 286 23.2 25.7 28.0 N.D. 32.6 Adenosines 260 N.D. 14.1 15.1 21.5 28.1 Note that the UVmax values of the compounds indicated per row are the same.
-
NMP, nucleoside monophosphate; NDP, nucleoside diphosphate; NTP, nucleoside triphosphate; N.D., not determined.
-
IC50 Relative Resistance HEK293 HEK293/5I HEK293/5E HEK293/4.3 HEK293/4.63 μM 6MP 5.2 ± 0.9 3.11-a 2.51-a 2.7 ± 0.4 5.6 ± 2.4 TG 1 ± 0.2 2.11-a 2.31-a 2.6 ± 0.6 4.1 ± 0.1 Values are the concentration at which the growth inhibition was 50% of the maximum growth (IC50). The relative resistance is calculated as the IC50 ratio of the transduced cells and the parental cells. Data are the mean (± S.E.M.) of at least three experiments.
-
↵1-a Wijnholds et al. (2000).
-
6MP TG MeMPrib tIMP3-a tXMP3-b MPrib3-a TXrib3-b TX3-b tGMP3-c TGrib3-c MetIMP3-c pmol/106cells/min HEK293 0.09 0.00 2.04 0.46 0.33 0.24 1.02 1.3 HEK293/4.3 0.56 0.00 1.45 0.69 0.13 1.22 0.78 3.2 HEK293/5I 0.64 0.36 1.68 0.49 0.11 0.77 1.00 1.9 The excretion rates for the different metabolites formed in HEK293 cells after incubation with the thiopurine precursors 6MP, TG and MeMPrib (see text for details). Slopes were calculated by a simple linear regression using those time points for which the rate was relatively constant.


