


Visual Overview

Abstract
The endogenous ligand-activated aryl hydrocarbon receptor (AHR) plays an important role in numerous biologic processes. As the known number of AHR-mediated processes grows, so too does the importance of determining what endogenous AHR ligands are produced, how their production is regulated, and what biologic consequences ensue. Consequently, our studies were designed primarily to determine whether ER−/PR−/Her2− breast cancer cells have the potential to produce endogenous AHR ligands and, if so, how production of these ligands is controlled. We postulated that: 1) malignant cells produce tryptophan-derived AHR ligand(s) through the kynurenine pathway; 2) these metabolites have the potential to drive AHR-dependent breast cancer migration; 3) the AHR controls expression of a rate-limiting kynurenine pathway enzyme(s) in a closed amplification loop; and 4) environmental AHR ligands mimic the effects of endogenous ligands. Data presented in this work indicate that primary human breast cancers, and their metastases, express high levels of AHR and tryptophan-2,3-dioxygenase (TDO); representative ER−/PR−/Her2− cell lines express TDO and produce sufficient intracellular kynurenine and xanthurenic acid concentrations to chronically activate the AHR. TDO overexpression, or excess kynurenine or xanthurenic acid, accelerates migration in an AHR-dependent fashion. Environmental AHR ligands 2,3,7,8-tetrachlorodibenzo[p]dioxin and benzo[a]pyrene mimic this effect. AHR knockdown or inhibition significantly reduces TDO2 expression. These studies identify, for the first time, a positive amplification loop in which AHR-dependent TDO2 expression contributes to endogenous AHR ligand production. The net biologic effect of AHR activation by endogenous ligands, which can be mimicked by environmental ligands, is an increase in tumor cell migration, a measure of tumor aggressiveness.
Introduction
The aryl hydrocarbon receptor (AHR) is the only ligand-binding member of the evolutionarily conserved (Hahn, 2002) basic Helix-Loop-Helix/Per-Arnt-Sim family of transcription factors (Hahn, 1998, 2002). Basic Helix-Loop-Helix/Per-Arnt-Sim proteins contribute to several important physiologic processes, including regulation of circadian rhythm (Garrett and Gasiewicz, 2006), responses to hypoxia (Ichihara et al., 2007; Hirota, 2015), and vascular (Lahvis et al., 2005) and neuronal development (Huang et al., 2004; Hester et al., 2007).
The AHR originally gained notoriety for its role in environmental chemical sensing and metabolism (Ema et al., 1994). However, the known scope of its role in mammalian physiology has quickly expanded as accumulating evidence demonstrates that, like other PAS family members, the AHR plays a critical role in several important biologic processes. For example, AHR−/− mice exhibit cardiovascular, hepatic, and reproductive abnormalities (Fernandez-Salguero et al., 1995, 1997; Schmidt et al., 1996; Andreola et al., 1997; Abbott et al., 1999; Benedict et al., 2000; Lahvis et al., 2000, 2005; Thackaberry et al., 2002; Vasquez et al., 2003; Barnett et al., 2007); develop colitis (Fernandez-Salguero et al., 1997) and immune system deficiencies (Fernandez-Salguero et al., 1997; Kerkvliet, 2009; Kimura et al., 2009); and produce hematopoietic stem cells that are prone to stem cell exhaustion. Furthermore, the AHR influences responses to hypoxia (Jensen et al., 2006), TH17, and T regulatory cell development (Funatake et al., 2005; Quintana et al., 2008; Apetoh et al., 2010; Gagliani et al., 2015), antigen presentation (Mezrich et al., 2010; Nguyen et al., 2010), and embryonic (Wang et al., 2013b) and hematopoietic (Casado et al., 2011; Smith et al., 2013) stem cell differentiation. Given these findings, it seems likely that aberrant AHR signaling, mediated by exposure to environmental ligands or by excessive production of endogenous ligands, could contribute to multiple pathologic outcomes. In this work, we focus on chronic AHR signaling through production of endogenous ligands in breast cancer cells, leading to increased tumor cell migration.
Recent evidence suggests that the AHR plays a critical role in cancer progression. The AHR is hyperexpressed and chronically active (Chang and Puga, 1998; Roblin et al., 2004; DiNatale et al., 2011; Gramatzki et al., 2009) in glioblastoma (Gramatzki et al., 2009; Opitz et al., 2011), lymphoma (Sherr and Monti, 2013), T cell leukemia (Hayashibara et al., 2003), and pancreatic (Koliopanos et al., 2002; Jin et al., 2015), ovarian (Wang et al., 2013a), lung (Chang et al., 2007), liver (Liu et al., 2013), and head and neck carcinomas (DiNatale et al., 2011). A role for the AHR in breast cancer in particular is suggested by the following: 1) a high level of constitutively active AHR in rodent and human breast cancer models and in primary human tumors (Wang et al., 1999; Kim et al., 2000; Trombino et al., 2000; Larsen et al., 2004; Currier et al., 2005; Schlezinger et al., 2006; Barhoover et al., 2010; Korzeniewski et al., 2010; Goode et al., 2013; Li et al., 2014); 2) a correlation between AHR activity and transcriptional upregulation of genes associated with invasion (Belguise et al., 2007) and survival (Vogel et al., 2011); 3) AHR-mediated degradation of E-cadherin (Chen et al., 2014); 4) downregulation of invasion and metastasis-associated genes after AHR knockdown (Goode et al., 2014); 5) inhibition of breast cancer cell line invasion, migration, metastasis, or mammosphere formation following AHR inhibition (Parks et al., 2014) or knockdown (Goode et al., 2013; Zhao et al., 2013); and 6) acquisition of an invasive phenotype after ectopic expression of AHR in nonmalignant breast epithelial cells (Brooks and Eltom, 2011). Paradoxically, AHR hyperactivation with exogenous ligands may also lead to reduced breast cancer cell invasion (Hall et al., 2010; Prud'homme et al., 2010; Zhao et al., 2012; Safe et al., 2013; Jin et al., 2014), suggesting that endogenous and exogenous ligands may induce different signaling pathways in a context-specific fashion (Schlezinger et al., 2006; Murray et al., 2014).
The nature and regulation of the endogenous ligands driving constitutive AHR activity are poorly understood. Our interest in a possible link between tryptophan metabolism and the AHR in breast cancer stems from the observations that aberrant tryptophan metabolism has long been associated with breast cancer (DeGeorge and Brown, 1970; Bell et al., 1971, 1975; Davis et al., 1973; Fahl et al., 1974; Lehrer et al., 1988; Cascino et al., 1991, 1995; Chen et al., 2009; Chung and Gadupudi, 2011; Lyon et al., 2011) and that the kynurenine pathway, which accounts for nearly 90% of tryptophan metabolism in humans (Chung and Gadupudi, 2011), is a source of endogenous AHR ligands (Heath-Pagliuso et al., 1998; Mezrich et al., 2010; Nguyen et al., 2010; Chung and Gadupudi, 2011; Opitz et al., 2011). The rate-limiting step in the kynurenine pathway is the conversion of L-tryptophan to N-formyl-kynurenine by indoleamine-2,3-dioxygenase 1/2 (IDO1/2) or tryptophan-2,3-dioxygenase (TDO) (Opitz et al., 2011; van Baren and Van den Eynde, 2015). N-formyl-kynurenine is then hydrolyzed to L-kynurenine (KYN), which is metabolized further into kynurenic acid (KA) and xanthurenic acid (XA), all three of the latter being inducers of AHR activity (DiNatale et al., 2010). Of note, two studies implicated TDO in generating endogenous AHR ligands responsible for tumor invasiveness (Opitz et al., 2011; D'Amato et al., 2015).
The apparent role of the kynurenine pathway in cancer and in AHR activation, combined with the ability of endogenous ligand-activated AHR to contribute to malignancy, led us to hypothesize that tryptophan metabolites, generated via the IDO1/2 and/or TDO-dependent kynurenine pathway, drive AHR activity and promote tumor cell migration. Furthermore, data from studies investigating the role of the AHR and tryptophan metabolites in the immune system suggest the potential for the AHR to regulate IDO1/2 transcription and, thereby, production of immunosuppressive tryptophan metabolites (Vogel et al., 2008). Therefore, we further predicted that endogenous (e.g., KYN, XA, KA) AHR ligands drive IDO1/2 or TDO2 expression and increase production of tryptophan-derived metabolites in a positive feedback loop within the tumor cells, thereby favoring tumor aggressiveness. Cell lines derived from human triple-negative (ER−/PR−/HER2−) (Hs578T, BP1, MDA-MB-231), triple-negative inflammatory (SUM149), or single-positive, Her2+ breast cancers, as well as nonmalignant mammary epithelial (MCF10F) cells were used to test these predictions. This study focused primarily on ER-negative cell lines specifically to observe AHR signaling that is independent of the ER signaling pathway and to determine whether either tryptophan oxygenase or the AHR represents a viable therapeutic target in subsets of aggressive breast cancers for which effective targeted therapeutics are lacking.
Materials and Methods
Chemicals.
Dimethylsulfoxide (DMSO), 2,3,7,8-tetrachlorodibenzo[p]dioxin (TCDD), tryptophan, KYN, XA, and KA were obtained from Sigma-Aldrich (St. Louis, MO). Puromycin was purchased from Invitrogen (Grand Island, NY). 6-Formylindolo[3,2-b]carbazole (FICZ) and CH223191 were synthesized and generously provided by M. Pollastri (Northeastern University, Boston, MA).
Cell Culture and Media.
MCF10F and BP1 [invasive tumor-forming cells generated by treatment of MCF10F cells with benzo[a]pyrene (B[a]P) (Calaf and Russo, 1993)] cells were cultured according to American Type Culture Collection (American Type Culture Collection, Manassas, VA) recommendations but without cholera-toxin and with 100 IU/ml penicillin, 100 μg/ml streptomycin (Mediatech, Hernon, VA), and 5 μg/ml plasmocin (Invivogen, San Diego, CA). MDA-MB-231 and cells were cultured in Dulbecco’s modified Eagle’s medium (Mediatech) containing 10% FCII (Hyclone), 100 IU/ml penicillin, 100 μg/ml streptomycin (Mediatech), and 2 mM L-glutamine (Mediatech). MDA-MB-231-BO cells, a luc-expressing bone-seeking metastatic line derived from the MDA-MB-231 line (Yoneda et al., 2001; Wetterwald et al., 2002), were grown as for MDA-MB-231 cells with the addition of 800 μg/ml geneticin (Invitrogen). Hs578T cells, obtained from the American Type Culture Collection, were cultured in F-12 medium (Mediatech, Herndon, VA) containing 10% fetal bovine serum (FBS; Sigma-Aldrich), 19.4 mM D-glucose (Sigma-Aldrich; cell culture tested), 100 IU/ml penicillin, 100 μg/ml streptomycin (Mediatech), 5 μg/ml plasmocin (Invivogen), 2 mM L-glutamine (Mediatech), and 10 μg/ml insulin (Sigma-Aldrich). SUM149 cells were maintained in F-12K medium (Mediatech) containing 5% FBS (Sigma-Aldrich), 0.5 μg/ml hydrocortisone (Sigma-Aldrich), 2 mM L-glutamine (Mediatech), 100 IU/ml penicillin, 100 μg/ml streptomycin (Mediatech), 10 μg/ml insulin (Sigma-Aldrich), and 5 μg/ml plasmocin (Invivogen). HCC202 cells (obtained from American Type Culture Collection) were maintained in RPMI (Corning) containing 10% FBS, according to American Type Culture Collection recommendations, supplemented wtih 100 IU/ml penicillin and 100 mg/ml streptomycin (Mediatech). Stably transduced Hs578T cells were maintained in culture containing 1.5 μg/ml puromycin and transferred to puromycin-free medium 3–5 days prior to experiments. Where indicated, cultures were supplemented up to 16 mg/L tryptophan. Culture conditions were maintained at 37°C, 5% CO2.
Immunohistochemistry.
Immunohistochemistry was performed at the Boston University Immunohistochemistry Core Facility on 5-μm serial sections of paraffin-embedded, invasive breast ductal carcinoma in a tissue microarray (US Biomax, Rockville, MD) by standard protocol on an intelliPATH Automated Slide Staining System from Biocare Medical (Concord, CA). The array had serial sections (5 μm) of primary tissue and matched lymph nodes from 50 cases. After heading slides for 15 minutes at 60°C, samples were deparaffinized with xylene and rehydrated through graded alcohols to distilled water. The Diva Decloaker (Biocare Medical) reagent was then used for antigen retrieval at 100°C for 35 minutes, and then at 85°C for 10 minutes. Slides were incubated with Biocare Medical Peroxidase 1 solution at room temperature for 10 minutes, washed with Tris-buffered saline/Tween 20 (TBST), blocked with Biocare Medical Background Sniper for 30 minutes, and washed. Rabbit AHR-specific antibody (clone H-211, 1:200 dilution; Santa Cruz Biotechnology, Santa Cruz, CA) or rabbit TDO-specific antibody (clone NBP2-13424, 1:100 dilution; Novus Biologicals, Littleton, CO) was diluted in Da Vinci Green Diluent and incubated at room temperature for 2 hours and washed in TBST (optimal antibody concentrations were calibrated with sets of normal and malignant tissue). Incubation in Biocare Medical Mach 4 Universal HRP Polymer was then performed for 30 minutes, followed by washing in TBST. Diaminobenzidine was diluted in diaminobenzidine substrate buffer and applied to slides for 5 minutes, followed by washing in deionized H2O. A light hematoxylin stain was applied, and the slides were dehydrated, air dried, and mounted, using EcoMount and a coverslip. Photomicrographs were taken with a Nikon Deconvolution Wide-Field Epifluorescence System microscope connected to a Q Capture Olympus camera and using NIS Elements software (B15; Boston, MA). No stain was detectable when substituting rabbit IgG for AHR- or TDO-specific antibody (data not shown).
Real-Time Quantitative Polymerase Chain Reaction.
The RNeasy Plus Mini Prep Kit (Qiagen, Valencia, CA) was used for RNA recovery, and cDNA was prepared using the GoScript Reverse Transcription System (Promega, Madison, WI) with a 1:1 mixture of oligo(dT)15 and random primers. The GoTaq RT-qPCR Master Mix System (Promega) was used for real-time quantitative polymerase chain reaction (RT-qPCR) reactions. Validated primers were purchased from Qiagen: human CYP1B1-QT00209496, TDO2-QT00027902, 18S-QT00225897, IDO1-QT00000504, and IDO2 -QT01662920. A 7900HT Fast Real-Time PCR instrument (Applied Biosystems, Carlsbad, CA) was used for RT-qPCR reactions with hot-start activation at 95°C for 2 minutes and 40 cycles of denaturation (95°C for 15 seconds) and annealing/extension (55°C for 60 seconds). The threshold value for 18S RNA for normalization and the relative gene expression were determined using the Pfaffl method (Pfaffl, 2001).
For quantitative polymerase chain reaction (qPCR) analysis presented in Supplemental Fig. 2, total RNA was extracted using the RNeasy Plus Mini Kit (Qiagen), according to the manufacturer’s instructions. RT-qPCR analysis was conducted on StepOnePlus Real-Time PCR System. Relative mRNA expression was quantified using the comparative Ct (ΔΔCt) method according to the ABI manual (Applied Biosystems, Foster City, CA). Amplification of 18s was used in each reaction as an internal reference gene. TaqMan probes were used for the human IDO1 (Hs00984148_m1) and 18S (Hs99999901_s1) from the TaqManGene Expression Assays (Applied Biosystems).
Protein Extraction and Western Immunoblotting.
Cells were grown to 70% confluence in T75 (75-cm2) flasks and harvested with trypsin. The cells were lysed in radioimmunoprecipitation assay buffer (Fisher Scientific, Pittsburgh, PA) containing protease and phosphatase inhibitors (Sigma-Aldrich). Immunoblotting was performed, as previously described (Parks et al., 2014). Blots were incubated overnight with TDO (1:1000, SAB1411338; Sigma-Aldrich)-, AHR (1:1000, 13790; Cell Signaling Technologies, Danvers, MA)-, or CYP1B1 (1:1000, sc-32882; Santa Cruz Biotechnology)-specific antibody produced in rabbit and with β-actin–specific antibody (1:2000, A5441; Sigma-Aldrich) to control for loading variability.
Liquid Chromatography/Mass Spectrometry Analysis.
To prepare metabolite extracts from cell lysates, Hs578T cells were cultured in 225-cm3 flasks for 4 days and metabolite extraction was performed using an 80% (vol/vol) cold methanol extraction method (Yuan et al., 2012). To determine extraction efficiency, a spiked cell lysate sample was prepared by addition of recovery standards after the cells were harvested in ice-cold methanol and transferred to 15-mL conical tubes. To determine sample concentration, titrated doses of recovery standards were dissolved in 80% (vol/vol) cold methanol. Final extracts and standards were lyophilized and stored in −80°C until further analysis.
For tandem liquid chromatography/mass spectrometry (LC/MS) analysis, a triple-quadrupole linear ion trap mass spectrometer (3200 TRAP; AB Sciex, Foster City, CA), coupled to a binary pump high-pressure liquid chromatography (1200 Series, Agilent, Santa Clara, CA), was used. Chromatographic separation was achieved based on hydrophilic interaction on an aminopropyl column (Luna 5 μm NH2 100 Å 250 mm × 2 mm; Phenomenex, Torrance, CA) using a solvent gradient method. Solvent A was a solution of ammonium acetate (20 mM) and ammonium hydroxide (20 mM) in water with 5% acetonitrile (v/v) (pH 9.45) (Bajad et al., 2006). Solvent B was neat acetonitrile. The following gradient was used: t = 0, 85% B; t = 15 minutes, 100% B; t = 28 minutes, 100% B; t = 30 minutes, 15% B; t = 50 minutes, 15% B. Prior to sample analysis, mass spectrometry (MS) parameters were optimized by direct infusion with KYN, XA, and KA using commercial metabolite solutions (10 μΜ in MS-grade de-ionized water). The mass analyzer was operated in negative ion mode for KYN and KA and in positive mode for XA. The following mass transitions were used in the MRM scans and for quantification: KYN, m/z 207.0 > 143.8; KA, m/z 187.9 > 143.8; XA, m/z 206.0 > 160.0.
For sample analysis, each lyophilized cell extract pellet was dissolved in 50–80 μL MS-grade DI water. Peak identification and integration were performed using Analyst software (version 1.6; ABSciex, Foster City, CA). Sample concentrations were determined from standard curves for each metabolite. Intracellular concentrations were determined using the number of cells from which extracts were prepared and an approximate mammalian epithelial cell volume of 2000 μm3 (Milo et al., 2010).
Colorimetric Kynurenine Assay.
Collected cell supernatants were stored at −20°C until colorimetric analysis. For analysis, 160 μL supernatant was added to 96-well culture plate and mixed with 10 μL/well 30% (v/v) freshly prepared trichloroacetic acid. The plate was incubated at 50°C for 30 minutes to hydrolyze N-formyl-kynurenine to kynurenine and then centrifuged at 3000g for 10 minutes. Supernatant–trichloroacetic acid solution (100 μL) was transferred to a flat-bottom 96-well black plate and mixed with 100 μL freshly prepared Ehrlich’s reagent (1.2% w/v 4-dimethylamino-benzaldehyde in glacial acetic acid). The plate was incubated for 10 minutes at room temperature, and absorbance was read with a microplate reader at 492 nm. Culture medium that was not exposed to cells was used as time 0 supernatant.
Stable Cells Expressing Small Hairpin TDO2 and TDO2.
Lentivirus preparation and transduction were performed according to the manufacturer’s protocol. Lentivirus-based TDO2 small hairpin (sh)RNA (TRCN0000064900), control plasmid (SHC016 1EA), and lentiviral packaging mix were purchased from Sigma-Aldrich. TDO2 lentiviral vector (pLenti-GIII-CMV-Human-TDO2-GFP-2A-Puro Lentiviral Vector, LV332282) was purchased from Applied Biologic Materials (Richmond, Canada). Control, shTDO2, or TDO2 plasmids were cotransfected with the packaging plasmids into 293T cells using Lipofectamine 2000 (Invitrogen, Carlsbad, CA). Forty-eight hours after transfection, the virus-containing supernatants were harvested and centrifuged at 3000 rpm for 15 minutes and filtrated through a 0.45-μm low protein–binding filter (Millipore, Bedford, MA). Hs578T and SUM149 cells were infected with lentivirus (3 multiplicities of infection) in the presence of hexadimethrine bromide (5 μg/mL polybrene; Sigma-Aldrich) and fed with fresh complete medium the next day. Seventy-two hours after infection, the transduced cells were selected by puromycin (2 μg/ml). Efficiency of TDO knockdown or overexpression was validated by qRT-PCR and immunoblot analyses. Cells were cultured thereafter in 1.5 μg/ml puromycin and changed to puromycin-free medium 3–5 days prior to each experiment.
Stable, Doxycycline-Inducible AHR-Specific shRNA-Expressing Cells.
Viral transduction particles were generated with a doxycycline (DOX)-inducible TurboRFP-shAHR TRIPZ lentiviral vector (Open Biosystems, Huntsville, AL). Hs578T cells were transduced at an optimal multiplicity of infection of 25 in medium containing hexadimethrine bromide (8 μg/mL polybrene; Sigma-Aldrich). Transduced cells were maintained in 1.5 μg/ml puromycin (Invitrogen, Grand Island, NY). Red fluorescent protein expression was maximal 48 hours after DOX treatment (1.5 μg/ml) of transduced cells.
CRISPR-Cas9–Mediated AHR Deletion in MDA-MB-231 Cells.
The CRISPR expression vector lentiCRISPR v2 (Addgene no. 52961, Cambridge, MA) containing hCas9 and single-strand guide RNA was digested with BsmBI. A pair of annealed human AHR oligonucleotides was cloned into the guide RNA scaffold, as described (Sanjana et al., 2014). The two target sites are located in the first exon of the AHR (5′-CCTACGCCAGTCGCAAGCGG-3′ and 5′-CCGAGCGCGTCCTCATCGCG-3′, NM_001621). To rule out off-target effects, the guide RNA sequence was searched using an online-based web tool (http://genome-engineering.org/). MDA-MB-231 cells were infected with AHR lentiCRISPR v2‐Cas9‐single-strand guide RNA lentivirus, according to the standard protocol (Sanjana et al., 2014). Cells were selected for 10 days with 2.0 μg/ml puromycin. AHR knockout was confirmed by Western blotting, as previously described (Stanford et al., 2016a), and direct qPCR sequencing.
Transient Transfection.
MCF10F cells (2 × 10⁴ in 500 μL complete medium) were plated in a 24-well plate, allowed to adhere overnight, and cotransfected with the AHR response element-driven firefly luciferase reporter construct pGudluc (1 µg/mL; generously provided by M. Denison, University of California, Davis, CA) and CMV-green (0.5 µg/mL) using TransIT-2020 transfection reagent (Mirus, Madison, WI). After 24 hours, the medium was replaced. Cells were left untreated or dosed with vehicle (DMSO, 0.1%) and titrated doses of KYN, KA or XA, or CH223191 (10 μM) and harvested after 24 hours in Glo Lysis Buffer (Promega, San Luis Obispo, CA). Luciferase activity was determined with the Bright-Glo Luciferase System, according to the manufacturer’s instructions (Promega). Luminescence and fluorescence were determined using a Synergy2 multifunction plate reader (Bio-Tek, Winooski, VT). shTDO2-expressing Hs578T cells were transiently transfected with pGudLuc and CMV-green 24 hours after plating, and luminescence was determined 24 hours later, as described above.
For transient small interfering RNA (siRNA)-mediatedTDO2 knockdown, Hs578T cells were transfected with 5 nM of each of two TDO2-directed siRNA duplex constructs (5′-GCAGCGAAGAAGACAAAUCACAAAC-3′ and 5′-CCACUUAAUGUAAUCACUAUCUCAT-3′) or 10 nM scrambled siRNA duplex (5′-CGUUAAUCGCGUAUAAUACGCGUAT-3′). Fresh medium was added 24 hours later. Cells then were transfected with pGudluc and CMV-green, as above, and luminescence was determined 24 hours later.
Scratch-Wound Assay.
Confluent monolayers of SUM149 cells were pretreated in six-well plates with vehicle (0.1% DMSO), 10–100 μM XA, 50–100 μM KYN, 0.5 μM FICZ, 1 μM B[a]P, or 1 nM TCDD with or without 10 μM CH223191; serum starved for 24 hours; scratched with a p200 pipette tip; and washed with phosphate-buffered saline to remove nonadherent cells. Photographs were taken at the same location relative to the scratch at time 0 and every day thereafter. The media was changed, and cells were redosed daily. TScratch software (Tobias Gebäck and Martin Schulz, ETH Zurich, Zurich, Switzerland) was used to quantify the closure of the scratch over time. None of these treatments affected cell viability or cell proliferation rates as determined by 3-(4,5-dimethylthiazol-2-yl)-2.5- diphenyltetrazolium bromide) (MTT) assays.
Gene Expression Preprocessing.
Fifty-eight breast cancer cell lines from the Cancer Cell Line Encyclopedia containing Affymetrix U133 Plus 2.0–based transcriptomic information (Barretina et al., 2012) were used to assess correlations between AHR and CYP1B1 expression. These data were normalized using Robust Multi-Array Average (Irizarry et al., 2003) using the R/Bioconductor (http://www.R-project.org) package ‘affy,’ with raw probe levels mapped to Ensembl gene identifiers based on the custom Brainarray chip definition files (Dai et al., 2005). Similarly, transcriptomic information from 977 primary mammary epithelial tumor samples and adjacent normal tissue from The Cancer Genome Atlas (TCGA) (Cancer Genome Atlas Network, 2012) were used. The TCGA portal provides level 3, fragments per kilobase of exon per million reads mapped-normalized count data, which were used to determine relative TDO2 mRNA levels and to analyze correlations between AHR and CYP1B1 within primary tissues. TCGA provides immunohistochemistry data on estrogen, progesterone, and Her2 receptor status, as well as tissue sample status (tumor versus adjacent normal tissue) and tumor stage data, which were used to stratify the data based on ER, progesterone, and Her2 receptor status or on staging. All Pearson correlations, false discovery rate (FDR) corrections, and plots were performed using the statistical programming language R.
For TDO2 expression analyses, TCGA data were retrieved from level 3 RNASeq version 2. Transcript abundance was estimated by RNA-Seq by Expectation Maximization (RSEM) package (Li and Dewey, 2011). RSEM estimated values were normalized using sample-specific scaling factors (75th percentile) and multiplied by 1000. An added pseudo-count of one was used to compare log2-normalized expression of TDO2 in tumor versus tumor-adjacent normal samples. The P values for TDO2 expression comparisons were calculated using Welch's unequal variances t test in R.
Statistical Analyses.
Statistical analyses were performed with Prism (GraphPad Software, La Jolla, CA) or StatPlus (Alexandria, VA). Data are presented as mean + S.E.M. where applicable. One-way analyses of variance (simple) or a Student t test was used as indicated to determine significance.
Results
AHR and TDO Expression in Human Breast Cancer.
Previous studies demonstrate that the AHR is constitutively active in several different types of cancers (Chang and Puga, 1998; Trombino et al., 2000; Roblin et al., 2004; Currier et al., 2005; Yang et al., 2005, 2008; Chang et al., 2007; Barhoover et al., 2010; Korzeniewski et al., 2010; DiNatale et al., 2011), and that it may play a role in tumor invasion and/or migration (Diry et al., 2006; Schlezinger et al., 2006; Gramatzki et al., 2009; Dietrich and Kaina, 2010; Brooks and Eltom, 2011; Goode et al., 2013). In triple-negative breast cancer (TNBC) cell lines, this high baseline AHR activity enforces expression of a prototypic AHR target gene, CYP1B1 (Yang et al., 2008). Indeed, a significant positive correlation can be seen between AHR and CYP1B1 levels in 58 mammary epithelial cancer cell lines annotated in the Cancer Cell Line Encyclopedia dataset (FDR = 3.8 × 10⁻⁷) and in 977 mammary tumors represented in the TCGA dataset (FDR < 3 × 10⁻¹⁶) (Fig. 1), suggesting that the AHR is constitutively active in human breast cancers in general, presumably because of the presence of endogenous ligands, and that CYP1B1 expression is a useful surrogate marker for AHR expression and/or activity.

Positive correlation between AHR and CYP1B1 mRNA expression in breast cancer cell lines and primary breast cancers. Presented are linear regression analyses of AHR and CYP1B1 expression using data from the following: (A) 58 breast cancer cell lines in the Cancer Cell Line Encyclopedia database and (B) 977 primary breast cancers in the TCGA. Pearson moment correlation coefficients (r) and FDR are reported for each correlation. Gray-filled circles represent ER-negative cell lines (A) and primary cancers (B).
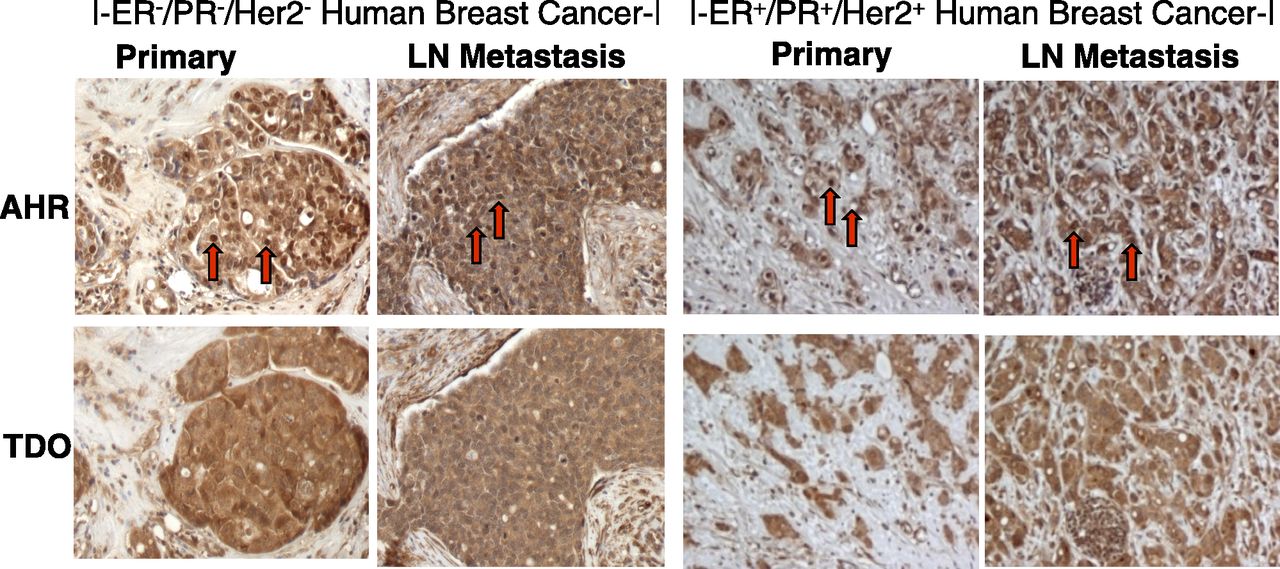
Similarly, immunohistochemical analysis of 50 human breast cancers and patient-matched lymph node metastases demonstrated strong AHR staining within malignant cells in both the primary tumor and the lymph node metastases (Fig. 2). The AHR stain was consistently localized to cell nuclei (red arrows, Fig. 2) in both ER−/PR−/Her2− tumors (e.g., left panels) and ER+ tumors (e.g., right panels), a result consistent with constitutive AHR activity in breast cancers. TDO staining also was strong in these 50 primary tumor and metastases samples, with AHR and TDO staining tending to colocalize within the tumor (compare top with bottom panels).

Immunohistochemistry of primary breast tumors and patient-matched lymph node metastasis demonstrating AHR and TDO expression. Tissue microarrays of ER+ and ER−/PR−/Her2− invasive ductal carcinomas from 50 cases were analyzed by immunohistochemistry for AHR and TDO expression. Representative photos of TNBC (left panels) and ER+ (right panels) primary tissue and matched lymph node (LN) metastasis are shown. Red arrows indicate nuclear AHR localization.
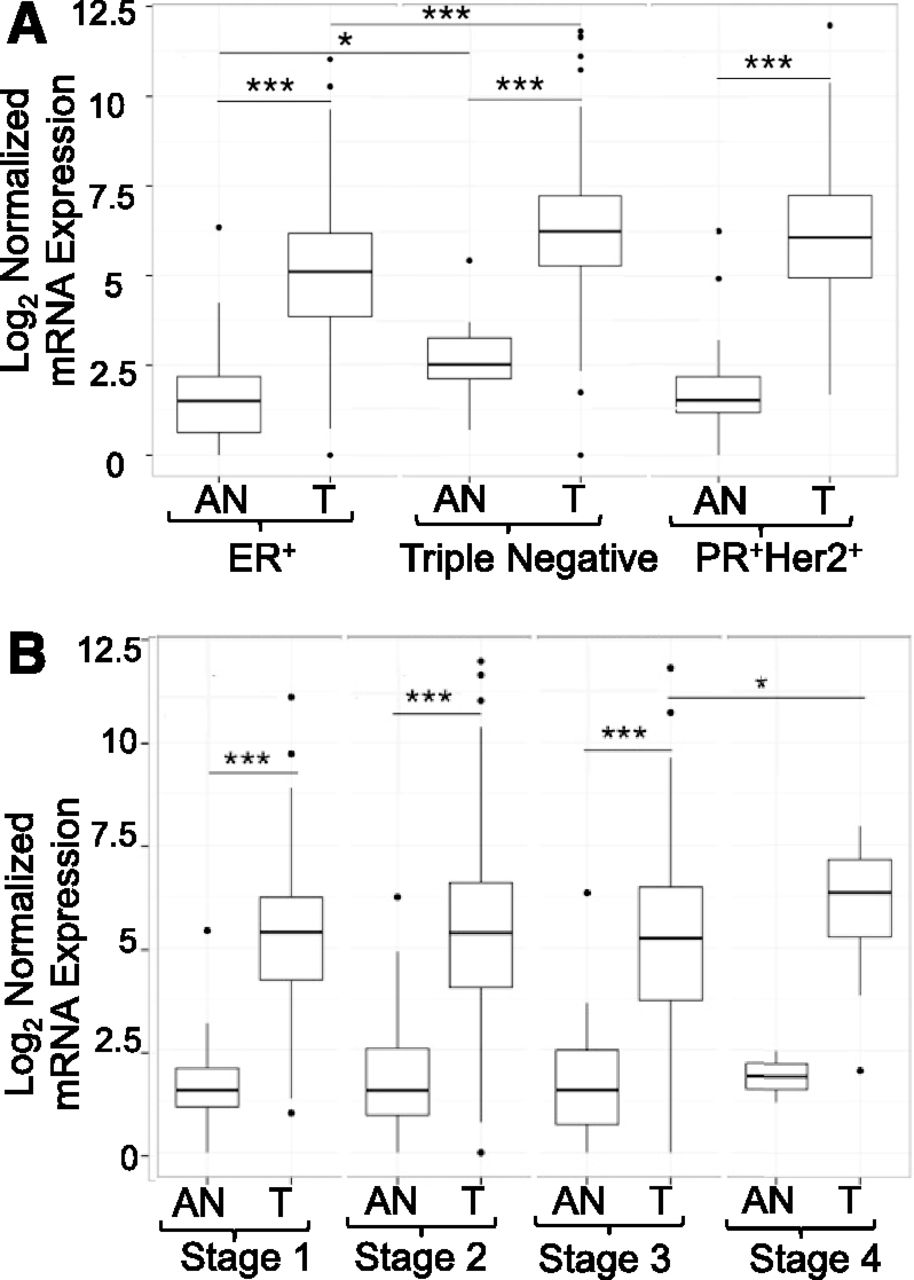
Analysis of the TCGA database revealed that primary breast cancers express dramatically elevated levels of TDO2 mRNA as compared with histologically normal adjacent normal (AN) tissue, regardless of estrogen, progesterone, or Her2 receptor status (Fig. 3A, P < 0.001). TNBC tumors express significantly higher TDO2 than ER+ tumors (Fig. 3A, P < 0.001). Interestingly, normal tissue adjacent to TNBC tumors expresses modestly higher TDO2 levels than the corresponding adjacent normal tissue from ER+ tumors (Fig. 3A, P < 0.05), suggesting a subtle but possibly important field effect in which TDO2 is higher in tissue surrounding more aggressive breast cancers. When samples were segregated according to tumor staging, it can be seen that tumors at stages 1–3 express significantly higher TDO2 than adjacent normal tissue (Fig. 3B). TDO2 expression in stage 4 tumors is also higher than adjacent normal tissue, although sample size of adjacent normal tissue (two samples) precluded statistical analysis (Fig. 3B). Furthermore, stage 4 breast cancers express significantly higher TDO2 mRNA than stage 3 tumors (P < 0.05), again suggesting that the highest TDO2 levels characterize the most aggressive cancers.

TDO2 expression is elevated in primary breast tumors. TDO2 expression data for primary breast tumors (T) and paired histologically normal AN tissue were acquired from TCGA and plotted with respect to the following: (A) estrogen (ER), progesterone (PR), and Her2 receptor status, and (B) tumor stage (note: the AN, stage 4 group contains only two samples, precluding statistical analyses). Each box plot indicates the sample median and surrounding first and third quartiles. Gene expression processing and statistical analysis are described in Materials and Methods. Whiskers indicate interquartile range. Asterisks indicate significant differences, *P < 0.05, ***P < 0.001.
TDO Expression and Influence on AHR Activity.
Despite what appears to be a generalizable elevation of AHR expression and activity in breast cancers, and the potential for the AHR to play a significant role in mediating breast cancer invasion and/or migration, at least in ER− cells (Brooks and Eltom, 2011; Goode et al., 2013, 2014; Chen et al., 2014; Li et al., 2014; Parks et al., 2014), the exact nature of and mechanisms responsible for production of endogenous AHR ligands that drive AHR activity in breast cancer have not been established. Recent studies implicate tryptophan metabolites produced via the kynurenine metabolic pathway in tumor progression (Opitz et al., 2011) and in AHR activation (DiNatale et al., 2010; Mezrich et al., 2010; Nguyen et al., 2010). Therefore, we hypothesized that proximal, rate-limiting enzymes in the kynurenine pathway, TDO and/or IDO1/2, regulate AHR signaling and TNBC functionality by facilitating endogenous AHR ligand production.
To determine which, if any, of these enzymes is expressed in human mammary epithelial cell lines, TDO2, IDO1, and IDO2 mRNA levels were quantified by RT-qPCR in a nonmalignant mammary epithelial cell line (MCF10F), four TNBC cell lines (BP1, Hs578T, MDA-MB-231, and MDA-MB-231-BO), and an inflammatory breast cancer cell line (SUM149). Only one line, MDA-MB-231, produced detectable levels of IDO1 mRNA (after 30 cycles), and no lines expressed detectable IDO2 mRNA (data not shown). Little to no TDO2 was detected in MCF10F and SUM149 cells (Fig. 4A). BP1, MDA-MB-231, and MDA-MB-231-BO cells consistently expressed low TDO2 levels detected at 30–32 cycles. In contrast, Hs578T cells expressed 46-fold more TDO2 than MCF10F cells. TDO protein levels roughly correlated with TDO2 mRNA expression in these cell lines, with Hs578T cells exhibiting approximately 57-fold more TDO protein than MCF10F cells (Fig. 4, B and C). Therefore, Hs578T cells, which more closely reflected elevated AHR and TDO expression in primary tumors (Figs. 2 and 3), were selected for the next series of experiments.

TDO mRNA and protein expression in breast cancer cell lines. (A) Cell lines were grown to 70% confluency and analyzed by RT-qPCR for TDO2 mRNA expression. Gene expression levels were normalized to 18S RNA levels, and the fold difference relative to the nonmalignant mammary epithelial cell line MCF10F was calculated using ΔΔCt values and the Pfaffl method. A low but consistent signal was detected in MCF10F cells at an average of 31 cycles. Data are presented as means + S.E. from three experiments. Simple one-way analysis of variance was used to determine significance. Asterisks indicate a significant difference relative to TDO2 expression in MCF10F cells, ****P < 0.0001. (B) A representative Western immunoblot (four experiments total) of TDO and, as a control, β-actin protein expression in mammary epithelial cell lines. Supplemental Fig. 6 shows the entire Western blot in more detail (see Additional File 6). (C) Band densities were determined from TDO Western immunoblots and normalized to β-actin band densities. Data are presented as means + S.E. from four experiments. Simple one-way analysis of variance was used to determine significance. Asterisks indicate a significant increase in β-actin–normalized TDO expression relative to expression in MCF10F cells, ****P < 0.0001.
To determine whether TDO influences AHR activity, presumably through production of endogenous ligands, TDO2 was downregulated by stable transduction of Hs578T cells with TDO2-specific shRNA (shTDO2) or by transient transfection with TDO2-specific siRNA. TDO2 levels were quantified by RT-qPCR to confirm knockdown, CYP1B1 levels were quantified as a surrogate marker for endogenous gene-specific AHR activity (Yang et al., 2008), and pGudLuc reporter activity was assayed as a more general measure of AHR activity. Stable expression of shTDO2 significantly reduced TDO2 levels by 83% (P < 0.05), endogenous CYP1B1 levels by 31% (P < 0.01), and pGudLuc activity by 37% (P < 0.05) (Fig. 5, A–C). Similarly, transient transfection with TDO2-specific siRNA significantly reduced TDO2 levels by 49% (P < 0.001), CYP1B1 expression by 24% (P < 0.05), and pGudLuc activity by 17% (P < 0.05) (Fig. 5, D–F). These data indicate that TDO is at least partially responsible for baseline (constitutive) AHR activity in Hs578T tumor cells.

TDO2 knockdown reduces AHR activity in Hs578T cells. Hs578T cells were stably transduced with scrambled control shRNA or TDO2-specific shRNA (A–C) or transiently transfected with scrambled or TDO2-specific siRNA (D–F). Cells were assayed by RT-qPCR for TDO2 (A, D) or CYP1B1 (B, E). Gene expression levels were normalized to 18S RNA, and fold differences were calculated relative to nontransfected cells using the Pfaffl method. Each result is represented as a fold difference relative to mean of control groups. In (C) and (F), cells also were transfected with the AHR-driven pGudLuc reporter plasmid and, for normalization for transfection efficiency, with CMV-green plasmid and assayed 24 hours later for luciferase activity and green fluorescence. Data are presented as the means + S.E. from 4–10 experiments. A Student t test was used to determine significance. Asterisks indicate significant decreases in normalized gene expression or pGudLuc activity, *P < 0.05, ***P < 0.001.
Hs578T Cells Produce Physiologically Relevant Levels of Kynurenine and XA, Two Endogenous AHR Ligands.
The contribution of TDO to AHR activity led us to hypothesize that tryptophan metabolites of the kynurenine pathway are produced in Hs578T cells and drive constitutive AHR activity. It has been reported that at least three kynurenine pathway metabolites, KYN, XA, and KA, are either AHR ligands or precursors to AHR ligands in human glial cells and hepatocytes (DiNatale et al., 2010; Opitz et al., 2011). To determine whether and at what concentrations these three tryptophan metabolites activate the AHR in human mammary epithelial cells, MCF10F cells, which exhibit relatively low baseline AHR-dependent pGucLuc activity (data not shown) and express little to no TDO2 or IDO1/2 (Fig. 4 and data not shown), were treated with titered doses (0.1–400 μM) of KYN, XA, or KA, and pGudLuc reporter activity was assayed 24 hours later. As expected, KYN, XA, and KA induced AHR activity in a dose-dependent manner with EC50s of 7.02 μM, 127 μM, and 180 μM, and maximal fold induction of 2.6, 3.7, and 1.8, respectively (Fig. 6). Induction of pGudLuc activity was significantly inhibited by an AHR-specific antagonist, CH223191 (Fig. 6). Importantly, KYN tended to induce AHR activity at 1–5 μM and produced a maximal increase in pGudLuc reporter activity at 50 μM (P < 0.01), a concentration within the range of the previously reported KYN concentrations in human tumors and sera of cancer patients (Lyon et al., 2011; Opitz et al., 2011). Furthermore, XA induced significant AHR reporter activity at a dose as low as 1 μM (P < 0.05). These results support the hypothesis that TDO-derived tryptophan metabolites KYN, XA, and possibly KA can induce AHR activity in mammary epithelial cells, with KYN and XA demonstrating the highest potency and efficacy.

Kynurenine, xanthurenic acid, and kynurenic acid induce AHR activity in MCF10F cells. MCF10F cells were transfected with pGudLuc and CMV-green control reporter plasmids and left untreated or treated with vehicle or 0.1–400 μM kynurenine, XA, or KA with or without 10 μM AHR-specific antagonist, CH223191. The CMV-green–normalized relative light unit value in each experimental group was normalized to CMV-green–normalized relative light unit values from untreated cells. Data from three to five experiments are presented as means + S.E. Asterisks indicate significant increases in AHR activity compared with vehicle-treated groups, *P < 0.05, **P < 0.01, ***P < 0.001. Simple one-way analysis of variance was used to determine significance. Superscript crosses (+) indicate significant decreases in AHR activity following AHR antagonist treatment, as determined by t test, +P < 0.05, ++P < 0.01, +++P < 0.0001.
LC/MS was used to determine whether KYN, XA, and KA are present in Hs578T cells at concentrations sufficient to activate the AHR. All three metabolites were detected in Hs578T cell lysates (Fig. 7A). Intracellular metabolite concentrations were determined to be 90.3 μM for KYN, 4.5 μM for XA, and 0.52 μM for KA (Fig. 7B). Both the KYN and XA concentrations are sufficient to induce a significant ∼1.5- to 2.5-fold increase in AHR reporter activity in mammary epithelial cell lines (Fig. 6). To our knowledge, this is the first demonstration of the production of physiologically relevant intracellular concentrations of KYN and XA by breast cancer cells. Furthermore, the intracellular KYN levels reported in this work in breast cancer cells are approximately 90 times greater than the secreted KYN levels previously reported (D'Amato et al., 2015).
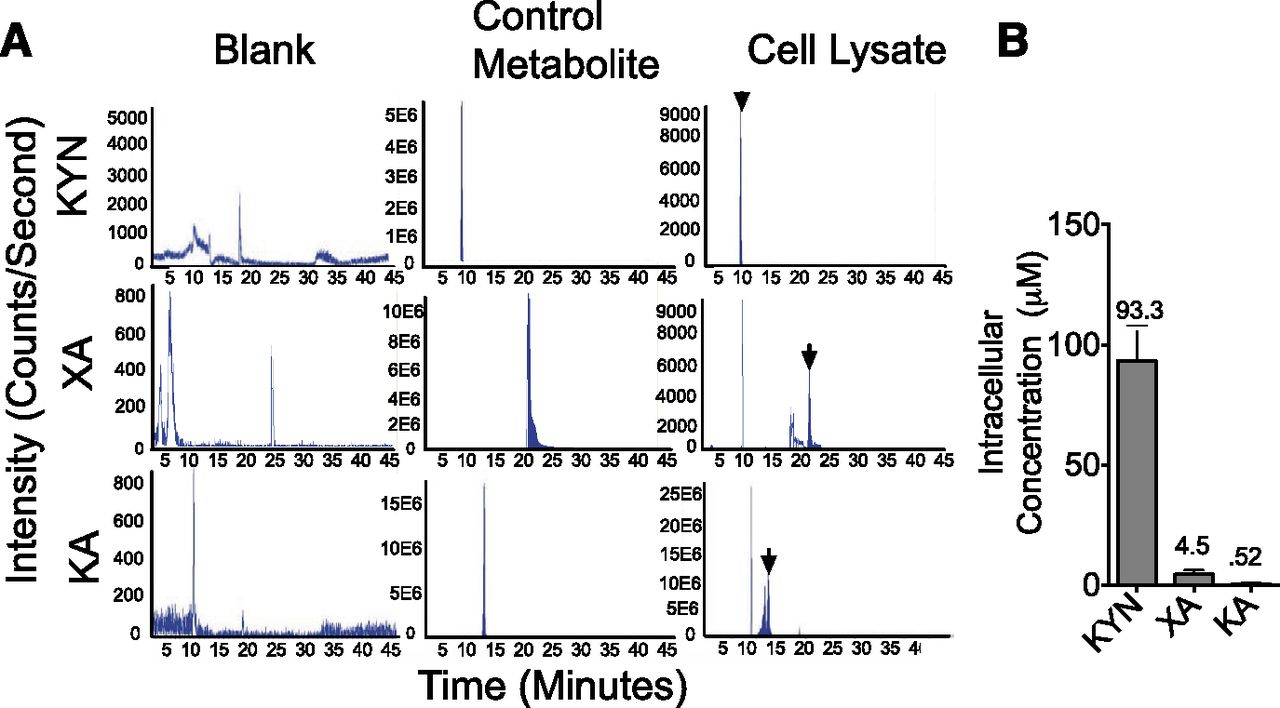
Tryptophan metabolites in the kynurenine pathway are detected in Hs578T cell lysates. (A) Representative chromatograms showing KYN, XA, and KA peaks detected by LC/MS in blanks, positive metabolite controls, and Hs578T lysates. Positive controls (solutions of commercially obtained metabolites) were used to identify peaks in test samples (indicated by arrows). The area under each peak is linearly dependent on metabolite concentration. Titered concentrations of each metabolite were used to create standard curves for calculating sample metabolite concentrations. (B) Intracellular metabolite concentrations (μM) were determined from sample metabolite concentrations obtained as described in (A), the number of cells used to produce cell lysates, and the approximate mammalian epithelial cell volume of 20003 μm.
Because KYN and its metabolites are likely to accumulate in the media, as they do in the tumor microenvironment (Opitz et al., 2011; Chen et al., 2014), a rapid colorimetric method for measuring KYN in supernatants (Hara et al., 2008; Lee et al., 2014) was used to quantify the accumulation of KYN in culture supernatants over 92 hours. Indeed, a gradual increase in KYN concentration in Hs578T cell supernatant was observed over a 92-hour period with the concentration peaking at approximately 3 times the initial concentration by 92 hours (Fig. 8A, left panel). LC/MS analysis indicated levels of KYN in supernatant at 92 hours (150 μM) (Fig. 8A) sufficient to activate the AHR (Fig. 6). As would be expected from the relative levels of TDO and IDO in SUM149 cells (Fig. 4, no detectable TDO or IDO protein or mRNA), no KYN accumulation was detected in supernatants of SUM149 cells (Fig. 8A, middle panel). A modest twofold increase in KYN accumulation was seen with MDA-MB-231 cells (Fig. 8A, right panel), a cell line that expresses low TDO and IDO (Fig. 4 and data not shown).
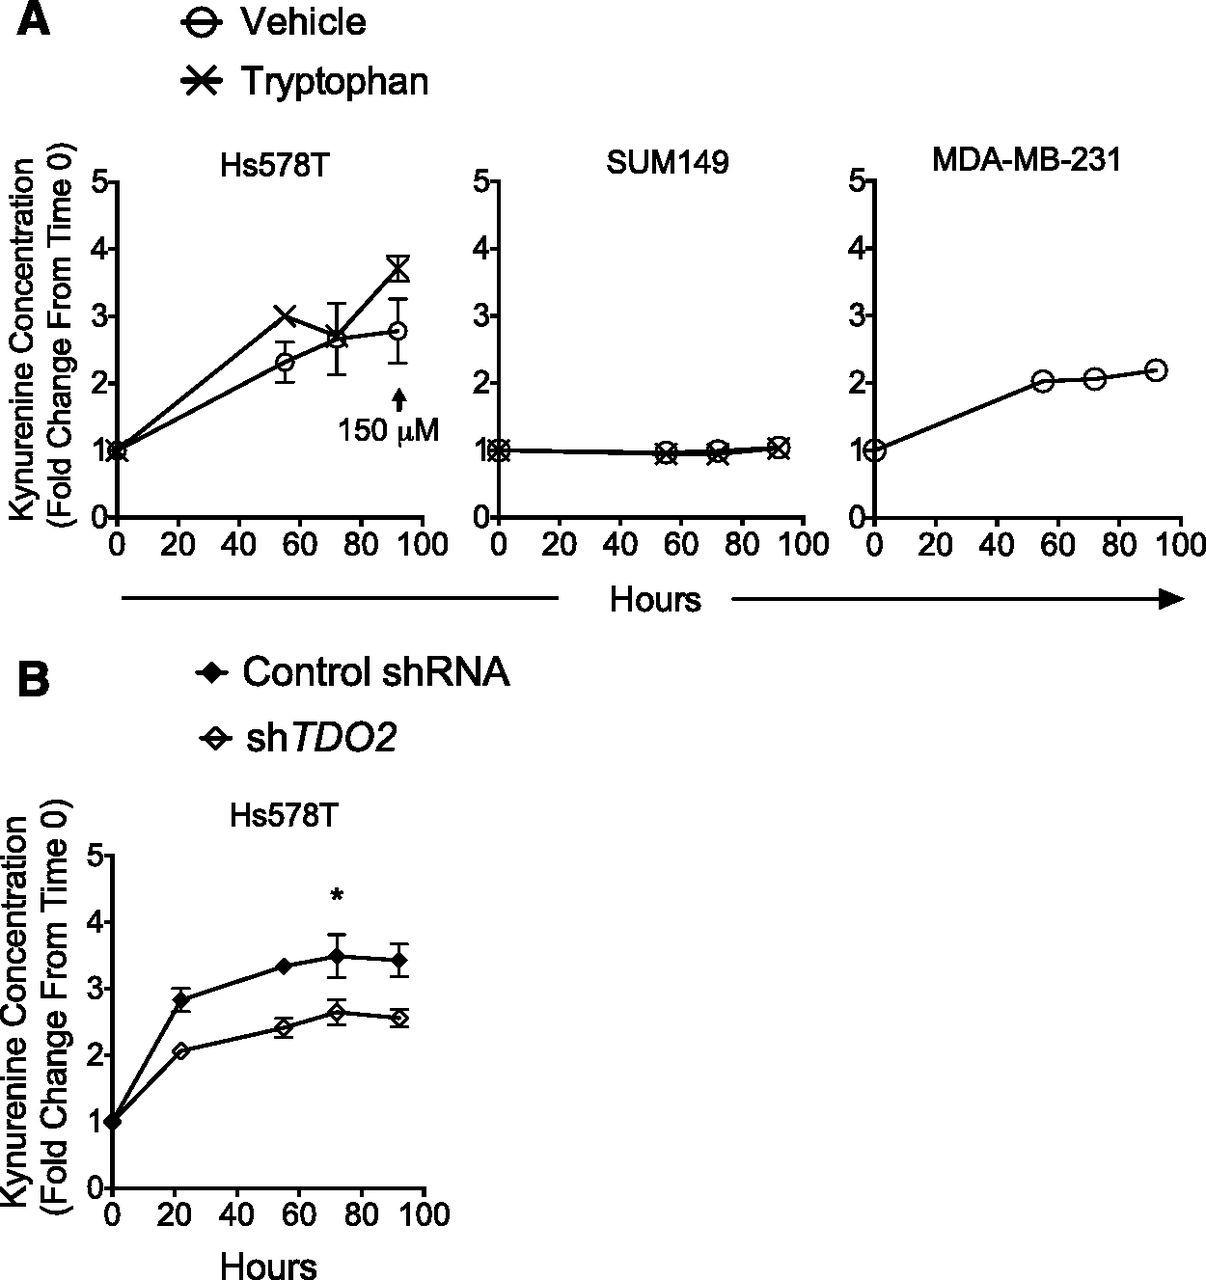
TDO-dependent accumulation of kynurenine in Hs578T cell supernatant. (A) Hs578T, SUM149, and MDA-MB-231 cells were grown in six-well plates and fed with 1 ml/well medium supplemented with vehicle (Hs578T, SUM149, and MDA-MB-231 cells, “O”) or enough tryptophan to equal tryptophan concentration in MDA-MB-231 media base (Hs578T and SUM149 cells, “X”). Supernatants were then collected from separate wells at each time point (0, 55, 72, and 92 hours). Collected supernatants were treated with 30% (v/v) trichloroacetic acid and 4-p-dimethylaminobenzaldehyde in glacial acetic acid and assayed for kynurenine accumulation using the colorimetric method described in Materials and Methods. Data shown are means ± S.E. from three to nine independent experiments. LC/MS was used to quantify the kynurenine concentration in supernatant at 92 hours (arrow/150 μM). (B) Hs578T cells were stably transduced with scrambled control shRNA or TDO2-specific shRNA, and TDO2 knockdown was confirmed, as described in Fig. 5A. Supernatants were collected at each time point (0, 24, 55, 76, and 92 hours) and assayed for kynurenine concentration, as described in (A). Data are presented as means ± S.E. from three independent experiments. A Student t test was used to determine significance. Asterisks indicate a significant reduction in kynurenine relative to levels in cells transfected with control shRNA. *P < 0.05.
Because Hs578T, SUM149, and MDA-MB-231 cells are grown in different media with different levels of tryptophan (9, 4, and 16 mg/L, respectively), Hs578T and SUM149 cultures were spiked with tryptophan to bring the final concentration up to 16 mg/ml and KYN accumulation over 96 hours assayed. (The amount of tryptophan provided by 10% FBS, ∼0.6 mg/L, is small compared with the amounts provided by the enriched media.) As expected, KYN accumulation in cultures of Hs578T cells, which express high TDO levels, increased over time (Fig. 8A, left panel) whereas no KYN accumulation was observed in cultures of SUM149 cells (Fig. 8A, middle panel), which do not express detectable TDO or IDO. Therefore, it is concluded that KYN production is a function of both the levels of TDO/IDO and tryptophan concentration. From this conclusion, it would be predicted that TDO downregulation would reduce KYN production. Indeed, downregulation of TDO2 by stable transduction with TDO2-specific shRNA (Fig. 5A) significantly (P < 0.01) inhibited KYN accumulation in supernatants (Fig. 8B). Collectively, these results demonstrate the ability of breast cancer cells to accumulate physiologically relevant intra- and extracellular concentrations of AHR ligands in a TDO-dependent process.
The Role of TDO, AHR, and TDO-Dependent Endogenous AHR Ligands in Tumor Cell Migration.
It has been suggested that the AHR plays a role in cell migration and metastasis (Brooks and Eltom, 2011; Goode et al., 2013, 2014). Therefore, it would be predicted that TDO overexpression would increase baseline levels of KYN, increase AHR activity, and accelerate cancer cell migration. Inflammatory breast cancer–derived SUM149 cells, which do not express detectable levels of TDO2 or IDO1/2 and do not produce detectable levels of KYN (Figs. 4 and 8), were used to test this prediction. Indeed, ectopic TDO2 expression in SUM149 cells significantly increased the accumulation of KYN in culture supernatants (Fig. 9A), increased pGudLuc activity (Fig. 9B), and accelerated migration (Fig. 9, C and D). In all cases, migration was slowed by addition of AHR inhibitor CH223191 (Fig. 9D). AHR inhibition had no effect on cell proliferation as assayed by a MTT assay or on cell viability/apoptosis as assayed by propidium iodide incorporation under isotonic (cell death) and hypotonic (apoptosis) conditions (Stanford et al., 2016b) (data not shown). In the case of CH223191 treatment of TDO2-transfected cells, the failure to slow migration to the levels seen in wild-type cells treated with CH223191 may reflect either that CH223191, under these conditions, does not inhibit 100% of the AHR-dependent activity or that at least some of the TDO effect is AHR independent. Collectively, these data demonstrate at least partial regulation of tumor cell migration by both AHR and TDO.

TDO overexpression increases kynurenine production, enhances baseline AHR activity, and accelerates migration of SUM149 cells. SUM149 cells were stably transduced with control plasmid or TDO2 plasmid. TDO overexpression was confirmed via qPCR and Western blot analysis (data not shown). (A) Control plasmid and TDO2-transduced SUM149 cells were plated in six-well plates, allowed to adhere overnight, and fed with 1 ml/well fresh medium at time 0. Supernatants were collected at time 0 and at 48 hours and assayed for kynurenine production, as described in Fig. 8A. Data are presented as time 0–normalized absorbance means + S.E. from four independent experiments. A Student t test was used to determine significance. An asterisk indicates a significant increase in kynurenine, P < 0.05. (B) Control plasmid and TDO2-transduced SUM149 cells were transfected with the AHR-driven pGudLuc reporter plasmid and, for normalization for transfection efficiency, with CMV-green plasmid and assayed 48 hours later for luciferase activity and green fluorescence. Data are presented as means + S.E. from four independent experiments. A Student t test was used to determine significance. An asterisk indicates a significant increase in AHR activity, P < 0.05. (C) Confluent layers of control plasmid or TDO2-transduced SUM149 cells were scratched and left untreated or treated with vehicle or the AHR antagonist CH223191. Representative photos taken at 48 hours from one of seven experiments are presented. Black lines indicate borders of the original scratch wound. (D) For the seven experiments described in (C), the percent exposed area at 48 hours, relative to the percent exposed area at time 0, was quantified using TScratch imaging software. Data are presented as means + S.E. A Student t test was used to determine significance. Asterisks indicate significant differences in the time 0–normalized percent exposed area from the respective control plasmid-transfected groups (no brackets) or between the groups indicated by the brackets, *P < 0.05, **P < 0.01.
To directly determine whether the more abundant kynurenine pathway metabolites, KYN or XA, accelerate tumor cell migration, SUM149 cells were grown to confluence, monolayers scratched, and cultures treated with titered doses of KYN, XA, or metabolite plus AHR inhibitor. Wound closure was then quantified 36 hours later. Treatment with 100 μM XA or KYN alone significantly accelerated cell migration (Fig. 10, A and B, histograms on left; P < 0.001 and P < 0.01, respectively). Addition of 10 μM CH223191 to XA- or KYN-treated cultures significantly decreased cell migration (P < 0.0001) (Fig. 10B), demonstrating AHR dependence. Note that the individual KYN and XA concentrations used are either less than (KYN) or approach (XA) the concentrations of each metabolite present in the tumor cells (Fig. 7). XA (10 μM) failed to increase cell migration, whereas 50 μM KYN increased migration by 51%, but did not reach statistical significance (Fig. 10B). Interestingly, a combination of 10 μM XA and 50 μM KYN significantly accelerated cell migration by 87% (Fig. 10B, histograms on right; P < 0.001). This accelerated migration was dramatically inhibited by CH223191. These data suggest that the presence of two (or more) AHR ligands, as is likely within the tumor environment, induces a more profound, AHR-dependent biologic effect than either metabolite alone.

Kynurenine and XA accelerate migration of SUM149 cells. Confluent layers of SUM149 cells were scratched and treated with vehicle or the indicated doses of KYN or XA or a combination of KYN and XA with or without CH223191. (A) Representative photos from one of 5–17 experiments are presented. Black lines indicate borders of the original scratch wound. (B) For the 5–17 experiments described in (A), the percent exposed area at 36 hours, relative to the exposed area at time 0, was quantified using TScratch imaging software. Data are presented as means + S.E. Data are presented as means + S.E. from three experiments. Simple one-way analysis of variance was used to determine significance. Asterisks indicate a significant decrease in exposed area (i.e., increased migration) compared with vehicle-treated cells or between groups indicated by brackets, **P < 0.01, ***P < 0.001. Superscript crosses (+) indicate a significant increase in exposed area (slowing of migration) after addition of metabolite(s) with 10 μM CH223191, ++++P < 0.0001.
Collectively, these results demonstrate that both the AHR and TDO influence cell migration rates and support the hypothesis that TDO contributes to cell migration by producing endogenous AHR ligands derived from the kynurenine pathway.
Environmental AHR Ligands Accelerate Tumor Migration.
The ability of endogenous AHR ligands to accelerate cell migration suggests the possibility that environmental AHR ligands, some of which have been associated with breast cancer incidence (Revich et al., 2001; Warner et al., 2002, 2011; Brody et al., 2007; Manuwald et al., 2012), similarly affect tumor cell migration. To test this prediction, SUM149 cells were grown to confluence, cell monolayers scratched, and cultures treated with the following: 1) 0.5 μM FICZ, a tryptophan photo-metabolite and high-affinity AHR ligand; 2) 1 μM B[a]P, a prototypic a prototypic polycyclic aromatic hydrocarbon and carcinogenic environmental AHR ligand (Russo et al., 1993), exposure to which correlates with breast cancer incidence (Li et al., 1999); or 3) 1 nM TCDD, a persistent, high-affinity environmental AHR ligand, exposure to which is associated with an increased incidence of breast cancer (McGregor et al., 1998). Notably, FICZ tended to increase cell migration by approximately 50%. B[a]P and TCDD significantly accelerated wound closure (86%, P < 0.001 and 67%, P < 0.01, respectively) (Fig. 11). These results demonstrate that different classes of environmental AHR ligands have the capacity to mimic endogenous AHR ligands in their ability to increase cell migration.
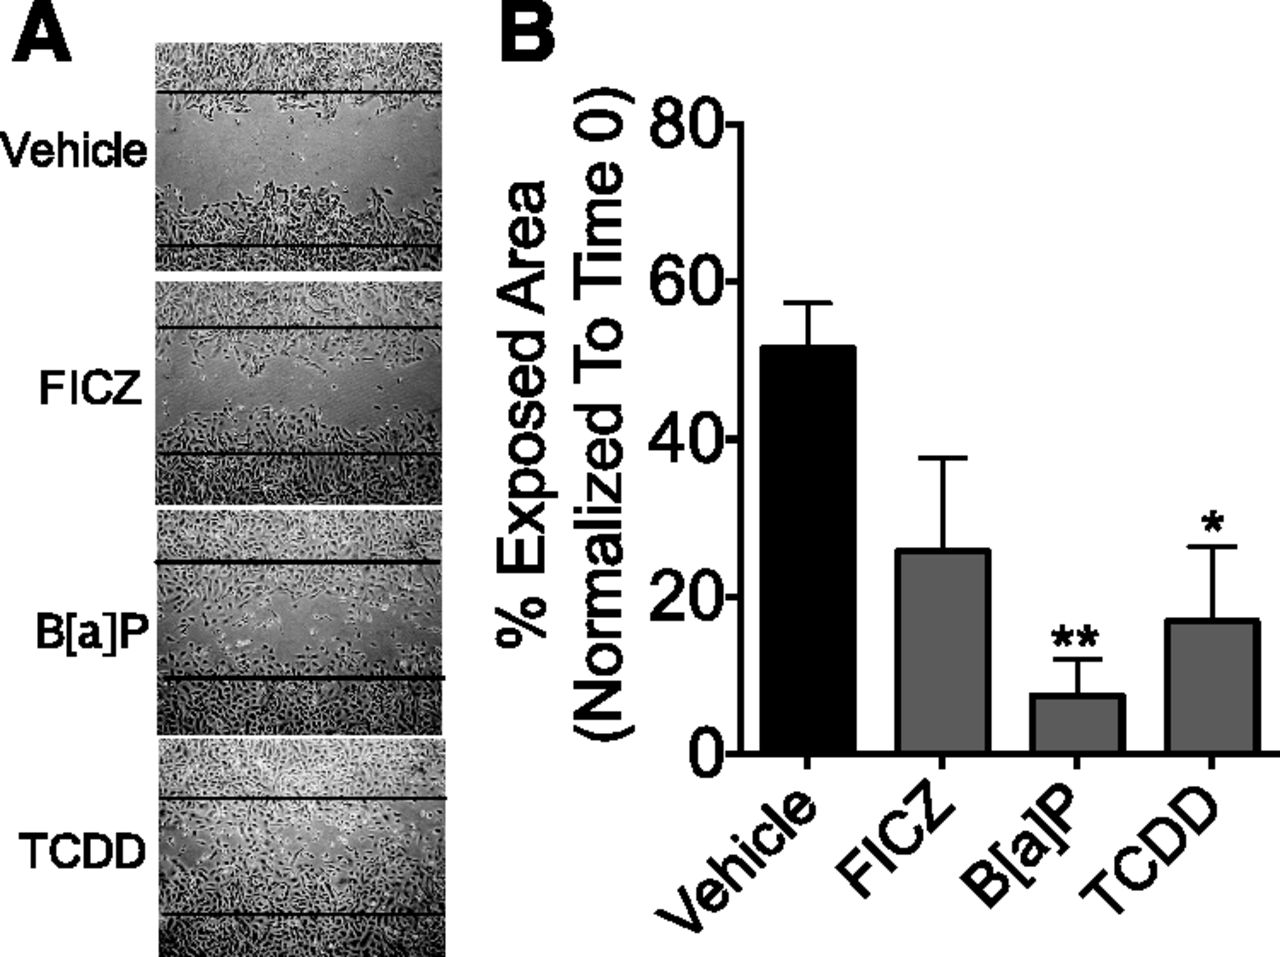
Environmental AHR ligands accelerate migration of SUM149 cells. (A) Confluent layers of SUM149 cells were scratched and treated with vehicle, 0.5 μM FICZ, 1 μM B[a]P, or 1 nM TCDD, as described in Materials and Methods, and photographed at time 0 and at 36 hours. Black lines indicate the borders of the original scratch wound. Presented are representative images from one of four (FICZ) or five (B[a]P, TCDD) independent experiments. (B) For the experiments described in (A), the percent exposed area at 36 hours was quantified using TScratch imaging software. Data are presented as the mean exposed area, normalized to time 0 + S.E. Simple one-way analysis of variance was used to determine significance. Asterisks indicate a significant decrease in exposed area (i.e., increased migration) compared with vehicle-treated cells, *P < 0.05, **P < 0.01.
The AHR Regulates TDO Levels.
The AHR can control IDO1 expression in nonmalignant, murine dendritic cells (Vogel et al., 2008; Nguyen et al., 2010). However, AHR regulation of either IDO or TDO in breast cancer cells has never been shown. To determine whether the AHR regulates TDO2 in human malignant mammary cells, AHR expression or activity was downregulated in triple-negative Hs578T cells, which express relatively high TDO levels (Fig. 4), and in triple-negative BP1 cells, which express low but detectable TDO levels, with a DOX-inducible AHR-specific shRNA and/or with CH223191. AHR knockdown and/or AHR inhibition significantly reduced TDO2 expression in both Hs578T and BP1 cells (P < 0.05) (Fig. 12). Similar results were obtained in two independent experiments performed with HER2+ HCC202 cells (Supplemental Fig. 1). These results demonstrate, for the first time, that AHR activity plays a significant role in maintaining TDO2 expression in breast cancer cells in what appears to be an amplification loop that mediates a relatively high level of tumor cell migration.

AHR regulates TDO2 expression in TNBC. (A) Hs578T cells stably transduced with DOX-inducible AHR-specific shRNA were cultured with or without 1.5 μg/ml DOX for 5 days, and TDO2 levels were quantified by RT-qPCR. TDO2 expression was normalized to 18S RNA, and the fold difference relative to TDO2 levels in nontransfected cells was calculated using the Pfaffl method. Each result is represented as a fold difference relative to mean of control groups. Data from three experiments are presented as means + S.E. A Student t test was used to determine significance. An asterisk indicates a significant reduction in TDO2 levels, *P < 0.05. (B) Hs578T cells were treated with vehicle or 10 μM CH223191 for 5 days, and TDO2 expression was quantified by RT-qPCR, as described in (A). Data from three experiments are presented as means + S.E. A Student t test was used to determine significance. An asterisk indicates significant reduction in TDO2 levels, *P < 0.05. (C) BP1 cells were stably transduced with DOX-inducible AHR-specific shRNA and cultured and analyzed as described for Hs578T cells in (A). Data from three experiments are presented as means + S.E. A Student t test was used to determine significance. An asterisk indicates a significant reduction in TDO2 levels, *P < 0.05.
Because MDA-MB-231 cells express low but detectable IDO1 levels, we were able to test the hypothesis that IDO is regulated, at least in part, by the AHR, as it is in antigen-presenting cells. To test this hypothesis, an AHR knockout MDA-MB-231 subline was created by CRISPR-Cas9 technology. This line expressed no detectable AHR or CYP1B1 (Supplemental Fig. 2A), indicating that CYP1B1 expression is controlled to a dominant extent by baseline levels of AHR activity. Furthermore, AHR hyperactivation with FICZ induced a strong CYP1B1 signal in control lines, but not in the AHR knockout line, indicating a profound diminution or deletion of AHR expression. Importantly, IDO1 mRNA was significantly lower in the AHR knockout line than in the CRISPR-Cas9 control line (Supplemental Fig. 2B). These data are consistent with those in dendritic cells demonstrating AHR control of IDO (Nguyen et al., 2010) and, in the Hs578T, BP1, and HSC202 lines, with regard to AHR control of TDO2 (Fig. 12; Supplemental Fig. 1).
Discussion
Over much of the last 30 years, the AHR was studied as a regulator of environmental chemical toxicity and carcinogenicity. However, in the last 10 years, an appreciation has grown for the effects that it has on a number of normal physiologic processes (Schmidt et al., 1996; Fernandez-Salguero et al., 1997; Abbott et al., 1999; Benedict et al., 2000; Thackaberry et al., 2002; Bunger et al., 2003; Vasquez et al., 2003; Lahvis et al., 2005; Garrett and Gasiewicz, 2006; Xu et al., 2010). As the known number of these AHR-mediated processes grows, so too does the importance of determining which endogenous AHR ligands are produced and how their production is regulated in pathologic processes, including breast cancer, in which aberrant AHR activity has been implicated. The studies presented in this work were directed toward understanding what endogenous AHR ligands are produced by aggressive triple-negative and inflammatory breast cancers and how production of these ligands is controlled.
Previous studies strongly suggest a link between elevated AHR expression or activity and cancer progression in the absence of exogenous ligands (i.e., constitutive endogenous ligand-driven AHR activity) (Trombino et al., 2000; Andersson et al., 2002; Chang et al., 2007; Yang et al., 2008; Gramatzki et al., 2009; Opitz et al., 2011; D'Amato et al., 2015). Some of these studies were performed in vitro with cloned cell lines (Yang et al., 2008; Brooks and Eltom, 2011; Goode et al., 2013), suggesting that functionally relevant concentrations of endogenous AHR ligands can be produced by malignant cells themselves. If confirmed, then aberrant production of endogenous AHR ligands by transformed cells, or cells of the tumor microenvironment, would represent the most proximal event in a signaling pathway that mediates lethal progression to a metastatic disease.
Although several endogenous molecules either activate the AHR or give rise to AHR-inducing metabolites AHR (DiNatale et al., 2010), evidence for their contribution to specific biologic outcomes has only begun to be generated (DiNatale et al., 2010; Opitz et al., 2011). Kynurenine pathway metabolites represent promising candidates as contributors to several documented AHR-dependent biologic processes, including breast cancer progression, which has been associated with aberrant tryptophan metabolism (DeGeorge and Brown, 1970; Bell et al., 1971, 1975; Davis et al., 1973; Fahl et al., 1974; Lehrer et al., 1988; Chen et al., 2009; Girgin et al., 2009; Tang et al., 2014), accumulation of KYN in patient sera (Lyon et al., 2011), and elevated TDO and/or IDO1/2 (Uyttenhove et al., 2003; Travers et al., 2004; Sakurai et al., 2005; Opitz et al., 2011; Pilotte et al., 2012; Do et al., 2014). That said, no other studies have directly quantified intracellular levels of kynurenine, XA, and KA specifically within malignant breast cells. Importantly, KYN levels within tumor cells (93 μM) and in tumor cell supernatants (150 μM), as quantified in this work, and KYN levels in breast cancer patient sera characterized elsewhere (2.3 ± 1.1 μM) (Lyon et al., 2011) approach those shown to be capable of activating the AHR in mammary epithelial cells (Fig. 6). This is in contrast to a previous study in which only 1 μM KYN, a dose insufficient to activate the AHR (Fig. 6), was detected in breast cancer cell supernatants (D'Amato et al., 2015). Furthermore, intracellular XA levels (4.5 μM) were shown in this work to be sufficient to activate the AHR.
TDO expression in primary tumors (Figs. 2 and 3) raises suspicions about its role in breast cancer because, unlike IDO, TDO is predominantly expressed in liver and not in healthy mammary tissue (Chen and Guillemin, 2009; Opitz et al., 2011; Pilotte et al., 2012). Indeed, TDO2 expression is significantly higher in tumors than adjacent nonmalignant tissue, in triple-negative as compared with ER+ tumors, and in stage 4 as compared with stage 3 tumors (Fig. 3), suggesting that high TDO levels may represent a biomarker for aggressive breast cancers. Elevated TDO/IDO expression documented in other cancer types (Brandacher et al., 2006; Pilotte et al., 2012; Smith et al., 2012; Chevolet et al., 2014; Choe et al., 2014; Théate et al., 2015) suggests that our findings may be relevant to other cancer subtypes as well.
Among a panel of six triple-negative epithelial cell lines studied, TDO was most elevated in malignant Hs578T cells (Fig. 4), in which KYN, and its product XA, are present at concentrations (93.3 μM and 4.5 μM, respectively) capable of AHR activation (5–10 μM and 1–5 μM, respectively) (Fig. 6). [KYN contributes to cell invasion in a similar range (50 μM) in glioblastoma (Opitz et al., 2011).] As expected, TDO knockdown significantly reduced accumulation of KYN (Fig. 8B), confirming that TDO activity represents a major contributor to baseline production of these AHR ligands. These results suggest that TDO may be as or more important to breast cancer biology than IDO, although significantly more is known of IDO expression in other cell types (Mellor and Munn, 2004; Braun et al., 2005; Hwang et al., 2005; Choe et al., 2014; Staudacher et al., 2015; Yeung et al., 2015). Studies in MDA-MB-231 cells, in which low levels of IDO were detected, indicate that the AHR may similarly control IDO expression in breast cancer (Supplemental Fig. 2).
Interestingly, cells that express little or no TDO or IDO (e.g., SUM149, MCF10F) still exhibit a significant baseline level of AHR activity, which is inhibited with CH223191 (Supplemental Fig. 3) or AHR knockdown (data not shown), suggesting that nonkynurenine-derived AHR ligands are being made by the tumor cells and/or that the cultures contain AHR ligands from exogenous sources. LC/MS analysis failed to detect FICZ in any of our cultures. However, 1.92 μM and 2.7 μM indoxyl sulfate was detected in Hs578T cell lysates and culture supernatants, respectively (data not shown). Indoxyl sulfate is an AHR ligand (Schroeder et al., 2010; Shivanna et al., 2016) that, in our hands, induces AHR activity in MCF10F cells in the 1–5 μM range (data not shown). Its source, in these cultures, appears to be FBS, which contains ∼9 μM indoxyl sulfate (data not shown).
Data showing that AHR inhibitors slow cell migration (Fig. 10) (Barouki et al., 2007; DiNatale et al., 2012; Goode et al., 2013; Lahoti et al., 2014) are consistent with the hypothesis that AHR activity drives a required step in the progression to an aggressive phenotype (van Zijl et al., 2011). Because AHR activity is influenced by TDO-dependent endogenous AHR ligands, it was predicted that TDO expression would correlate with AHR activity and the rate of cell migration. This hypothesis was supported by a correlation in TDO and AHR expression in primary tissues (Fig. 2), increased AHR activity and accelerated migration after ectopic TDO expression in vitro (Fig. 9), and accelerated migration after addition of KYN and XA in vitro (Fig. 10).
We show that AHR knockdown with shRNA or suppression of AHR activity with CH223191 significantly reduces TDO2 mRNA expression in three cell lines. This result is reminiscent of the influence of the AHR on IDO expression in antigen-presenting cells (Nguyen et al., 2010) and uniquely demonstrates a positive feedback loop within breast cancer cells (Fig. 13). Interestingly, there are no consensus (5′-GCGTG-3′) or alternative binding sites (5′-GGGAGGGAGGGAGGGA-3′ and 5′-GGGTGCAT-3′, targeted by AHR/RelB or AHR/Klf6 dimers, respectively) within 3000 base pairs upstream or 200 base pairs downstream of the TDO2 start site. Therefore, the AHR may regulate TDO2 expression indirectly, potentially by recruiting the glucocorticoid receptor coactivator SRC1/NCoA1 (Endler et al., 2014) and enhancing glucocorticoid receptor-mediated TDO2 transcription (Soichot et al., 2013).

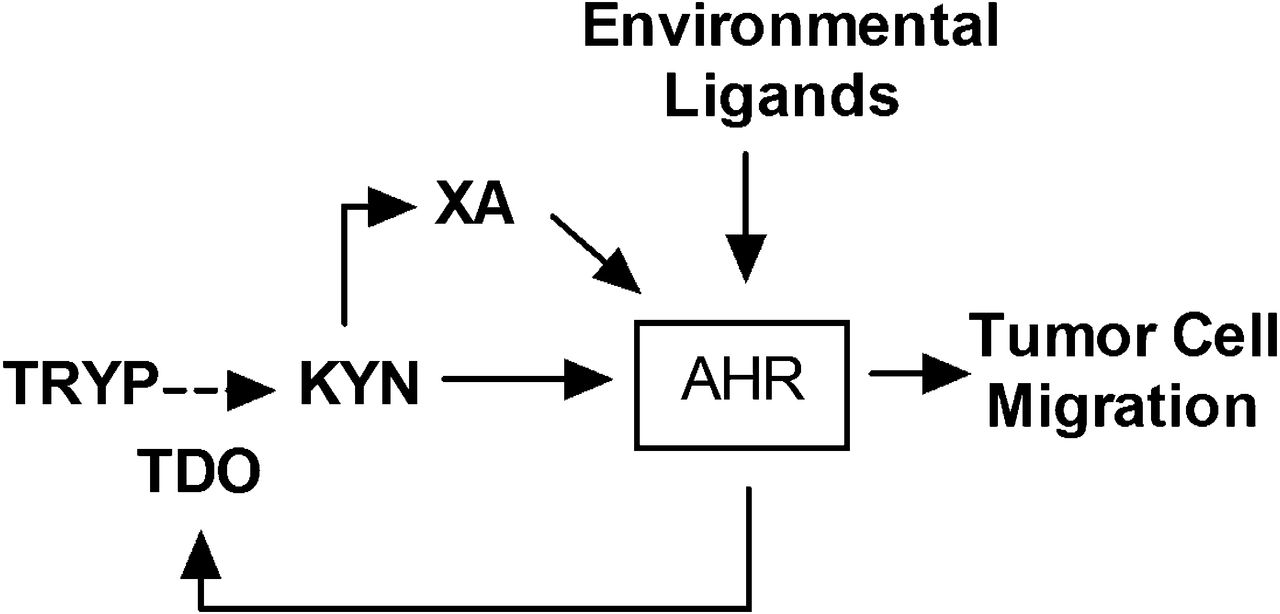
Within breast cancer cells, the AHR is activated by endogenous ligands, including the tryptophan metabolites kynurenine (KYN) and xanthurenic acid (XA). A proximal outcome of this activation is upregulation of the tryptophan 2,3-di-oxygenase TDO. TDO mediates production of kynurenine pathway metabolites from tryptophan including KYN and XA in an amplification feedback loop. Environmental AHR ligands may either initiate or exacerbate this AHR activity. The consequence of chronic AHR activation resulting from this amplification loop (i.e., “constitutive AHR activity”) is tumor cell migration, a marker for aggressive, metastatic cells.
The putative amplification loop may be sustained by AHR ligands produced within a given malignant cell, by adjacent malignant cells, and/or by nonmalignant cells of the surrounding tumor microenvironment. A modest but consistent level of TDO-specific staining in the microenvironment of primary human breast cancers and their metastases, as seen by immunohistochemistry, is consistent with a contribution of the microenvironment in the postulated amplification loop. In that vein, KYN accumulates in the tumor microenvironment (Puccetti et al., 2015), where it can act in a paracrine manner in breast (Chen et al., 2014) and other cancers (Opitz et al., 2011). As such, this autocrine/paracrine communication network may represent a novel route through which malignant cells and cells of the tumor microenvironment perpetuate tumor aggressiveness.
One important implication of results presented in this work is the suggestion that environmental AHR ligands mimic endogenous ligands and enhance tumor cell migration. Both TCDD, a poorly metabolized and persistent AHR ligand, and B[a]P, a readily metabolized ligand, accelerated migration in vitro. Therefore, relatively common environmental AHR ligands could initiate or exacerbate the self-perpetuating AHR-TDO feedback loop, maximizing cell migration.
In conclusion, our data demonstrate, for the first time, a complete amplification loop in ER−/PR−/Her2− breast cancer cells through which the AHR drives production of TDO, which generates endogenous AHR ligands, KYN and XA, leading to chronically active AHR (Fig. 13). AHR ligand concentrations within malignant cells and in the supernatant are sufficient to drive this amplification loop. At least one biologic outcome of this chronic AHR stimulation is increased cell migration, a characteristic of aggressive, metastatic cells. Regulation of the kynurenine pathway by the AHR also has implications for tumor immunity, which is suppressed by the local production of kynurenine pathway metabolites. Finally, the data strongly suggest that targeting the kynurenine pathway, as in recent cancer therapy trials (Muller et al., 2005; Platten et al., 2015), and the AHR may be effective approaches to ER−/PR−/Her2− breast cancer treatment. AHR inhibition may have the additional advantage of blocking AHR-driven tumor cell migration regardless of the nature of the endogenous AHR ligands. Because TDO overexpression has been reported for a wide range of cancers (Opitz et al., 2011; Pilotte et al., 2012), environmental and therapeutic implications of our findings may be generalizable to other malignancies.
Acknowledgments
The authors acknowledge Dr. M. Pollastri for synthesizing FICZ and CH223191, Dr. M. Denison for the gift of the pGudLuc vector, Dr. S. Ethier for the SUM149 cells, Dr. Gabri van der Pluijm (Leiden University Medical Center) for the gift ofA-MB-231-BO cells, Tufts University LC/MS Core Facility (National Science Foundation Awards 0821381 and 1337760), and Boston University RT-PCR Core Facility for assistance.
Authorship Contributions
Participated in research design: Novikov, Sherr.
Conducted experiments: Novikov, Wang, Stanford, Parks, Ramirez-Cardenas.
Contributed new reagents or analytic tools: Gusenleitner, Li, Monti, Manteiga, Lee.
Performed data analysis: Novikov, Gusenleitner, Li, Landesman, Laklouk, Sarita-Reyes, Monti, Sherr.
Wrote or contributed to the writing of the manuscript: Novikov, Wang, Stanford, Parks, Ramirez-Cardenas, Landesman, Laklouk, Sarita-Reyes, Gusenleitner, Li, Monti, Manteiga, Lee, Sherr.
Footnotes
- Received May 26, 2016.
- Accepted August 24, 2016.
This work was supported by National Institutes of Health National Institutes of Environmental Health Sciences [Grants P42-ES007381 and P42 ES007381S2]; The Art beCAUSE Breast Cancer Foundation; The Mary Kay Foundation; and The Avon Foundation for Women.
↵
 This article has supplemental material available at molpharm.aspetjournals.org.

Abbreviations
- AHR
- aryl hydrocarbon receptor
- AN
- adjacent normal
- B[a]P
- benzo[a]pyrene
- DMSO
- dimethylsulfoxide
- DOX
- doxycycline
- FBS
- fetal bovine serum
- FDR
- false discovery rate
- FICZ
- 6-formylindolo[3,2-b]carbazole
- IDO1/2
- indolamine-2,3-dioxygenase 1/indolamine-2,3-dioxygenase 2
- KA
- kynurenic acid
- KYN
- L-kynurenine
- LC/MS
- liquid chromatography/mass spectrometry
- MS
- mass spectrometry
- MTT
- 3-(4,5-dimethylthiazol-2-yl)-2.5- diphenyltetrazolium bromide)
- qPCR
- quantitative polymerase chain reaction
- RT-qPCR
- real-time quantitative polymerase chain reaction
- sh
- small hairpin
- siRNA
- small interfering RNA
- TBST
- Tris-buffered saline/Tween 20
- TCDD
- 2,3,7,8-tetrachlorodibenzo[p]dioxin
- TCGA
- The Cancer Genome Atlas
- TDO
- tryptophan-2,3-dioxygenase
- TNBC
- triple-negative breast cancer
- XA
- xanthurenic acid
- Copyright © 2016 by The Author(s)
This is an open access article distributed under the CC BY-NC Attribution 4.0 International license.


