


Abstract
Levothyroxine replacement therapy forms the cornerstone of hypothyroidism management. Variability in levothyroxine oral absorption may contribute to the well-recognized large interpatient differences in required dose. Moreover, levothyroxine-drug pharmacokinetic interactions are thought to be caused by altered oral bioavailability. Interestingly, little is known regarding the mechanisms contributing to levothyroxine absorption in the gastrointestinal tract. Here, we aimed to determine whether the intestinal drug uptake transporter organic anion transporting polypeptide 2B1 (OATP2B1) may be involved in facilitating intestinal absorption of thyroid hormones. We also explored whether thyroid hormones regulate OATP2B1 gene expression. In cultured Madin-Darby Canine Kidney II/OATP2B1 cells and in OATP2B1-transfected Caco-2 cells, thyroid hormones were found to inhibit OATP2B1-mediated uptake of estrone-3-sulfate. Competitive counter-flow experiments evaluating the influence on the cellular accumulation of estrone-3-sulfate in the steady state indicated that thyroid hormones were substrates of OATP2B1. Additional evidence that thyroid hormones were OATP2B1 substrates was provided by OATP2B1-dependent stimulation of thyroid hormone receptor activation in cell-based reporter assays. Bidirectional transport studies in intestinal Caco-2 cells showed net absorptive flux of thyroid hormones, which was attenuated by the presence of the OATP2B1 inhibitor, atorvastatin. In intestinal Caco-2 and LS180 cells, but not in liver Huh-7 or HepG2 cells, OATP2B1 expression was induced by treatment with thyroid hormones. Reporter gene assays revealed thyroid hormone receptor α–mediated transactivation of the SLCO2B1 1b and the SLCO2B1 1e promoters. We conclude that thyroid hormones are substrates and transcriptional regulators of OATP2B1. These insights provide a potential mechanistic basis for oral levothyroxine dose variability and drug interactions.
Introduction
Thyroid hormone (TH) homeostasis is essential for physiologic energy metabolism. Accordingly, alterations are linked to a variety of diseases. With a prevalence of about 4% to 5% in European and American populations, hypothyroidism (overt and subclinical) is among the most common diagnoses in endocrinology (Hollowell et al., 2002; Garmendia Madariaga et al., 2014). TH homeostasis is tightly regulated by multiple mechanisms, including those which control tissue uptake and cellular bioactivation. Thyroxine (T4) is metabolized by intracellular iodothyronine deiodinases, which produce biologically active triiodothyronine (T3) or inactive reverse triiodothyronine (rT3) (Köhrle, 2007). To signal transcription, T3 binds to intracellular TH receptors (TRs) (Mondal et al., 2016). The therapeutic management of hypothyroidism usually involves oral substitution with levothyroxine [(L-thyroxine) T4]. However, oral absorption of L-thyroxine is highly variable and known to be affected by various factors including gastric pH or food-drug interactions (Ianiro et al., 2014). Furthermore, it is known that efficient L-thyroxine absorption from the intestinal lumen occurs in restricted segments of the gastrointestinal tract, namely, the duodenum and jejunum (Ianiro et al., 2014).
Intestinal solute transfer is mainly mediated by passive diffusion and active transport by membrane proteins. Several well-known drug-drug interactions result in reduced L-thyroxine bioavailability. For example, proton pump inhibitors alter the ionization status of L-thyroxine in the gut due to increased gastric pH, while iron and calcium supplements may form nonabsorbable chelates or complexes with THs (Centanni et al., 2006). Interestingly, a population-based retrospective study observed changes in thyroid-stimulating hormone levels, a marker for TH activity, to be associated with cotreatment with statins (Irving et al., 2015). Furthermore, an acute impact of ciprofloxacin or rifampin on intestinal absorption of L-thyroxine was shown, where ciprofloxacin significantly reduced T4 area under the plasma concentration-time curve by 39%, while rifampin significantly increased T4 area under the plasma concentration-time curve by 25% (Goldberg et al., 2013). These later findings suggest that L-thyroxine-drug interactions may also result from mechanisms involving facilitated cellular entry or efflux (Riley et al., 2016).
With the discovery that MCT-8 (SLC16A2) genetic mutations cause Allan-Herndon-Dudley syndrome, a severe psychomotor retardation associated with TH dysregulation (Visser et al., 2011), it has become widely accepted that transporters are critically involved in the regulation of TH homeostasis and function (Bernal et al., 2015). Additional transporters have been reported to interact with THs, including members of the organic anion transporting polypeptides (OATPs) (van der Deure et al., 2010). Within this protein family, OATP1C1 appears to be highly active and specific for TH transport, although it is only expressed at the blood-brain barrier and in the testis (Pizzagalli et al., 2002; Sugiyama et al., 2003). In addition, the hepatic transporters OATP1B1 and OATP1B3 have been reported to mediate cellular uptake of iodothyronine sulfates (van der Deure et al., 2008), thereby contributing to hepatic TH elimination. With regard to intestinal L-thyroxine absorption, the aforementioned OATPs appear to be of minor relevance due to their expression profile. In contrast, OATP1A2 was reported to be expressed in intestine (Glaeser et al., 2007) and to recognize THs as substrates (Fujiwara et al., 2001). However, intestinal OATP1A2 expression could not be subsequently confirmed; accordingly, the transporter is mainly considered important for blood-brain transfer (Lee et al., 2005; van der Deure et al., 2010).
A leading candidate for an intestinal TH transporter is OATP2B1 (SLCO2B1). This sodium-independent uptake transporter is expressed in enterocytes and assumed to significantly influence oral drug absorption (Tamai et al., 2000; Kullak-Ublick et al., 2001; Drozdzik et al., 2014). While most studies supported localization of OATP2B1 at the apical membrane of the enterocyte, its polarized cellular localization is a matter of debate since basolateral sorting has recently been proposed (Kobayashi et al., 2003; Keiser et al., 2017). Despite OATP2B1 being known to mediate cellular uptake of various exogenous compounds including statins (Koenen et al., 2011), it is less certain whether this transporter is also involved in intestinal absorption of THs since there are conflicting data. Interestingly, both studies reporting data on this used a similar experimental model involving Xenopus laevis oocytes expressing OATP2B1 (Kullak-Ublick et al., 2001; Leuthold et al., 2009). There are several transcription start site variants of OATP2B1 (Pomari et al., 2009), which are all regulated by their own distinct promoter (Fig. 8A, 1a to 1e). Of these five variants the OATP2B1 isoform 1B (using exon 1b as the transcription start site) encodes for the original full-length protein and is the major form expressed in duodenum. All other variants that are transcriptionally controlled by different promoter regions encode for the same shortened protein lacking 22 amino acids at the N-terminus. This short variant exhibits transport of estrone-3-sulfate (E1S) and rosuvastatin comparable to the full-length OATP2B1 isoform 1B. For the OATP2B1-1E variant, liver-enriched expression and regulation by HNF4α have recently been reported (Knauer et al., 2013). In this study, we investigated the functional and regulatory interplay of TH and the uptake transporter OATP2B1. Using cells overexpressing OATP2B1, we examined the impact of THs on cellular accumulation of the known OATP2B1-substrate E1S. Cellular accumulation studies were supplemented by counter-flow experiments and an assessment of the influence of OATP2B1 on the transactivation of TH receptor beta (TRβ). Finally, we used the intestinal Caco-2 cell model to study transcellular TH transport as well as regulation of OATP2B1 expression.
Materials and Methods
Cell Culture.
All cell lines were kept at 37°C in a humidified atmosphere supplemented with 5% CO2. The cell lines Caco-2 (ATCC HTB37), HepG2 (ATCC HB-8065), HeLa (ATCC CCL-2), and Madin-Darby canine kidney II [(MDCKII) ATCC CRL-2936] were originally obtained from American Tissue Culture Collection (Molsheim Cedex, France). Huh-7 cells (clone JCRB0403) were purchased from the Japanese Collection of Research Bioresources (http://cellbank.nibiohn.go.jp). Primary human renal proximal tubular epithelial cells (RPTEC) were purchased from Ruwag Life science (Bettlach, Switzerland). LS180 cells were commercially obtained from Sigma-Aldrich (Buchs, Switzerland). The OATP2B1 overexpressing cell line MDCKII-OATP2B1 was generated and characterized as described elsewhere (Grube et al., 2006). Dulbecco’s modified Eagle’s medium, supplemented with 10% fetal calf serum (FCS), and 1% GlutaMAX (Thermo Fisher Scientific, Zug, Switzerland) were used as culture medium for the Caco-2, HeLa, HepG2, Huh-7, and MDCKII cells. In the case of MDCKII-OATP2B1 the medium was supplemented with 0.25 mg/ml Hygromycin B for continuous selection. Dulbecco’s modified Eagle’s medium supplemented with 1% GlutaMAX, 10% FCS, and 1% nonessential amino acids was the culture medium for the LS180 cells. The RPTECs were kept in optimized Clonetics REGM renal epithelial cell growth medium supplemented as recommended by the manufacturer (Lonza, Basel, Switzerland).
In Silico Scan for Potential Thyroid Hormone Receptor Binding Sites.
The previously published sequences of the SLCO2B1 1b promoter and the SLCO2B1 1e promoter (Knauer et al., 2013) were screened for potential TR binding sites using the open-access program NUBIScan version 2.0 (www.nubiscan.unibas.ch). The underlying algorithm is a joining of weighted distribution matrices of nucleotide hexamer half-sites as published by Podvinec et al. (2002). The herein used search matrix was generated based on previously described specific DNA sequence binding pattern for TRs (Ayers et al., 2014).
Immunofluorescent Staining.
Cells were seeded on cover slides at a density of 75,000 cells/well in 12-well plates. After reaching 90% confluence, cells were fixed with ice-cold methanol:aceton (1:2) for 15 minutes, permeabilized with 0.2% Tween 20/phosphate-buffered saline (PBS), and then incubated with 5%-FCS-1% bovine serum albumin/PBS before adding the anti-OATP2B1-antiserum (1:100) (Grube et al., 2006) for incubation over night at 4°C. After several washes with PBS, the secondary antibody, anti-rabbit Alexa Fluor 488 (Life Technologies distributed by Thermo Fisher Scientific, Zug, Switzerland), was added for 1 hour. Prior to mounting the cells with Roti-Mount FluorCare containing 4′,6-diamidino-2-phenylindole (DAPI) for nuclei staining, the cells were washed with PBS. Staining was detected using the Leica DMi8 Microscope (Leica Microsystems, Heerbrugg, Switzerland).
Quantitative Real-Time Polymerase Chain Reaction (PCR) Analysis.
Caco-2, LS180, Huh-7, and HepG2 cells were cultured at confluence in six-well plates and then treated with 100 nM T4 or 100 nM T3. After 48 hours of treatment, total RNA was extracted using TRIzol reagent (Thermo Fisher Scientific). The quality of the RNA was determined using Agilent Bioanalyzer 2100 (Agilent, Santa Clara, CA) and the concentration was measured by spectrophotometry (GE Nanovue Plus; GE Healthcare Life Sciences, Baie d’Urge, QC, Canada). cDNA was synthesized using the Applied Biosystems Multiscribe Reverse Transcriptase (distributed by LuBioScience, Lucern, Switzerland). Human tissue RNAs were purchased from AMS Biotechnology (Bioggio-Lugano, Switzerland) or isolated from RPTEC, Caco-2, or Huh-7 using pegGold RNA Pure (Axon Laboratory, Baden-Dättwil, Switzerland) following the manufacturer’s protocol. The Life Technologies High-Capacity cDNA Reverse Transcription Kit (distributed by LuBioScience) was used for reverse transcription. The amount of mRNA was quantified using the ViiA7 Real-Time PCR System and commercially available TaqMan gene expression assays (LuBioScience) for TR beta [(TRβ), Hs00230861], TR alpha [(TRα), Hs00268470_m1], iodothyronine deiodinase 1 [(DIO1), Hs00174944_m1], and 18S ribosomal RNA [(18S rRNA), 4319413E]. The amount of SLCO2B1 isoforms 1B and 1E was analyzed using SYBR Green PCR Master Mix (LuBioScience) and the following primers: SLCO2B1_1B_forward 5′-GGCTGGAGCTCACTGCAC-3′, SLCO2B1_1E_forward 5′-TGGGATTGAAGCTTCAGGGAG-3′, and SLCO2B1_1B/1E_reverse 5′-CACTGTGGAAATGGAGCTC-3′, as previously reported by Knauer et al. (2013). In the cells, DIO1 and ABCB1 were quantified using the primers DIO1_forward 5′-TTCAGCACCAGTGGCCTATT-3′, DIO1_reverse 5′-ACGACTGAGCTAGGGGGTCT-3′, P-glycoprotein (P-gp)_forward 5′-GTCCCAGGAGCCCATCCT-3′, and P-gp_reverse 5′-CCCGGGTGTTGTCTCCAT-3′. Data were analyzed by the ΔΔCT method, where the CT values of the gene of interest were normalized to that of 18S rRNA detected in the same sample (ΔCT). The ΔCT values of each sample were referred to the mean ΔCT value of the indicated control (ΔΔCT).
Transport Studies Using MDCKII-OATP2B1 Cells.
For inhibition studies and competitive counter-flow experiments, MDCKII or MDCKII-OATP2B1 cells were seeded at a density of 50,000 cells/well in 24-well plates. One day after seeding, cells were stimulated with 2.5 mM sodium-butyrate for 24 hours. For inhibition studies, cells were washed with prewarmed PBS prior to the 5-minute incubation with E1S diluted in incubation buffer (142 mM NaCl, 5 mM KCl, 1 mM KH2PO4, 1.5 mM CaCl2, 1.2 mM MgSO4, 5 mM glucose, and 12.5 mM HEPES). E1S was used at a concentration of 0.1 µM containing 100,000 dpm/well [3H]-E1S (Hartmann Analytic, Braunschweig, Germany), supplemented with the respective concentration of the tested inhibitor, namely, T4, T3, rT3, and thyroxine 4-O-β-D-glucuronide (T4G) (all obtained from Sigma-Aldrich). Atorvastatin [1 or 10 µM] was used as the control. After washing the cells three times with ice-cold PBS, cells were lysed in 200 µl 10% SDS-5 mM EDTA. Cellular accumulation of the radiolabeled substrate was determined after diluting the cell lysate in 2 ml of scintillation cocktail (Rotiszint eco plus; Carl Roth AG, Arlesheim, Switzerland) and measured using a liquid scintillation β-counter (Tri-carb 2900 TR; TOPLAB, Rickenbach, Switzerland). Competitive counter-flow experiments were performed as described by Harper and Wright (2013). One day after seeding, the cells were washed once with prewarmed PBS and exposed to Krebs-Henseleit buffer [(KHB); 118 mM NaCl, 25 mM NaHCO3, 1.2 mM KH2PO4; 2.5 mM CaCl2, 1.2 mM MgSO4, 11 mM glucose, 4.7 mM KCl, pH 5.5] containing [3H]-E1S (6.06 nM/well with 100,000 dpm/well) for 30 minutes to equilibrate. After reaching steady-state conditions, the supernatant was removed and replaced by KHB containing [3H]-E1S supplemented with the test compounds, namely, E1S (50 µM), atorvastatin (30 µM), camptothecin (1 mM), T4 (25 µM), T3 (10 µM), rT3 (1 mM), or T4G (400 µM). After 1-minute incubation the cells were washed with ice-cold PBS and the amount of radiolabel in the lysed cells was determined as described previously.
Transport Studies Using Transiently Transfected Caco-2 Cells.
Caco-2 cells were seeded at a density of 75,000 cells/well in 24-well plates. One day after seeding the cells were transfected with 500 ng/well pEF6-control or OATP2B1-pEF6 using 2 μl/μg DNA jetPRIME transfection reagent (Polyplus transfection; Chemie Brunschwig AG, Basel, Switzerland), and the next day transport experiments were conducted as previously described in detail.
Cell-Based Reporter Gene Assays.
To test the influence of the uptake transporter on the intracellular function of T3 and T4, MDCKII or MDCKII-OATP2B1 cells were transfected with a reporter gene construct containing the firefly luciferase gene under the control of the 5′ untranslated region of the iodothyronine deiodinase 1 gene (DIO1-pGL3basic) and pRL-TK encoding for Renilla luciferase as the transfection control. For cell-based reporter gene assays testing the transactivation of the SLCO2B1 1e and SLCO2B1 1b promoters, the respective reporter gene constructs in pGL3basic (Knauer et al., 2013) were transfected into HeLa cells. In addition to the reporter gene constructs, the cells were transfected with eukaryotic expression vectors (pEF6-V5/HIS; Invitrogen distributed by Thermo Fisher Scientific) encoding for the nuclear receptor TRβ, TRα, and/or its heterodimerization partner retinoid X receptor alpha (RXRα); in total, 25 ng pRL-TK, 250 ng of TRβ-pEF6, TRα-pEF6, and/or RXRα-pEF6 and/or pEF6 as control, and 250 ng of the pGL3basic plasmid were transfected in each well. MDCKII or MDCKII-OATP2B1 cells were seeded at a density of 40,000 cells/well in a 24-well plate, and after 24 hours the cells were transfected using 1.5 µl/µg DNA of the jetPRIME transfection reagent (Polyplus transfection). HeLa cells were seeded at a density of 50,000 cells/well in 24-well plates, and were transfected using 2.5 µl/µg DNA of the jetPRIME transfection reagent (Polyplus transfection). The next day, the cells were treated for 24 hours with 10 µM T3 or 10 µM T4. Subsequently, the cells were lysed in 100 µl passive lysis buffer, and then the firefly and Renilla luciferase activities were assessed in 20 µl of the lysate using the Dual-Luciferase Reporter Assay System (Promega, Duebendorf, Switzerland) and the infinite 200 Pro (Tecan, Maennedorf, Switzerland) according to the manufacturers’ instructions. Activity of firefly luciferase was normalized to that of Renilla.
Western Blot Analysis.
For determination of protein content, cells were lysed in 5 mM Tris-HCl (pH 7.4) supplemented with protease inhibitors (diluted 1:100; Protease Inhibitors Cocktail; Sigma-Aldrich). After three cycles of freezing in liquid nitrogen and thawing in a 37°C water bath, the cell lysate of MDCKII cells was centrifuged at 100,000g (30 minutes at 4°C) for crude membrane enrichment. The resulting pellet was suspended in 5 mM Tris-HCl supplemented with protease inhibitors. For cultured Caco-2 cells, we applied the total cell lysate to immunoblotting. After adding 5x Laemmli buffer, the samples were heated for 30 minutes to 65°C prior to separation by 10% SDS-PAGE. The separated proteins were electrotransferred to a nitrocellulose membrane using a TANK blotting system (Bio-Rad, Cressier, Switzerland). Prior to incubation with the respective antibodies, anti-OATP2B1 rabbit polyclonal (Grube et al., 2006) or goat polyclonal anti-β-actin (sc-1616; Labforce, Muttenz, Switzerland), the membranes were blocked with 5% FCS in Tris-buffered saline containing 0.1% Tween 20 for at least an hour at room temperature. After several washing steps with Tris-buffered saline containing 0.1% Tween 20 the membranes were incubated with the respective horseradish peroxidase-labeled secondary antibody (dilution to 1:2000; Bio-Rad). Immobilized secondary antibody was visualized and digitalized using Western ECL Substrate (Thermo Fisher Scientific) and the ChemiDoc MP System (Bio-Rad), respectively. Analysis was performed using the Image Laboratory software (version 4.1; Bio-Rad).
Transwell Transport of Thyroid Hormones.
Transepithelial solute flux studies were performed as previously published by Hubatsch et al. (2007). Briefly, Caco-2 cells were seeded at a density of 3 × 10⁵ cells/well onto polycarbonate membranes with 0.4 µm pore size inserted in 12-well plates (Chemie Brunschwig AG). Caco-2 cells were cultivated for at least 14 days with medium change every second day, and until reaching a transepithelial electrical resistance value of at least 200 Ω/cm. Integrity of the monolayer was tested after assessment of transport using 0.1 mg/ml lucifer yellow (Sigma-Aldrich). Transport experiments were performed using KHB. In detail, after washing the cells with PBS, Caco-2 cells were pre-equilibrated for 20 minutes at 37°C with KHB. The apical compartment was filled with 0.5 ml of KHB, the basolateral compartment was filled with 1.5 ml of KHB, and 10 µM T3 or 10 µM T4 was applied to the donor compartment. Inhibition of OATP2B1 was achieved by application of 10 µM atorvastatin (USP, Basel, Switzerland) on the apical site. Accumulation in the acceptor compartment and remaining amount in the donor compartment was quantified in 200 µl aliquots taken at 30 minutes and replaced with KHB buffer. At 60 minutes a second aliquot was taken. Both apical and basolateral KHB samples were stored in glass vials (to avoid long-term nonspecific adsorption) below −65°C prior to quantification by ultra-high-performance liquid chromatography–tandem mass spectrometry (UHPLC-MS/MS) as described subsequently. The apparent permeability (Papp) coefficient was calculated as previously described (Hubatsch et al., 2007). The determined unidirectional apparent permeability coefficients in the apical (A)-to-basal (B) or B-to-A direction were used to calculate the uptake ratio. In accordance with the commonly used efflux ratio, the uptake ratio was calculated as follows:

Triiodothyronine and Thyroxine Quantification by UHPLC-MS/MS.
For the quantification of T3 and T4 in the range of 30–3000 ng/ml, specific UHPLC-MS/MS methods were developed. For both T3 and T4, seven calibration standards (calibrators) and three levels of quality controls (QCs) in KHB at low (QC 90 ng/ml), medium (QC 1500 ng/ml), and high (QC 2400 ng/ml) concentrations were prepared by serial dilution of the respective working solution (100 µg/ml in methanol for both T3 and T4). The first concentration (30 ng/ml) of the calibrators was defined as the lower limit of quantification, and the highest concentration (3000 ng/ml) was defined as the upper limit of quantification. Calibrators and QCs were stored in aliquots in polypropylene tubes below −65°C until analysis. 13C6-T3 and 13C6-T4 (dissolved to 1000 ng/ml in methanol; Sigma-Aldrich) were used as internal standards for T3 and T4, respectively. To 20 µl of the KHB samples from the Transwell studies, 100 µl of each internal standard, 200 µl bovine serum albumin solution (60 g/l), and 700 µl of ice-cold acetonitrile (ACN) were added. The mixture was briefly vortexed, mixed for 10 minutes at 1400 rpm and room temperature, and then centrifuged for 20 minutes at 13,200 rpm and 10°C. The supernatant was transferred into a 96-deep-well plate, dried under heated nitrogen gas flow (30–50°C; Evaporex EVX-96; Apricot Designs, Monovia, CA), and reconstituted with 200 μl of injection solvent (35% eluent A and 65% eluent B; eluent A: 0.1% formic acid in water; eluent B: 0.1% formic acid in ACN) under shaking (1500 rpm) for 45 minutes at room temperature. Subsequently, each sample was transferred into a 300 μl glass insert of a high-performance liquid chromatography vial before injection into the UHPLC-MS/MS system in full-loop mode (5 μl). Quantification was performed using an UPLC HSS T3 column on an Acquity UPLC system consisting of a binary pump, an autosampler set at 10°C, and a column heater set at 45°C, which was coupled to an Acquity TQD tandem mass spectrometer (all obtained from Waters Corp., Milford, MA). The mobile phase consisted of eluents A and B. Chromatographic separation was performed at a flow rate of 0.5 ml/min with the following gradient: 0 to 1 minute, B 5%; 1–5 minutes, B 5%–100%; 5 to 6 minutes, B 100%; 6–6.01 minutes, B 100%–5%; 6.01–7 minutes, B 5%. In addition to the aforementioned injection solvent and eluents, the weak and strong wash solvents were water-ACN (50:50, v/v) containing 0.2% trifluoroacetic acid, and ACN-isopropanol-acetone (40:40:30, v/v/v) containing 0.2% trifluoroacetic acid, respectively. The seal wash solvent consisted of a water-ACN mixture (90:10, v/v). Multiple reaction monitoring detection was performed with electrospray ionization in positive ion mode. Nitrogen was used both as desolvation and nebulization gas. Argon was used as collision gas. The tandem mass spectrometry parameters were generated using IntelliStart software (Waters Corp.) followed by manual optimization. The optimized parameters are summarized in Table 1.
Optimized tandem mass spectrometry parameters in electrospray ionization positive mode for analytes and the corresponding internal standards
Statistical Analysis.
Data are presented as mean ± S.D. Data analysis was performed using GraphPad Prism software version 6.04 (GraphPad Software Inc., San Diego, CA) and Microsoft Excel (Microsoft, Redmond, WA). Values of P ≤ 0.05 were considered as statistically significant.
Results
Influence of Thyroid Hormones on OATP2B1 Transport Activity.
In a first approach, we tested the influence of T4 and its metabolic products, namely T3, rT3, and T4G (Fig. 2A) on OATP2B1-mediated uptake of the known substrate E1S using OATP2B1 expressing MDCKII cells. Expression of OATP2B1 (isoform 1B) in the cell model was verified by immunofluorescence microscopy (Fig. 1A) and western blot analysis (Fig. 1B) showing localization of OATP2B1 at the plasma membrane of overexpressing MDCKII-OATP2B1 cells. As shown in Fig. 2, B–E, all of the tested compounds significantly inhibited OATP2B1 transport function, thereby providing the first evidence of an interaction of THs with this membrane transporter. OATP2B1 function was potently inhibited by T4 (IC50 2.43 µM, CI 2.91–3.08) and T3 (IC50 0.51 µM CI 0.39–0.64), while rT3 (IC50 14.88 μM CI 12.16–18.21) and T4G (IC50 44.55 μM CI 36.07–55.03) exhibited lower inhibitory potency. Inhibition of OATP2B1 by the known OATP2B1 substrate, atorvastatin, served as a positive control of the experimental system (Fig. 1C). The influence of TH derivatives was also tested in Caco-2 cells transiently transfected with OATP2B1-pEF6 for overexpression of the transport protein. Using this cell model, we also observed inhibition of OATP2B1-mediated cellular accumulation of E1S for T4 (IC50 4.81 µM, CI 3.65–6.34), T3 (IC50 0.97 µM CI 0.61–1.53), rT3 (IC50 16.10 μM CI 11.44–22.65), and T4G (IC50 57.21 μM CI 38.11–85.89). Notably, the transport rate of E1S in OATP2B1-transfected Caco-2 cells was lower than that observed for stably transfected MDCKII-OATP2B1 cells (mean transport rate ± S.D.; fmol μg protein−1/min−1; Caco-2-OATP2B1 vs. MDCKII-OATP2B1; 0.268 ± 0.055 vs. 1.226 ± 0.086; n = 3 independent replicates, each in biologic triplicate; P < 0.05; ordinary one-way analysis of variance with Turkey’s multiple comparisons test).

Validation of OATP2B1 expression and function in stably transfected MDCKII cells. Immunofluorescent staining of MDCKII-OATP2B1 and MDCKII cells revealed localization of the transporter in the basolateral membrane of polarized MDCKII cells overexpressing the transporter. No signal was observed in MDCKII cells (A). Immunoblot analysis verified high expression when comparing MDCKII and MDCKII-OATP2B1 cells, as shown in the representative blot (B). Uptake of [3H]-E1S was significantly enhanced in the presence of the transporter, while it was reduced by co-incubation with atorvastatin (C).

Inhibition of OATP2B1-mediated uptake by TH derivatives. Uptake of [3H]-E1S in MDCKII-OATP2B1 was determined in the presence of different THs derived from T4 (A). Cellular accumulation of E1S was determined after incubation with increasing concentrations of T4, (B), T3 (C), rT3 (D), or T4G (E). The logarithmic inhibitor response curves were fitted to determine the IC50 values and the respective confidence intervals (CI). The data presented are of n = 3 independent replicates each in triplicate.
Competitive Counter-Flow Transport Studies with Thyroid Hormones in OATP2B1-Expressing Cells.
Subsequently, competitive counter-flow experiments were conducted to determine whether the observed inhibition is due to transport of the tested TH derivative. Counter-flow was assessed in MDCKII-OATP2B1 cells at equilibrium, which was reached after 30 minutes of incubation with E1S (compare Fig. 3A). An examination of the remaining amount of radiolabeled [3H]-E1S in cells exposed to T4 (25 µM), T3 (10 µM), and rT3 (1 mM) revealed significantly lower levels of the radiolabel compared with cells exposed to dimethylsulfoxide (DMSO) vehicle control (mean percentage of DMSO control ± S.D.; T4: 39.41% ± 9.93%, T3: 40.34% ± 10.37%; rT3: 57.20% ± 15.37%; one-way analysis of variance with Dunnett’s multiple comparisons test; P < 0.05), suggesting that these compounds are OATP2B1 substrates. In this assay, the known OATP2B1 substrates atorvastatin (30 µM; 28.33% ± 6.17%) and E1S (50 µM; 42.31% ± 8.26%) expectedly reduced intracellular E1S after addition in the steady state. Lastly, T4G (400 µM; 80.70% ± 33.70%) and camptothecin (97.71% ± 14.07%) did not affect cellular E1S equilibrium (Fig. 3B), indicating that these compounds were not substrates of OATP2B1.
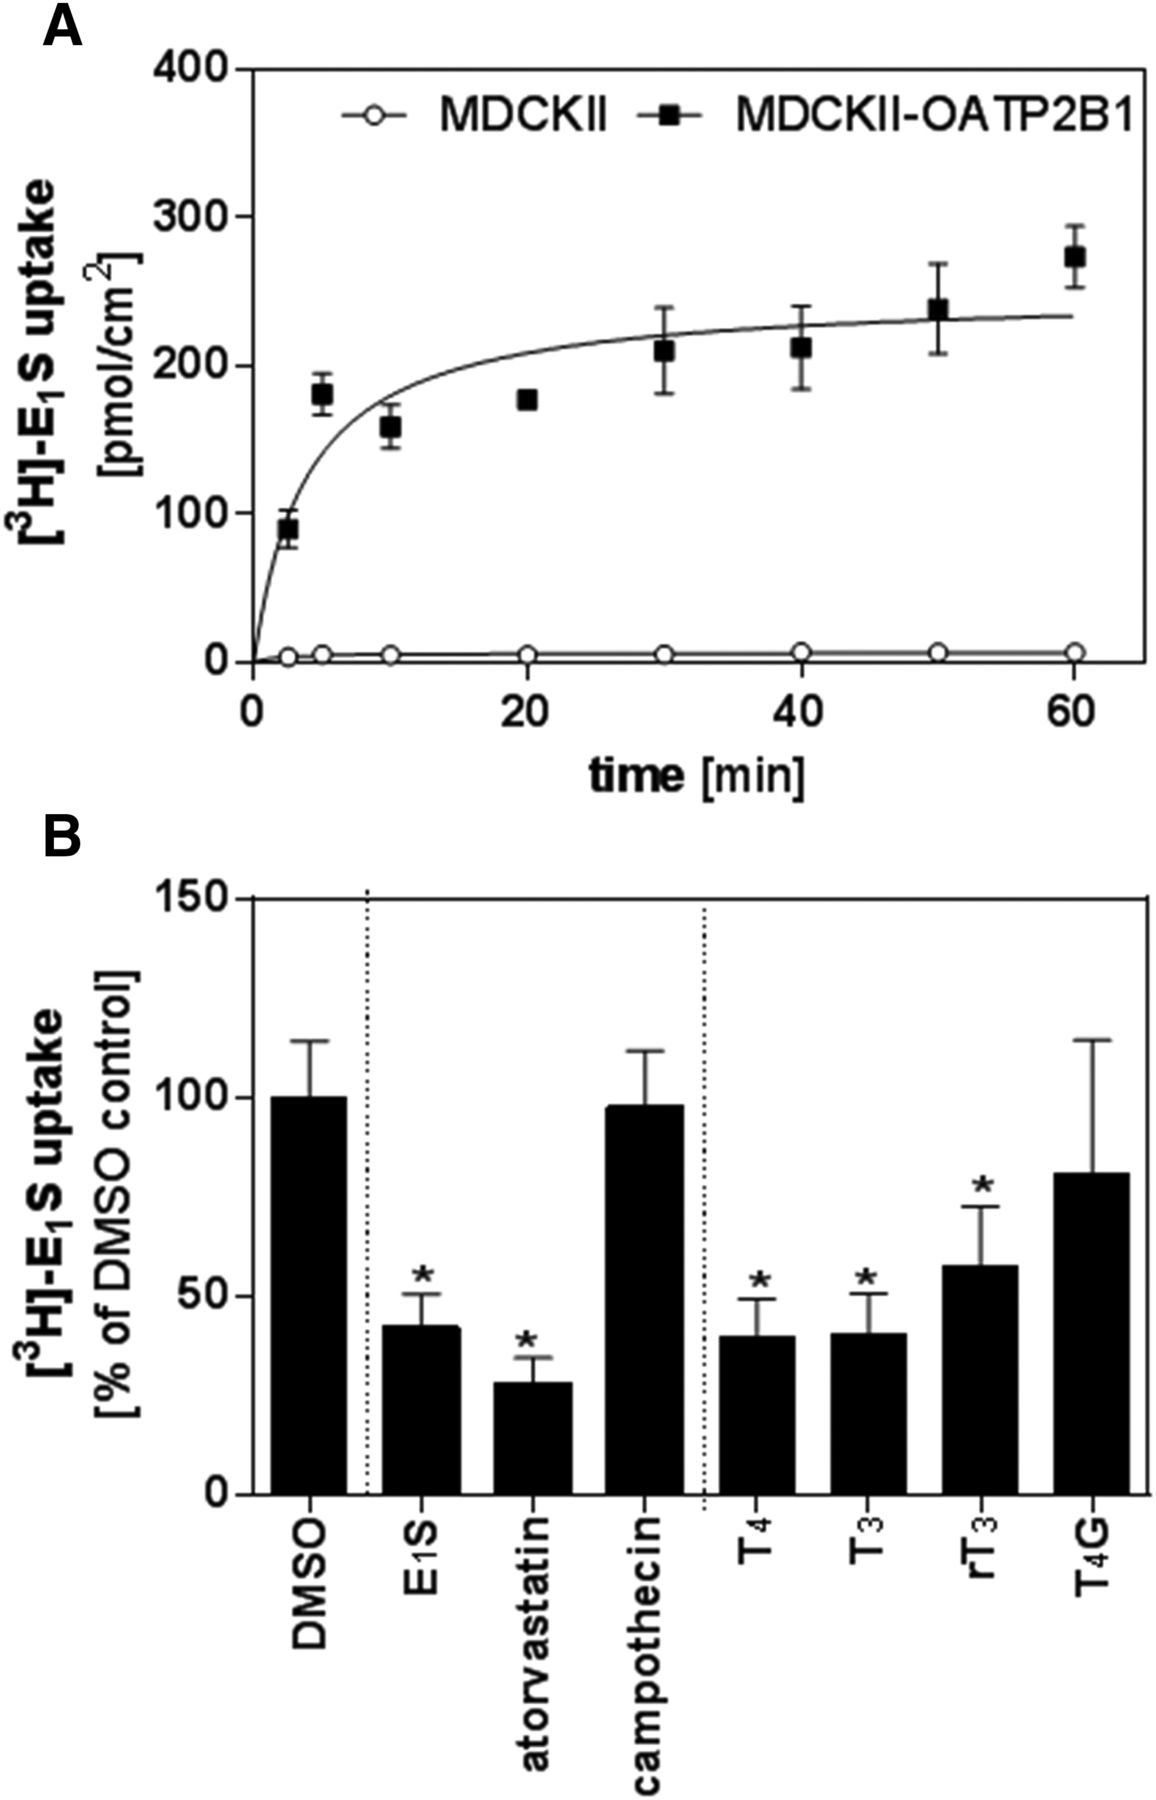
Competitive counter-flow assays in MDCKII-OATP2B1 cells. Assessment of time-dependent accumulation of [3H]-E1S comparing MDCKII and MDCKII-OATP2B1 cells (A). Counter-flow experiments were conducted after reaching the steady state of E1S at 30 minutes of incubation. The cellular amount of the radiotracer was determined after 1 minute of incubation with 50 µM E1S, 30 µM atorvastatin, 1 mM camptothecin, 25 µM T4, 10 µM T3, 1 mM rT3, or 400 µM T4G (B). The detected amount of radiotracer was normalized to that in cells treated with the solvent control. Data are presented as mean ± S.D. (n = 3 independent replicates each in triplicate). For the statistical analysis, one-way analysis of variance with Dunnett’s multiple comparisons test was used (*P ≤ 0.05).
Influence of OATP2B1 Transport Function on Intracellular Thyroid Hormone Effects.
To provide additional evidence for OATP2B1 transport of THs, we tested the impact of OATP2B1 expression on intracellular TH signaling. MDCKII or MDCKII-OATP2B1 cells were used for cell-based reporter gene assays that examined transactivation of the human DIO1 promoter (see the illustration below the graphs in Fig. 4). With overexpression of the OATP2B1 transporter, transactivation of the DIO1 promoter was significantly enhanced by both T3 and T4 with cotransfection of TRβ with or without RXRα (Fig. 4, A and B). Thyroid hormones did not activate the DIO1 promoter in both cell lines transfected with just RXRα (Fig. 4C); indicating the signal enhancement was TRβ dependent. It is notable that the transfection efficacy in MDCKII was much lower than that of HepG2 or HeLa cells in cell-based reporter gene assays conducted in our laboratory. This, in part, explains the lower transactivation of the DIO1 promoter by about 3-fold, since we usually see a transactivation of about 5- to 6-fold compared with vector control in experiments with cells better accessible by transfection.

Influence of OATP2B1 expression on transactivation of the DIO1 promoter. Transactivation of the DIO1 promoter was determined by cell-based dual luciferase assays comparing MDCKII with MDCKII-OATP2B1 cells (see the illustration below the graphs). Luciferase activity was assessed after treatment with T3 or T4. MDCKII or MDCKII-OATP2B1 cells were transfected with DIO1-pGL3basic and eukaryotic expression vectors encoding for TRβ (A), RXRα (B) or both (C). Data are presented as mean ± S.D. (n = 3 independent replicates each in triplicate). For the statistical analysis, two-way analysis of variance with Sidak’s multiple comparisons test was used (*P ≤ 0.05).
Expression of OATP2B1 and TRβ in Human Tissues and Cellular Models.
Different tissues and commonly used cellular models of those organs were analyzed by real-time PCR to determine endogenous expression of the transporter OATP2B1 isoform 1B, OATP2B1 isoform 1E, TRβ, TRα, and DIO1. The DIO1 was only observed in liver kidney, and in Caco-2, HepG2, Huh-7, and RPTECs but not in LS180 cells (mean expression ± S.D., relative to liver, Caco-2 vs. LS180 vs. Huh-7 vs. HepG2 vs. RPTEC, DIOI: 0.779 ± 0.313 vs. not detected vs. 0.038 ± 0.003 vs. 0.162 ± 0.027 vs. 0.006 ± 0.006, data not shown). As shown in Fig. 5, A and B, the mRNA of TRα or TRβ was observed in all tissues studied. Examination of the mRNA expression of the OATP2B1 isoforms verified the previous observation of isoform 1B as enriched in the intestine, while isoform 1E (Fig. 5E) was predominantly expressed in liver (Fig. 5F) (Knauer et al., 2013). For all genes examined in different cell models, the highest expression levels were observed in intestinal Caco-2 cells compared with LS180, Huh-7, HepG2, and RPTEC (mean expression ± S.D., relative to liver, Caco-2 vs. LS180 vs. Huh-7 vs. HepG2 vs. RPTEC, TRα: 36.266 ± 7.289 vs. 28.116 ± 6.395 vs. 12.942 ± 3.582 vs. 2.815 ± 0.374 vs. 7.531 ± 1.686; TRβ: 4.521 ± 1.224 vs. 4.321 ± 0.372 vs. 4.614 ± 0.315 vs. 1.022 ± 0.162 vs. 1.384 ± 0.157, OATP2B1-1B: 149.599 ± 66.648 vs. not detected vs. 14.071 ± 4.627 vs. 5.358 ± 0.956 vs. 0.145 ± 0.074 and OATP2B1-1E: 9.278 ± 2.381 vs. 3.553 ± 0.334 vs. 0.297 ± 0.073 vs. 0.222 ± 0.083 vs. 0.002 ± 0.001; Fig. 5, C, D, G, and H), thereby supporting further use of Caco-2 cells for in vitro studies on the interactions of OATP2B1 and THs.

Gene expression analysis in tissues and commonly used cellular models. Expression of TRα and TRβ was quantified by real-time PCR in different human tissues (A and B) and corresponding cellular models (C and D) using specific TaqMan gene expression assays. In addition, mRNA amount of two isoforms of the OATP2B1 was assessed. Both isoform 1B and isoform 1E (SLCO2B1 1B and 1E) were quantified with SYBRgreen assays (E–H). Relative expression of each gene was calculated according to the ΔΔCt method. Data are presented as mean ± S.D., n = 3 independent replicates each in triplicate.
Quantification of Transcellular Transport of Thyroxine and Triiodothyronine in Caco-2 Cells.
Transcellular flux of T4 or T3 was assessed in differentiated Caco-2 cells cultured in Transwells. The amount of T4 and T3 in the apical or basal compartment was quantified by UHPLC-MS/MS. Solute flux studies in the A-to-B direction revealed that T4 exhibits intermediate permeability, while T3 shows low permeability since the Papp value was below 3.3 × 10⁻⁶ cm/s [mean Papp (A-B) ± S.D. (cm/s), T4: 3.70 × 10⁻⁶ ± 0.17 × 10⁻⁶; T3: 2.75 × 10⁻⁶ ± 7.08 × 10⁻⁹]. Lower permeability was observed when examining transcellular transfer of THs in the B-to-A direction [mean Papp (B-A) ± S.D. (cm/s), T4: 2.08 × 10⁻⁶ ± 1.55 × 10⁻⁹; T3: 0.893 × 10⁻⁶ ± 2.51 × 10⁻⁹]. Similar results were obtained with T4 and T3 permeability after 60 minutes of incubation using the same system in the A-to-B direction [mean Papp (A-B) ± S.D. (cm/s); T4: 2.75 × 10⁻⁶ ± 0.57 × 10⁻⁶; T3: 3.36 × 10⁻⁶ ± 0.77 × 10⁻⁶, data not shown] or B-to-A direction [mean Papp (A-B) ± S.D. (cm/s); T4: 2.34 × 10⁻⁶ ± 0.32 × 10⁻⁶; T3: 1.74 × 10⁻⁶ ± 0.36 × 10⁻⁶]. However, calculating the uptake ratio—which was conducted in a similar manner as the commonly used efflux ratio, but by dividing Papp (A-B) by Papp (B-A)—revealed factors of 1.779 ± 0.130 and 3.203 ± 0.909 for T4 and T3, respectively; highlighting that there is a component in cellular transfer that enhances A-to-B flux, despite that low permeability observed. Addition of atorvastatin (10 µM) as a known inhibitor of OATP2B1 in the bidirectional permeability assessment significantly changed the uptake ratios (Papp (A-B)/Papp (B-A)) for T4 and T3 (Fig. 6). These results indicate the presence of atorvastatin-sensitive, TH transporters in Caco-2 cells.

Transcellular flux of THs and localization of OATP2B1 in cultured Caco-2 cells. Caco-2 cells cultivated for 14 days in a Transwell system were used to assess apical-to-basolateral (A-B) or basolateral-to-apical (B-A) flux of T4, or T3 in presence of solvent control (DMSO), or atorvastatin (10 µM). The unidirectional Papp coefficients for T4 (B) and T3 (D) were used to calculate the uptake ratios [Papp (A-B)/Papp (B-A)] for T4 (A) and T3 (C). Data are presented as mean ± S.D. (n = 3 independent replicates). For statistical analysis, Sidak’s multiple comparisons test was used (*P ≤ 0.05).
Transcriptional Regulation of OATP2B1 by Thyroid Hormones.
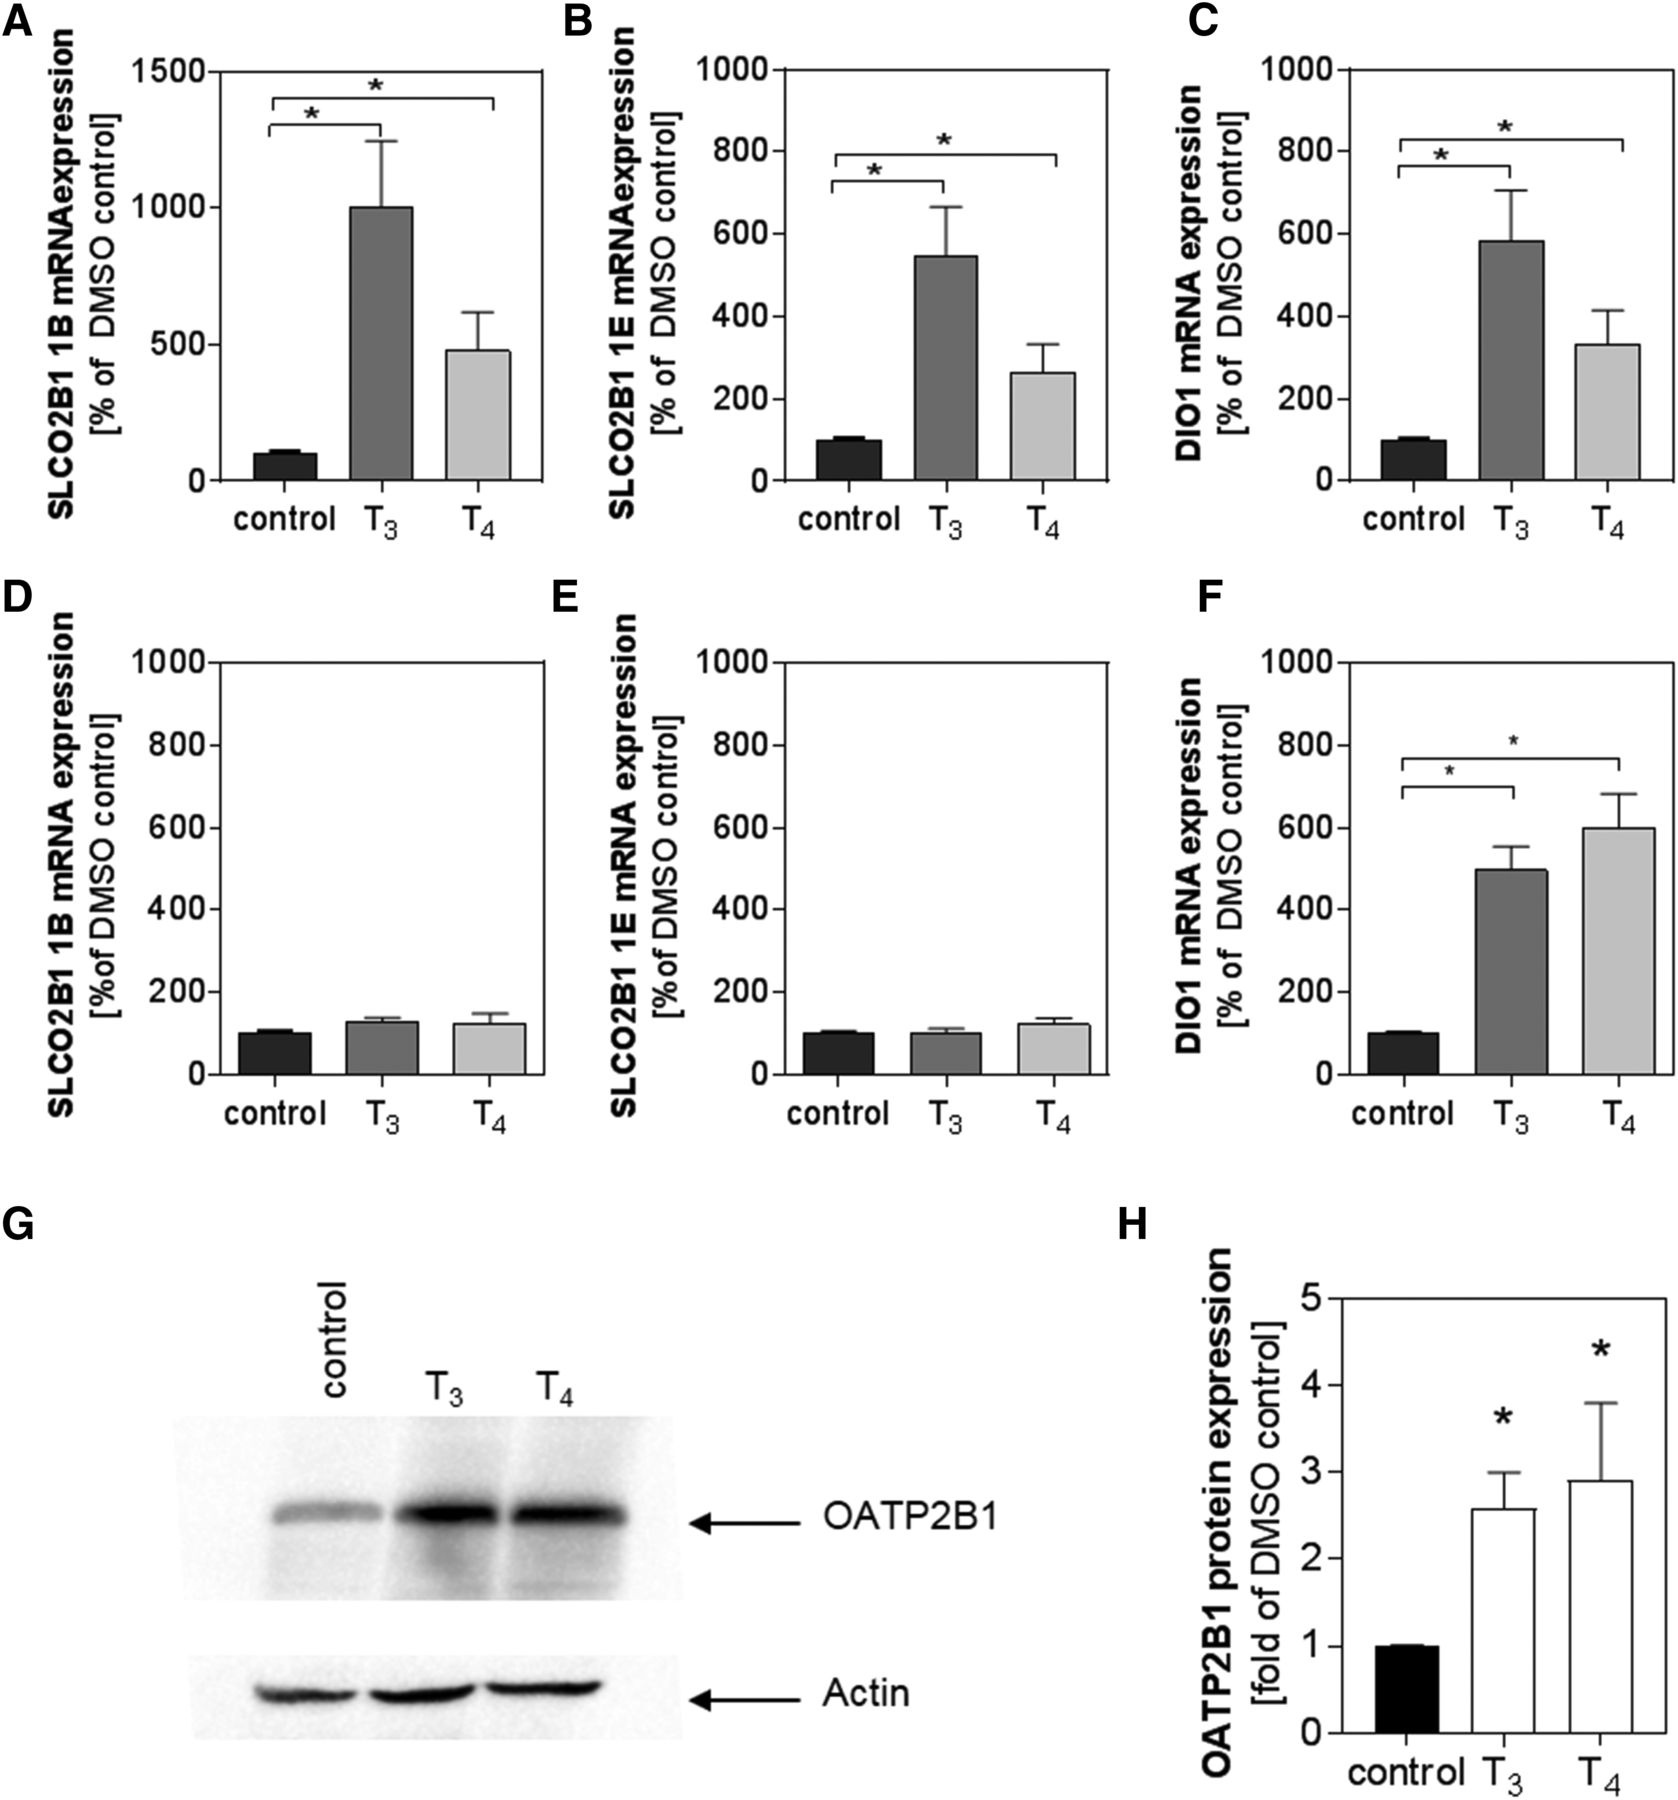
Furthermore, we examined whether T4 (100 nM) or T3 (100 nM) treatment influences the expression of OATP2B1 variants in Caco-2 or Huh-7 cells. Both OATP2B1 1B and 1E variants are expressed in Caco-2 and Huh-7 cells (Knauer et al., 2013). We found that T3 and T4 treatments increased the mRNA expression of the intestinal OATP2B1 1B variant by 10-fold (mean % of DMSO control ± S.E.M., 1008% ± 240% of control, P < 0.05), and 4.8-fold (480% ± 140% of control, P < 0.05), respectively, in Caco-2 cells (Fig. 7A). However, the THs did not appreciably increase the OATP2B1 1B mRNA expression in Huh-7 cells (Fig. 7D). The liver-enriched OATP2B1 1E variant mRNA expression was also induced 5.5-fold (549% ± 118% of control, P < 0.05) by T3 and 2.7-fold (265% ± 69% of control, P < 0.05) by T4 in Caco-2 cells (Fig. 7B), but again not in Huh-7 cells (Fig. 7E). For controls, we examined the expression of DIO1 and ABCB1 (P-gp); two well-recognized TR target genes. As expected, both T3 and T4 treatments induced the expression of DIO1 in both Caco-2 (Fig. 7C) and Huh-7 cells (Fig. 7F). Induction was also observed for the expression of ABCB1 in Caco-2 (mean % of DMSO control ± S.D., T3: 9100% ± 8366%; T4: 2054% ± 507.8%; n = 5, Kuskal-Wallis test, P < 0.05) and in Huh-7 cells (T3: 148.2% ± 52.6%; T4: 161.1% ± 63.87%; n = 5, Kuskal-Wallis test, P < 0.05) (data not shown). Similar results were observed when testing the influence of THs on OATP2B1 protein expression in differentiated Caco-2 cells cultivated for 14 days prior to TH exposure. As shown in Fig. 7, G and H, expression of OATP2B1 was significantly increased by 2.6-fold in the presence of T3 and by 2.9-fold in the presence of T4. We additionally examined TH-mediated regulation of OATP2B1 expression in other intestinal and liver cell lines. With intestinal LS180 cells, there was significant increment in the OATP2B1 isoform 1E mRNA expression after exposure to T3 (mean expression % of DMSO control ± S.D.; DMSO vs. T3 vs. T4; 117.92 ± 12.99 vs. 294.07 ± 41.46 vs. 244.36 ± 156.71; n = 3 independent replicates each in triplicate; P < 0.05; Kruskal-Wallis test with Dunn’s multiple comparisons test). In LS180 cells, the amount of ABCB1 mRNA was also significantly increased by T3 treatment (DMSO vs. T3 vs. T4; 121.93 ± 16.95 vs. 1286.14 ± 256.45 vs. 738.32 ± 400.22; P < 0.05). However, for both genes we did not observe changes in expression after exposure of LS180 cells to T4. It is notable that the mRNA expressions of the OATP2B1 1B variant and that of DIO1 were not detected in LS180 cells. In HepG2 cells we tested the influence of T3 on DIO1, ABCB1, and the OATP2B1 variants, and observed no significant change in mRNA expression of any gene (mean expression % of DMSO control ± S.D.; DMSO vs. T3 DIO1: 105.01 ± 2.81 vs. 155.71 ± 19.93; ABCB1: 105.99 ± 2.48 vs. 89.96 ± 15.25; OATP2B1 1E: 103.81 ± 1.64 vs. 144.9 ± 10.11; OATP2B1 1B 104.81 ± 2.22 vs. 139.92 ± 5.60; n = 3 independent replicates each in triplicate; P > 0.05 n = 3 independent replicates each in triplicate; Mann-Whitney test). Taken together, these results demonstrate that THs are positive regulators of OATP2B1 gene expression in a cell type–dependent manner.

Influence of THs on expression of OATP2B1. Expression of SLCO2B1 isoform 1B (A) SLCO2B1 isoform 1E (B) and deiodinase type 1 (C) mRNA was quantified by real-time PCR after 48 hours of treatment of differentiated Caco-2 cells with T3 (100 nM) or L-thyroxine (T4, 100 nM). Amount of SLCO2B1 isoform 1B (D), SLCO2B1 isoform 1E (E), and deiodinase type 1 (F) mRNA was quantified by real-time PCR in Huh-7 cells treated with T3 (100 nM) or T4 (100 nM). Expression data were calculated by the ΔΔ-Ct method, where expression was related to that of a housekeeping gene and then normalized to the solvent control. Data are presented as mean ± S.E.M. of n = 5 experiments. Gene expression was analyzed with a Kruskal-Wallis test with Dunn’s multiple comparisons test. OATP2B1 protein expression was assessed by western blot analysis [representative result, (G)]. Actin served as the loading control (H). Data obtained by densitometry of n = 3 experiments are presented as mean ± S.D., and comparisons were analyzed by one-way analysis of variance with Dunnett’s multiple comparisons test (E) (*P < 0.05).
OATP2B1 Promoter Analysis and Cell-Based Reporter Gene Assays.
Transcriptional regulation by THs is mediated by TRs. These nuclear receptors bind to DNA response elements in the promoter region of their target genes. We performed an in silico analysis to search for the TR DNA-binding motifs DR4, ER6, and DR1 in the SLCO2B1 1b or SLCO2B1 1e promoters (Knauer et al., 2013). As summarized in Table 2 and shown in Fig. 8A, multiple potential response elements for TRs were identified in the sequences analyzed. In detail, the ER6 motif (AGTCCTcagtccAGGAAA) in positions −899 to −882 exhibited the highest rank in the analysis of the SLCO2B1 1b promoter sequence, while the previously reported DR1 motif (AGGGCAaAGTCCA in positions −17 to −4), had the highest score in the SLCO2B1 1e promoter. Considering the differential tissue/cell expression of TRα and cell-type specific induction of OATP2B1 by THs, we examined whether the SLCO2B1 1b and SLCO2B1 1 e promoters were activated in the presence of TRα and its activating ligand T3 in cell-based luciferase assays. The TR-sensitive DIO1 promoter served as the control in these experiments. We observed significantly enhanced luciferase activity after treatment with T3 in HeLa cells transfected with the SLCO2B1 1b promoter (mean luciferase activity fold of pGL3b control ± S.D.; DMSO vs. T3; 1.364 ± 0.141 vs. 2.268 ± 0.444; P < 0.05 student’s t test, Fig. 8B). Similarly, T3 treatment enhanced the SLCO2B1 1e promoter luciferase activity (1.197 ± 0.142 vs. 2.260 ± 0.485; P < 0.05 student’s t test, Fig. 8C). These results demonstrate that both SLCO2B1 1b and SLCO2B1 1e promoters are transactivated by TRα.
Summary of potential TR response elements in the SLCO2B1 1b and SLCO2B1 1e promoter region
Analysis was performed using the publically available NUBIscan software. Response element marked with † exhibited the highest score in the in silico analysis for this particular motif. Response element highlighted in bold had the highest score in the analysis of the respective promoter fragment. Response element marked with * was previously reported to be the most likely HNF4α binding site, resulting in constitutive activity of the promoter in cells, where this transcription factor is present (Knauer et al., 2013).

TRα-mediated transactivation of the SLCO2B1-1b or SLCO2B1-1e promoter. Arrangement of the respective region of the SLCO2B1 gene locus depicting the different exons 1a to 1e. For the transcriptional start site variants SLCO2B1-1B and 1E, details on the localization of potential thyroid hormone receptor response elements in the respective promoter region are shown (A). Cell-based reporter gene assays were performed in HeLa cells transiently transfected with the SLCO2B1-1b (B), SLCO2B1-1e (C), or the Dio1 (D) promoter and treated with T3 (10 μM) or solvent control. Data are shown as the mean luciferase activity fold of pGL3-basic (n = 3 independent replicates each in triplicate); *, <0.05 Student’s t test.
Discussion
We report interaction of THs with the function and expression of OATP2B1. This ubiquitously expressed transporter, with suspected function in the intestinal absorption of drugs, was inhibited by all TH derivatives tested in OATP2B1-expressing cells. Furthermore, counter-flow experiments assessing the influence of TH derivatives on the cellular equilibrium of E1S at steady state suggested that T3, T4 and rT3 are not only inhibitors but also substrates of OATP2B1. This notion was further supported by findings showing that the presence of OATP2B1 significantly enhanced intracellular TH signaling as observed in cell-based reporter gene assays comparing MDCKII and MDCKII-OATP2B1 cells. The presence of an active transport component in the transcellular transport of T3 and T4 was supported by results of transcellular flux experiments in the intestinal cell line Caco-2. Indeed, we observed enhanced permeability in the A-to-B direction for both T4 and T3, resulting in uptake ratios (Papp (A-B)/Papp (B-A)) of about 1.8 and about 3.2 for T4 and T3, respectively. Atorvastatin, which is a known substrate and competitive inhibitor of OATP2B1 (Grube et al., 2006), significantly reduced this ratio for T3 and T4. The observed reduction in the TH uptake ratio by atorvastatin could certainly be interpreted in terms of reduced uptake mediated by apically localized OATP2B1, but it should also be noted that multiple transporters are expressed in enterocytes and Caco-2 cells, of relevance being the efflux transporter ABCB1 (P-gp), which has previously been reported to also transport T3 (Mitchell et al., 2005). Moreover, atorvastatin is not a specific OATP2B1 inhibitor, and thus also interacts with several efflux transporters including the aforementioned ABCB1 (Chen et al., 2005). Despite that, we observed reduction in the net absorption of THs in the presence of atorvastatin in Caco-2 cells, even if it is likely that there has been reduced apical TH efflux by ABCB1 in the presence of atorvastatin.
As previously mentioned, localization of OATP2B1 in enterocytes is a matter of an ongoing debate, which was sparked by recent experiments by Kaiser et al. (2017), indicating that OATP2B1 is localized in the basolateral membrane of enterocytes. This localization would be expected to result in an increase in the uptake ratio of OATP2B1 substrates in the presence of an inhibitor specific to this transporter, which has not been observed in the herein reported experiments. Even if we are not able to dissect the contribution of each Caco-2 transporter to TH fluxes since atorvastatin is a potent inhibitor of OATP2B1, but not specific for this transporter, our observation, which showed a reduction in the ratio, would be in agreement with findings by others showing expression of OATP2B1 in the apical membrane of enterocytes and Caco-2 cells (Tamai et al., 2001; Kobayashi et al., 2003).
Our data demonstrated inhibition of OATP2B1 function by T3 and T4 with in vitro IC50 values in the micromolar range. Whether this inhibition is of clinical relevance with respect to TH being a perpetrator of pharmacokinetic drug interactions, especially in other tissues than intestine, is uncertain. However, normal T4 plasma concentrations range from 0.59 to 1.54 µM. Furthermore, T4 is significantly bound to serum proteins resulting in free T4 concentrations of 0.09–0.24 nM. Considering these low physiologic free plasma concentrations, it seems unlikely that T4 would alter the tissue distribution/elimination of drugs through inhibition of OATP2B1. Similar considerations could be taken for T3, whose physiologic plasma total concentrations range from 0.01 to 0.03 µM.
At the clinical level, little is known regarding the role of OATP2B1 in the intestinal absorption of L-thyroxine. A clinical study was conducted by Lilja et al. (2005), motivated by a case in which a patient experienced significant changes in L-thyroxine efficacy after grapefruit juice ingestion. Grapefruit juice is known to inhibit intestinal OATP2B1 (Satoh et al., 2005). The investigators found that grapefruit juice slightly reduced the L-thyroxine area under the plasma concentration-time curve by 9% within 0–6 hours, which was concluded to be clinically insignificant. While this finding argues against the role of OATP2B1 in the oral absorption of L-thyroxine, it is notable that inhibition of OATP2B1 by grapefruit juice may be drug specific since the transporter possesses two binding sites for substrates and inhibitors (Shirasaka et al., 2012, 2014). Characterization of L-thyroxine binding to the high- and low-affinity binding sites and modulation by grapefruit juice remains to be determined. Another explanation for the lack of a significant pharmacokinetic interaction in the aforementioned study may be that it was conducted with healthy volunteers, while in the clinical case report the patient had hypothyroidism. The possibility that hypothyroidism may influence the magnitude of the juice/L-thyroxine interaction is supported by our finding that OATP2B1 expression is regulated by THs.
We showed upregulation of OATP2B1 mRNA and protein expression in Caco-2 cells by THs, suggesting that TH status influences the expression and activity of the intestinal uptake transporter. A similar transcriptional regulation was observed when assessed in LS180 cells, an additional intestinal cell model previously used to show induction of ABCB1 after exposure to THs (Mitin et al., 2004). Interestingly, when examined in Huh-7 and HepG2 cells, models for hepatocytes, THs did not affect OATP2B1 expression, pointing to cell model–specific regulation. Expression of TRβ was observed in all cell models used in our study, suggesting that differential expression of this receptor is not the reason underlying the cell-specific effect. In contrast, quantification of TRα revealed a lower amount of this nuclear receptor in hepatic cell models, suggesting that this nuclear receptor may be involved in the regulation of OATP2B1 expression observed in the intestinal cells. Two N-terminal protein variants of OATP2B1 (variants 1B and 1E) have been described; these variants are assumed to be transcriptionally regulated by different promoter regions since their transcriptional start sites differ. In accordance are findings showing that the liver-enriched SLCO2B1 1E, but not the ubiquitously expressed SLCO2B1 1B transcriptional start site variant, is regulated by the transcription factor HNF4α (Knauer et al., 2013). However, with respect to regulation by TRα we observed significant transactivation of both SLCO2B1 promoters. Considering that multiple potential binding sites for TRs were predicted in the promoter sequences of SLCO2B1-1b and SLCO2B1-1e and that TRα is the predominant nuclear receptor in intestine (Sirakov and Plateroti, 2011), differences in TRα expression levels may be the mechanism underlying the observed differences in transcriptional regulation in hepatic (Huh-7 and HepG2) and intestinal (Caco-2 and LS180) cells.
There is evidence that TH status modulates expression and function of other drug transporters in the intestinal wall. For example, the efflux transporter ABCB1 that limits intestinal drug absorption is regulated by THs (Mitin et al., 2004). Indeed, the required doses of the ABCB1 substrate digoxin used to treat cardiac failure and to control heart rate differ among patients suffering from hyper- or hypothyroidism compared with patients with normal thyroid function. Specifically, higher and lower digoxin maintenance doses are needed with hyperthyroidism and hypothyroidism, respectively (Burk et al., 2010). It is notable that digoxin is not a substrate of OATP2B1 (Taub et al., 2011). Another study by Jin et al. (2005) showed that the trough plasma concentrations of the ABCB1 substrate cyclosporin A were lower in patients taking L-thyroxine. Increased expression of abcb1a/abcb1b in mice after long-term treatment with L-thyroxine was found to explain this clinical drug-drug interaction. Lastly, Siegmund et al. (2002) reported induction of intestinal ABCB1 in humans treated with L-thyroxine. However, this induction of ABCB1 resulted only in minor, nonclinically relevant changes in the pharmacokinetics of talinolol, an ABCB1 substrate (Siegmund et al., 2002). It is interesting that talinolol is also a substrate of the uptake transporters OATP2B1 and OATP1A2 (Shirasaka et al., 2010), despite that it is not anionic. It is possible that TH-mediated upregulation of the intestinal efflux mechanisms could be counteracted by the concomitant upregulation of OATP2B1, leading to minimal pharmacokinetic consequences for talinolol.
In conclusion, we report that T3 and T4 are substrates of OATP2B1, indicating a novel mechanism for regulation of TH homeostasis by influencing hormone distribution and absorption during replacement therapy. In addition, we showed upregulation of OATP2B1 by THs, which may be of relevance for intestinal absorption of substrate drugs with narrow therapeutic index.
Acknowledgments
We thank Janine Hussner for support during manuscript preparation.
Authorship Contributions
Participated in research design: Meyer zu Schwabedissen, Ferreira, Schaefer, Oufir, Tirona.
Conducted experiments: Meyer zu Schwabedissen, Ferreira, Schaefer, Oufir, Seibert, Tirona.
Contributed new reagents or analytic tools: Meyer zu Schwabedissen, Hamburger, Tirona.
Performed data analysis: Meyer zu Schwabedissen, Ferreira, Schaefer, Oufir, Tirona.
Wrote or contributed to the writing of the manuscript: Meyer zu Schwabedissen, Ferreira, Schaefer, Oufir, Hamburger, Tirona.
Footnotes
- Received December 18, 2017.
- Accepted May 2, 2018.
The work was supported by the Swiss National Foundation [Grant 31003A_149603] (awarded to H.E.M.z.S.) and the Canadian Institutes of Health Research [Grant MOP-136909] (awarded to R.G.T.).
The herein reported study is part of the master thesis of A.M.S. and part of the Ph.D. thesis of C.F.
Abbreviations
- A
- apical
- ACN
- acetonitrile
- B
- basal
- DIO1
- iodothyronine deiodinase 1
- DMSO
- dimethylsulfoxide
- E1S
- estrone-3-sulfate
- FCS
- fetal calf serum
- KHB
- Krebs-Henseleit buffer
- L-thyroxine
- levothyroxine
- MDCKII
- Madin-Darby canine kidney II
- OATP
- organic anion transporting polypeptide
- Papp
- apparent permeability
- PBS
- phosphate-buffered saline
- PCR
- polymerase chain reaction
- P-gp
- P-glycoprotein
- QC
- quality control
- RPTEC
- renal proximal tubular epithelial cell
- rT3
- reverse triiodothyronine
- RXRα
- retinoid X receptor alpha
- T3
- triiodothyronine
- T4
- thyroxine
- T4G
- thyroxine 4-O-β D glucuronide
- TH
- thyroid hormone
- TR
- thyroid hormone receptor
- TRα
- thyroid hormone receptor alpha
- TRβ
- thyroid hormone receptor beta
- UHPLC-MS/MS
- ultra-high-performance liquid chromatography–tandem mass spectrometry
- Copyright © 2018 by The American Society for Pharmacology and Experimental Therapeutics


