


Article Figures & Data
Figures
- Fig. 1.
JMP ternary plot with combination points. Ternary plot of a three-compound combination containing the 10 points used to define a surface. Concentrations for each point are read by following the left diagonal lines for compound 1, horizontal lines for compound 2, and right diagonal lines for compound 3.
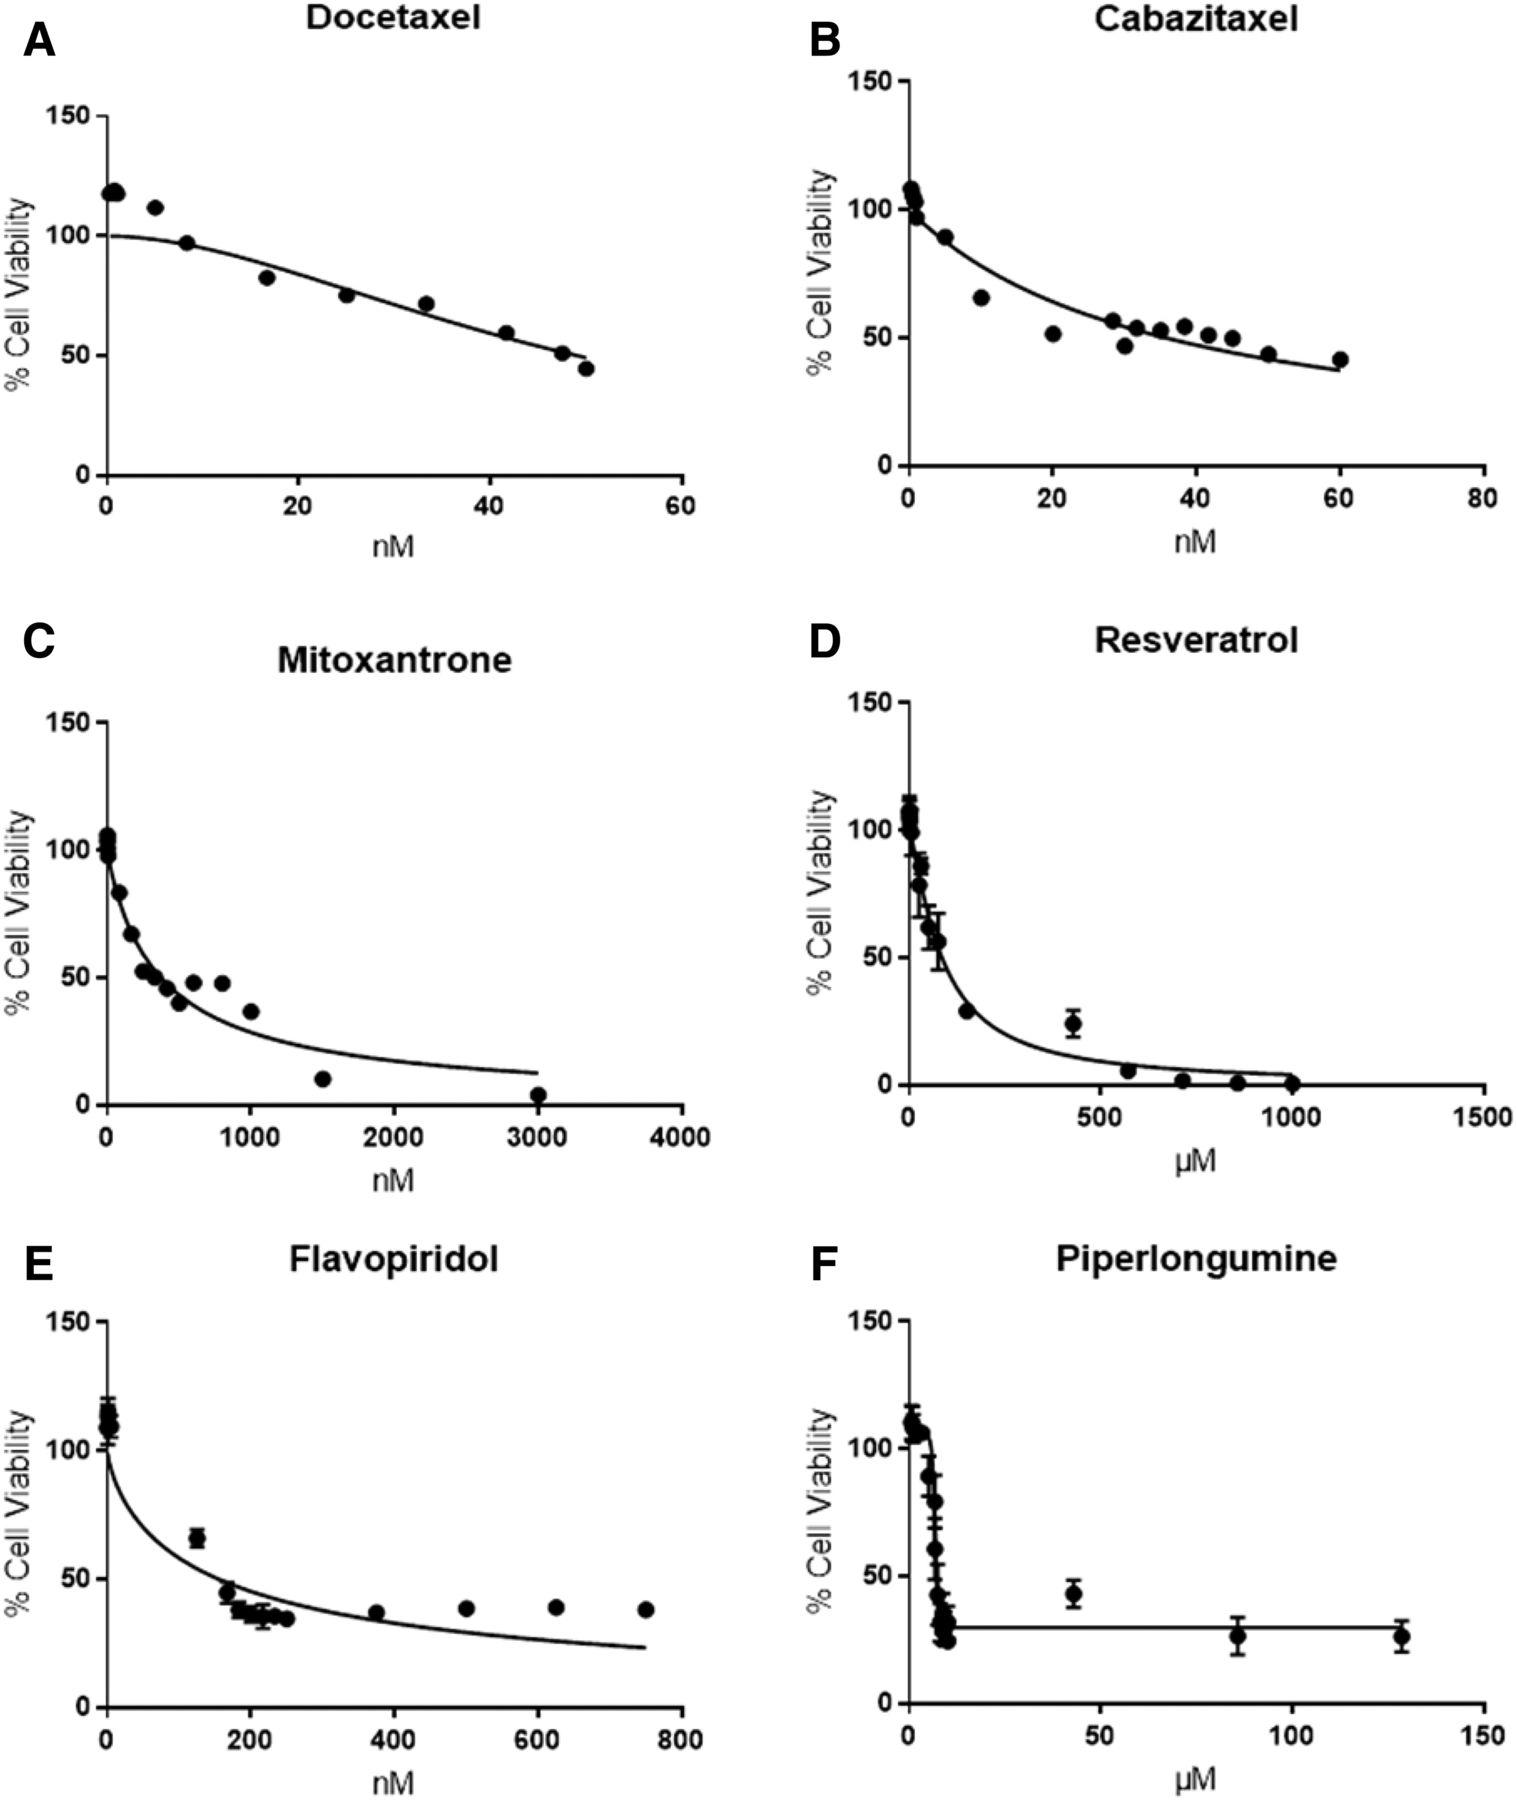
- Fig. 2.
IC50 graphs for chemotherapeutics in PC-3 human prostate cancer cells. (A) DOC, 45 nM; (B) CAB, 40 nM; (C) MIT, 400 nM; (D) RES, 75 µM; (E) FLAV, 160 nM; (F) PIP, 7 µM. n = 3.
- Fig. 3.
Response surfaces of 12 different mixtures. Bright red areas represent the most effective combinations at reducing cell viability. Deep red, gray, and blue are listed in descending order of effectiveness. The numbers within each contour represent the maximum prediction found within that contour, meaning that all predictions within that contour are less than or equal to the number found within but greater than the numbers found in the lower contours. The maximum point on the surface is indicated by a diamond. The mixtures for each ternary plot are: (A) DOC, CAB, PIP; (B) DOC, CAB, FLAV; (C) FLAV, MIT, CAB; (D) FLAV, PIP, CAB; (E) FLAV, PIP, MIT; (F) PIP, MIT, CAB; (G) RES, FLAV, CAB; (H) RES, FLAV, MIT; (I) RES, FLAV, PIP; (J) RES, MIT, CAB; (K) RES, PIP, CAB; (L) RES, PIP, MIT. All data were obtained by Alamarblue cell viability assay with three biologic replicates in triplicate.
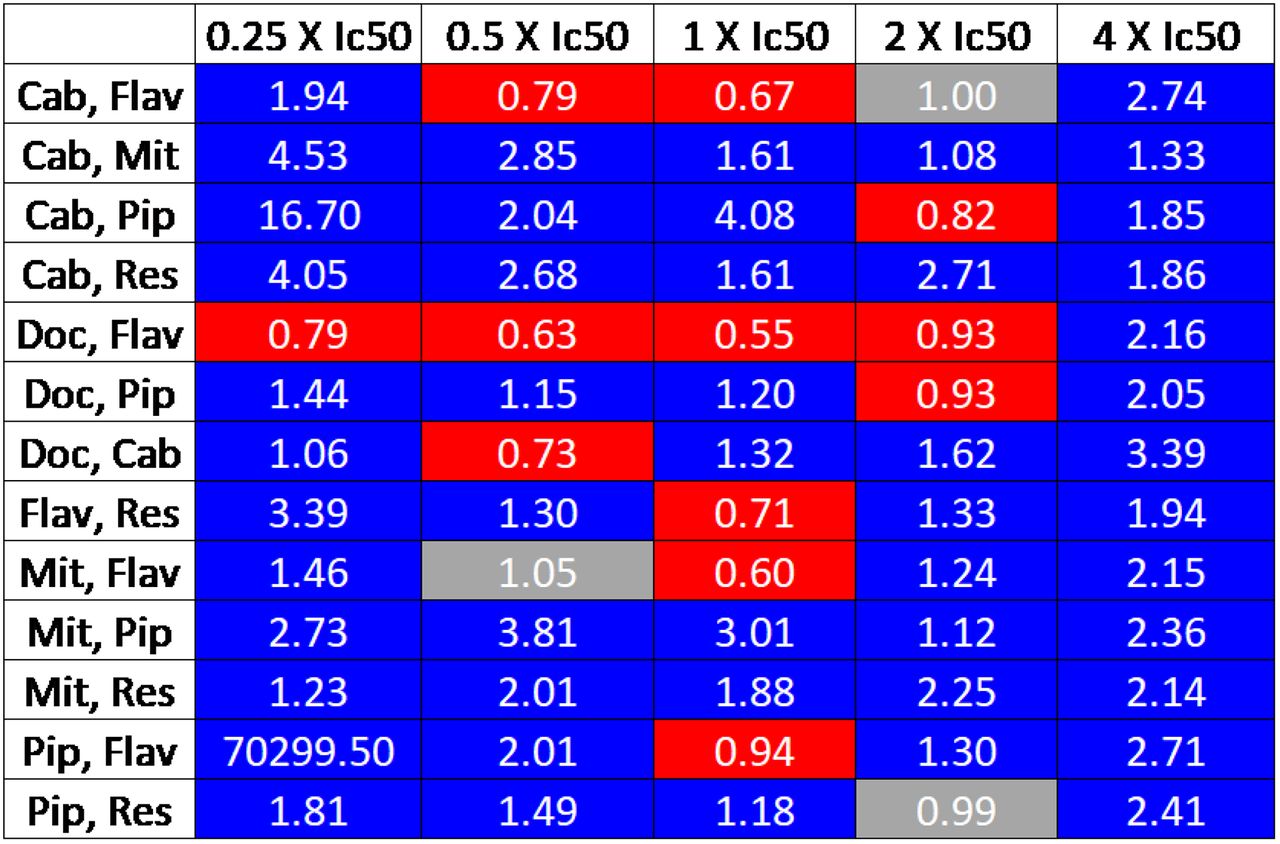
- Fig. 4.
Chou-Talalay combination index (CI) chart for all combinations. Red represents synergistic CIs, gray represents additive CIs, and blue represents antagonistic CIs. CIs were all obtained by Alamarblue cell viability assay with three biologic replicates in triplicate.
- Fig. 5.
Response surfaces produced by cell cycle analysis. Bright red areas represent the most effective combinations. Deep red, gray, and blue are listed in descending order of effectiveness. The numbers within each contour represent the maximum prediction found within that contour, meaning that all predictions within that contour are less than or equal to the number found within but greater than the numbers found in the lower contours. The maximum point on the surface is indicated by a diamond. (A) Surface for relative decrease in G1 phase populations. (B) Surface for maximizing S phase populations. (C) Surface for maximizing G2/M phase populations. (D) Surface for maximizing sub G1 populations. All data were obtained from flow cytometry of propidium iodide stained cells. All samples were analyzed in triplicate.


Tables
- TABLE 1
Ternary plot coordinate system represented as percentages—100% can be artificially set to any desired concentration
Ternary Point Compound 1 Compound 2 Compound 3 % 1 1 100 0 0 2 2 0 100 0 3 3 0 0 100 4 4 50 50 0 5 5 50 0 50 6 6 0 50 50 7 7 33.33 33.33 33.33 8 8 66.67 16.67 16.67 9 9 16.67 66.67 16.67 10 10 16.67 16.67 66.67 - TABLE 2
Optimal concentration and percentages for maximizing a reduction in cell viability
Compound 1 Compound 2 Compound 3 Predicted Decrease in % Cell Viability 95% Confidence Interval Lack of Fit Prob > F* Combination Percentage of IC50 Concentration Percentage of IC50 Concentration Percentage of IC50 Concentration 1 DOC, CAB, PIP 33 15 nM 67 27 nM 0 0 µM 45 39, 52 0.7069 2 DOC, CAB, FLAV 0 0 nM 33 13 nM 67 108 nM 52 45, 59 0.5903 3 FLAV, MIT, CAB 55 89 nM 44 176 nM 1 0.4 nM 56 44, 69 0.2957 4 FLAV, PIP, CAB 54 86 nM 0 0 µM 46 18 nM 61 46, 76 0.9568 5 FLAV, PIP, MIT 56 90 nM 0 0 µM 44 175 nM 58 40, 76 0.9961 6 PIP, MIT, CAB 0 0 µM 100 400 nM 0 0 nM 55 35, 75 0.5780 7 RES, FLAV, CAB 0 0 µM 73 117 nM 27 11 nM 56 48, 63 0.8182 8 RES, FLAV, MIT 0 0 µM 0 0 nM 100 400 nM 61 46, 76 0.9841 9 RES, FLAV, PIP 0 0 µM 100 160 nM 0 0 µM 50 36, 65 0.9657 10 RES, MIT, CAB 0 0 µM 100 400 nM 0 0 nM 58 44, 72 0.5081 11 RES, PIP, CAB 0 0 µM 0 0 µM 100 40 nM 54 43, 65 0.4811 12 RES, PIP, MIT 0 0 µM 0 0 µM 100 400 nM 58 44, 73 0.9852 ↵* Values less than or equal to 0.10 indicate that the model does not fit the data.
- TABLE 3
Optimum combinations for minimizing cell population in the G1 phase and maximizing cell populations in the S, G2/M, and sub G1 phases produced by cell cycle analysis
Phase Cabazitaxel Mitoxantrone Flavopiridol % Change in Population 95% Confidence Interval Lack of Fit Prob > F 1 G1 phase 100%, 80 nM 0%, 0 nM 0%, 0 nM (86) (78), (95) 0.0087* 2 S phase 32%, 26 nM 68%, 543 nM 0%, 0 nM 238 208, 268 0.1722 3 G2/M phase 100%, 80 nM 0%, 0 nM 0%, 0 nM 537 469, 606 0.5320 4 Sub G1 phase 0%, 0 nM 48%, 387 nM 52%, 165 nM 499 312, 687 0.7216 ↵* Values less than or equal to 0.10 indicate that the model does not fit the data.
Data Supplement
- Supplemental Tables -
Supplemental Table 1 – Statistics from the Ic50 models shown in figure 2
Supplemental Table 2 – Cabazitaxel Ic50 data
Supplemental Table 3 – Docetaxel
Supplemental Table 4 – Mitoxantrone
Supplemental Table 5 – Flavopiridol
Supplemental Table 6 – Piperlongumine
Supplemental Table 7 – Resveratrol
- Supplemental Tables -


