


Abstract
TRESK (K2P18.1) background K+ channel is a major determinant of the excitability of primary sensory neurons. It has been reported that human TRESK is activated by the protein kinase C (PKC) activator PMA (phorbol 12-myristate 13-acetate) in Xenopus oocytes. In the present study, we investigated the mechanism of this PKC-dependent TRESK regulation. We show that TRESK is activated by coexpression of the novel-type PKC isoforms η and ε. The effect of PKC is not mediated by calcineurin phosphatase, which is known to evoke the calcium-dependent TRESK activation. Mutations of the calcineurin-binding sites in the channel (PQAAAS-AQAP) did not influence the PMA-induced increase of potassium current. In sharp contrast, the mutations of the target residue of calcineurin in TRESK, S264A, and S264E prevented the effect of PMA. The enforced phosphorylation of S264 by coexpression of a microtubule-affinity regulating kinase construct (MARK2Δ) also abolished the PKC-dependent TRESK activation. These results suggest that, in addition to calcineurin, PKC regulates TRESK by changing the phosphorylation status of S264. Coexpression of PKC slowed recovery of the K+ current to the resting state after the calcineurin-dependent dephosphorylation of TRESK. Therefore, the likely mechanism of action is the PKC-dependent inhibition of the kinase responsible for the (re)phosphorylation of the channel at S264. The PKC-dependent dephosphorylation of TRESK protein was also detected by the Phos-tag SDS-PAGE method. In summary, the activation of novel-type PKC results in the slow (indirect) dephosphorylation of TRESK at the regulatory residue S264 in a calcineurin-independent manner.
Introduction
TRESK (Twik-related spinal cord K+ channel) is a member of the K2P background (leak) potassium channel family (Sano et al., 2003; Enyedi and Czirják, 2010). TRESK is highly and selectively expressed in the primary sensory neurons, it contributes to maintenance of the resting membrane potential and the regulation of excitability (Kang and Kim, 2006; Dobler et al., 2007; Tulleuda et al., 2011; Liu et al., 2013). The channel is expressed in a subset of nociceptive neurons, and an accumulating body of evidence indicates that TRESK is a regulator of nociceptive sensation in different experimental models. Accordingly, the TRESK channel has been considered a potential pharmacologic target in the treatment of pain [for review, see Mathie and Veale (2015); Gada and Plant (2019)].
The structure of TRESK subunit corresponds to the general 4 transmembrane segments/2 pore domains (4TMS/2P) topology of K2P channels; however, it is characterized by an exceptionally short intracellular (IC) C terminus and a long IC loop between the second and third TMSs. In addition to the peculiar architectural proportions, TRESK shares low (19%) amino acid sequence identity with the other K2P family members (Sano et al., 2003); accordingly, TRESK constitutes a separate K2P subfamily on its own. Furthermore, there is an unusual divergence between the human and rodent TRESK orthologs; the human channel shows only 67% amino acid identity with mouse TRESK (Czirják et al., 2004). Therefore, data from rodent experimental models should be extrapolated to human TRESK only with caution.
We previously described the unique mechanism of calcium-dependent TRESK activation, which is exceptional within the K2P family (Czirják et al., 2004). Both human and mouse TRESK channels are activated several-fold by dephosphorylation via the calcium/calmodulin-dependent protein phosphatase calcineurin in Xenopus oocytes. This substantial activation can be detected in human embryonic kidney cell line 293 (HEK-293) cells under special whole-cell patch-clamp conditions (Braun et al., 2011). TRESK activation by stimulation of Gq protein-coupled calcium-mobilizing receptors was also reported in isolated primary sensory neurons (Kang et al., 2008; Kollert et al., 2015). Human TRESK contains two binding motifs for calcineurin in its long IC loop, PQIIIS, and LQLP (Czirják and Enyedi, 2006a, 2014). The direct interaction with calcineurin is apparently conserved in mammalian TRESK channels, whereas the IC loop also harbors an even more ancient regulatory sequence, the binding motif for 14-3-3 adaptor protein, which is conserved from fish to human (Czirják et al., 2008; Enyedi et al., 2012). Recently, a further anionic phospholipid binding motif of human TRESK was reported, which is absent in the rodent orthologs (Giblin et al., 2019).
Calcineurin dephosphorylates two major regulatory regions in TRESK (Czirják and Enyedi, 2010). One is the aforementioned 14-3-3-binding motif RSNSCPE. The S252 (underlined) residue of this sequence controls the phosphorylation-dependent association of 14-3-3 adaptor protein with TRESK (Czirják et al., 2008). The other major regulatory sequence dephosphorylated by calcineurin is a cluster of three adjacent serine residues— S262, S264, and S267—in the RLSYSIISNLD sequence of human TRESK. The regulatory regions are phosphorylated by different TRESK-inhibitory kinases, the S252 residue of the 14-3-3-binding site by protein kinase A (PKA), whereas the S262-267 serine cluster by microtubule affinity–regulating kinases, MARKs (Braun et al., 2011).
Human TRESK current is activated several-fold by the application of the nonselective PKC activator phorbol 12-myristate 13-acetate (PMA, 100 nM) in Xenopus oocytes (Rahm et al., 2012). Three different PKC inhibitors reduced the activation of TRESK evoked by PMA, indicating that PKC indeed mediated the effect. Thymeleatoxin, the activator of conventional PKC isoforms, did not activate TRESK, thus excluding the role of conventional PKC enzymes in the regulatory mechanism [for a review of PKC isoforms, see Steinberg (2008)]. Since cyclosporine A (CsA), an inhibitor of calcineurin, did not affect the PKC-dependent TRESK activation, it was concluded that PKC does not act via this phosphatase. The mutations of the eight putative consensus PKC sites in human TRESK did not interfere with the effect of PMA, suggesting that activation of the K+ current was not caused by the direct phosphorylation of TRESK protein by PKC. It has been proposed that TRESK is activated by PKC via a novel mechanism, independent of the calcineurin pathway (Rahm et al., 2012). Since the activation by novel-type PKC represents a new regulatory mechanism of TRESK, we embarked on the investigation of the interaction between TRESK and PKC by using pharmacologic and molecular biologic methods.
Materials and Methods
Plasmid Constructs.
The cloning of human TRESK (K2P18.1) was previously described (Czirják et al., 2004). Novel-type PKC isoforms η and ε were amplified by polymerase chain reaction (PCR) using Pfu polymerase (Thermo Scientific, Waltham, MA) after the reverse transcription (RevertAid Reverse Transcriptase; Thermo Scientific) of total RNA purified from mouse brain with TRIzol reagent (Invitrogen, Carlsbad, CA). The sense and antisense primers were 5′ CAGGAATTCGCCGCCACCATGTCGTCCGGCACGATGAAGTTC 3′ and 5′ GCGCTCGAGCTTTGGTTCTGACTCCCCATAAG 3′ for PKCη and 5′ GCGCCTAAGGCCGCCACCATGGTAGTGTTCAATGGCCTTCTTAAG 3′ and 5′ GCGCTCGAGCTCCCTCCATCCGAAGCAGC 3′ for PKCε, respectively. PKCη product was cloned to pXEN vector (GenBank EU267939.1) at EcoRI-XhoI sites, whereas PKCε at Eco81I-XhoI. Different mutant versions of TRESK and PKC were produced with QuikChange site-directed mutagenesis kit (Stratagene, La Jolla, CA) according to the manufacturer’s instructions. The cloning of isoform 2 of mouse MARK2 kinase was previously described (Braun et al., 2011). MARK2Δ was produced by truncating this kinase with PCR at residue 361 using the antisense primer 5′ CGCGCAAGCTTTCAAAGGAGCAGATAGGTAGCC 3′ and the PCR product was cloned to pXEN vector by taking advantage of the Hind III restriction enzyme site of the primer.
For efficient detection of TRESK protein using Western blot, two influenza hemagglutinin epitope tags [double hemagglutinin (HA) tag] were incorporated into the channel. The MEVSGHP N terminus of wild-type TRESK was modified to MEVSG-(YPYDVPDYA)-GG-(YPYDVPDYA)-GHP, where the epitope tag sequences are in brackets. In the HA2-N70Q-hTRESK constructs used for Western blot, the N70Q mutation was also introduced to disrupt the N-glycosylation site (Egenberger et al., 2010). This mutation changed the apparent molecular weight to the value expected based on amino acid sequence on conventional SDS-PAGE gels.
Maintenance of Xenopus laevis and Oocyte Microinjection.
Xenopus oocytes were prepared, and the cRNA was synthesized and microinjected as previously described (Czirják et al., 2004). Typically, 0.3–2.5 ng of cRNA was microinjected per oocyte to obtain appropriate expression, except the N70Q mutant TRESK constructs, where about 10-fold higher amounts of cRNA were required for suitable expression levels of the N-glycosylation-defective channels. Fifteen frogs were used for the experiments. The animals were maintained in two 50-liter tanks, with continuous filtering and water circulation through aquarium pumps at 19°C in an air- conditioned room. The frogs were anesthetized with 0.1% tricaine solution and sacrificed by decerebration and pithing. All treatments of the animals were conducted in accordance with state laws, institutional regulations, and National Institutes of Health guidelines. The experiments were approved by the Animal Care and Ethics Committee of Semmelweis University (approval ID: XIV-I-001/2154-4/2012).
Two-Electrode Voltage-Clamp Measurements.
Two-electrode voltage-clamp experiments were performed 3 or 4 days after the microinjection of cRNA, as previously described (Czirják et al., 2004). Low [K+] solution contained (in millimolars): NaCl, 95.4; KCl 2, CaCl2 1.8; HEPES 5 (pH 7.5 adjusted with NaOH). High [K+] solution contained 80 mM K+ (78 mM Na+ of the low [K+] solution was replaced with K+). Background K+ currents were measured at the end of 300-millisecond voltage steps to −100 mV applied in every 4 seconds. In several experiments, TRESK currents of the same cell were measured twice. The oocyte was removed from the recording chamber between the measurements and incubated in 0.1- to 0.2-ml solution (containing phorbol esters). In some experiments, the cells were also microinjected after the first measurement with 50 nl EGTA (50 mM) plus HEPES (50 mM, pH 7.3, adjusted with KOH) solution. The injected 50-nl volume was diluted about 10-fold in the cytoplasm of the oocyte.
Separation of Differently Phosphorylated TRESK Proteins by Phos-Tag SDS-PAGE and Detection by Anti-HA Immunoblot.
The plasma membrane fraction was prepared from the oocytes on day 3 after the microinjection of HA2-N70Q-hTRESK cRNA. Before homogenization, cells were stimulated with PMA (100 nM) in the low [K+] recording solution for 45 minutes (see preceding section) in the presence of inhibitors of calcineurin, cyclosporine A (1 μM), and FK506 (1 μM) or incubated as a negative control without PMA under the same conditions. Other cells were stimulated with ionomycin (1 μM) for 3 minutes in the absence of calcineurin inhibitors as a positive control for dephosphorylation.
The oocytes were homogenized in 1 ml of ice-cold lysis solution containing HEPES (20 mM), imidazole (40 mM), NaF (40 mM), EDTA (10 mM), Na-orthovanadate (1 mM), phenylmethylsulfonyl fluoride (1 mM), benzamidine (1 mM), leupeptine (5 μg/ml), phosphatase inhibitor cocktail 1 (1%, P2850; Sigma, St. Louis, MO), pH 7.9, adjusted with NaOH, with 20 strokes in a glass Potter homogenizer on ice (typically 10–30 cells per milliliter). The homogenates were centrifuged at 1000g for 10 minutes at 4°C, and the supernatant without the floating lipid layer was centrifuged again at 1000g for 10 minutes at 4°C. Finally, the supernatant was centrifuged at 16,000g for 10 minutes at 4°C, the membrane pellet was dissolved in 40–80 μl of SDS loading buffer containing Tris (0.31 M, pH 6.8, with HCl), SDS (10%), glycerol (50%), mercaptoethanol (25%), and bromphenol blue (0.2%) and stored at −80°C.
Differently phosphorylated TRESK proteins were separated by Zn2+-Phos-tag SDS-PAGE (8% polyacrylamide gel) using the neutral-pH buffer system according to the instructions of the manufacturer (Wako Pure Chemical Industries, Osaka, Japan). The concentration of Phos-tag was 15 μM in each experiment, and three times higher molar concentration of ZnCl2 was applied in the gels. The stacking and separating gels also contained 0.1% SDS. The samples (5–10 μl membrane preparation per lane) were supplemented with ZnCl2 and NaOH (1 μl of 25 mM ZnCl2 and 1 μl 40 mM NaOH to 5 μl sample) to saturate EDTA and restore alkaline pH. Electrophoresis was performed at 50 V. Before blotting to nitrocellulose membrane (Schleicher and Schuell, Keene, NH), the gel was extensively washed in methanol-free Towbin transfer buffer (25 mM Tris, 192 mM glycine, pH 8.6 ± 0.2) to remove Zn2+. In the first six washes (20 ml for 10 minutes each), the buffer was supplemented with 10 mM EDTA, whereas the seventh wash was without EDTA. The transfer (tank blotting) was performed overnight at 50 V in Towbin buffer containing 20% methanol and 0.05% SDS.
The nonspecific binding sites of the membrane were blocked with 0.2 g/10 ml bovine serum albumin, 0.5 g/10 ml nonfat dry milk, and 0.2% Tween-20 in PBS (phosphate-buffered saline). The primary antibody (mouse monoclonal anti-HA IgG1, 26183, Clone 2–2.2.14, diluted 10,000×; Thermo Scientific) was applied for 2 hours at room temperature in PBS containing 10% blocking buffer. The secondary antibody (goat-anti-mouse IgG (H + L), horseradish peroxidase conjugate, R-05071-500; Advansta, Menlo Park, CA) was applied for 1 hour under conditions similar to those of the first one. The membrane was washed once after the blocking phase and four to six times for 5–10 minutes in 20–30 ml of PBS containing 0.1% Tween-20 after the antibodies. The bands were visualized by the enhanced chemiluminescence detection method (WesternBright ECL HRP; Advansta) according to the manufacturer’s instructions.
Data and Statistical Analysis.
Data are expressed as mean ± S.E. The statistical difference was considered significant at P < 0.05. Normality of data distribution was estimated by the Shapiro-Wilk test and the homogeneity of variance by the Levene test. If the Shapiro-Wilk test showed significance in any groups, then the nonparametric Mann-Whitney U test was used (with Bonferroni’s correction when required for a low number of comparisons in the same experiment). If the Levene test resulted in significance, then the heteroscedastic (Welch-Satterthwaite corrected) t test was used for two groups, or Welch’s analysis of variance (ANOVA), followed by Games-Howell post hoc test for multiple comparisons, was used. Otherwise, Student’s t test or one-way ANOVA, followed by Tukey HSD post hoc test, was applied. In two cases, Wilcoxon matched-pairs test and multivariate analysis of variance (MANOVA), followed by Tukey HSD post hoc test, were used. Statistical calculations were performed in Statistica 13.4 (TIBCO Software, Tulsa, OK) or SPSS Statistics 25.0 (IBM Corporation). Analysis of densitometry data was performed with ImageJ 1.47v software written by Wayne Rasband (Research Services Branch, NIH, Bethesda, MD).
Materials.
Chemicals of analytical grade were purchased from Sigma, Fluka (Milwaukee, WI), Enzo Life Sciences (Farmingdale, NY), Santa Cruz Biotechnology (Dallas, TX), or Merck (Whitehouse Station, NJ). Enzymes and kits for molecular biology applications were purchased from Ambion (Austin, TX), Thermo Scientific, New England Biolabs (Beverly, MA), and Stratagene. Phorbol 12-myristate 13-acetate (PMA), 4-α-phorbol-12-myristate-13-acetate (4α-PMA), and 4α-phorbol 12,13-didecanoate (4α-PDD) were prepared as stock solutions in ethanol or DMSO (0.5 mM), and ionomycin (calcium salt) at a concentration of 5 mM in DMSO. These stock solutions were stored at −20°C and diluted further before measurement. Phos-tag acrylamide was purchased from NARD Institute, Wako Pure Chemical Industries.
Results
Mutations of Serine 264 Prevent TRESK Activation by PMA.
To investigate the relationship between the mechanisms of TRESK activation by PKC and calcineurin, we analyzed the effect of PMA on different mutant channels with defective calcineurin-dependent regulation. The background K+ current was estimated at −100 mV by transiently changing the extracellular (EC) [K+] from 2 to 80 mM using the two-electrode voltage clamp method. Human TRESK current was measured twice in the same Xenopus oocyte, before and after the application of PMA (100 nM), for 42–46 minutes (see Fig. 1A for representative recordings). Wild-type TRESK was activated about 6-fold by PMA in this cell preparation (Fig. 1B, wt column).

PMA-induced activation of human TRESK is prevented by the S264A and S264E, but not by the S252A and PQAAAS-AQAP, mutations of the channel. (A) Representative K+ currents were measured in Xenopus oocytes expressing wild-type (upper), PQAAAS-AQAP (middle), or S264A mutant (lower) human TRESK, before (left) and after the application of PMA (100 nM) for 42–46 minutes (right recordings). TRESK current was measured as the difference of inward currents at −100 mV, when EC [K+] was transiently changed from 2–80 mM, as indicated above the upper left curve. This protocol and the scale bars apply to all recordings. (B) Relative activation of TRESK current by PMA was calculated from the same experiment as illustrated in (A). The number of cells is indicated in the columns. (C) Wild-type, S264E, and S252A mutant TRESK were tested in a similar experiment as introduced in (A and B), in a different oocyte preparation. Note that the S264E mutation, similarly to S264A, completely prevented TRESK activation by PMA. *P < 0.01; ***P < 0.0005, Welch’s ANOVA followed by Games-Howell test; ns, not significant; wt, wild type.
The mutations of both calcineurin-binding motifs of human TRESK, PQIIIS to PQAAAS and LQLP to AQAP, prevent binding of the phosphatase to the channel and thus eliminate the calcium-dependent regulation of TRESK (Czirják and Enyedi, 2014). This PQAAAS-AQAP mutant was similarly activated by PMA treatment as the wild-type channel (Fig. 1, A and B), suggesting that the effect of PKC is not mediated by the activation of calcineurin. In sharp contrast, the S264A mutant, mimicking the dephosphorylated (active) state of the channel at the most important regulatory site targeted by calcineurin, was completely unresponsive to PMA (Fig. 1, A and B). This finding indicates that the channel lacking the inhibitory phosphorylation at residue 264 cannot be further activated by PKC. (In this experiment, a smaller amount of cRNA of the constitutively active S264A mutant was microinjected than that of the wild-type channel, to avoid high background K+ conductance toxic for the oocytes and obtain similar basal current amplitudes in the two groups. The basal currents in the S264A group were in the 1.3–7.2 μA range, and the K+ current was not activated by PMA in any of these cells.)
Glutamate substitution in the S264E mutant imitates the negative charge of phosphoserine and restrains TRESK in a state that cannot be modified by phosphorylation at this location. The S264E mutant was not activated by PMA, confirming that the action of PKC becomes compromised if the phosphorylation-dependent channel regulation at position 264 is precluded. In this cell preparation, wild-type TRESK was activated by PMA by about 3-fold on average, and the S264E mutation completely eliminated this activation (Fig. 1C). The mutation of the other main regulatory site important in the calcineurin-dependent activation and 14-3-3-binding, S252A, did not interfere with the effect of PMA (Fig. 1C).
Application of Ionomycin after PMA Treatment Activates TRESK to the Same Degree as Administration of Ionomycin Alone.
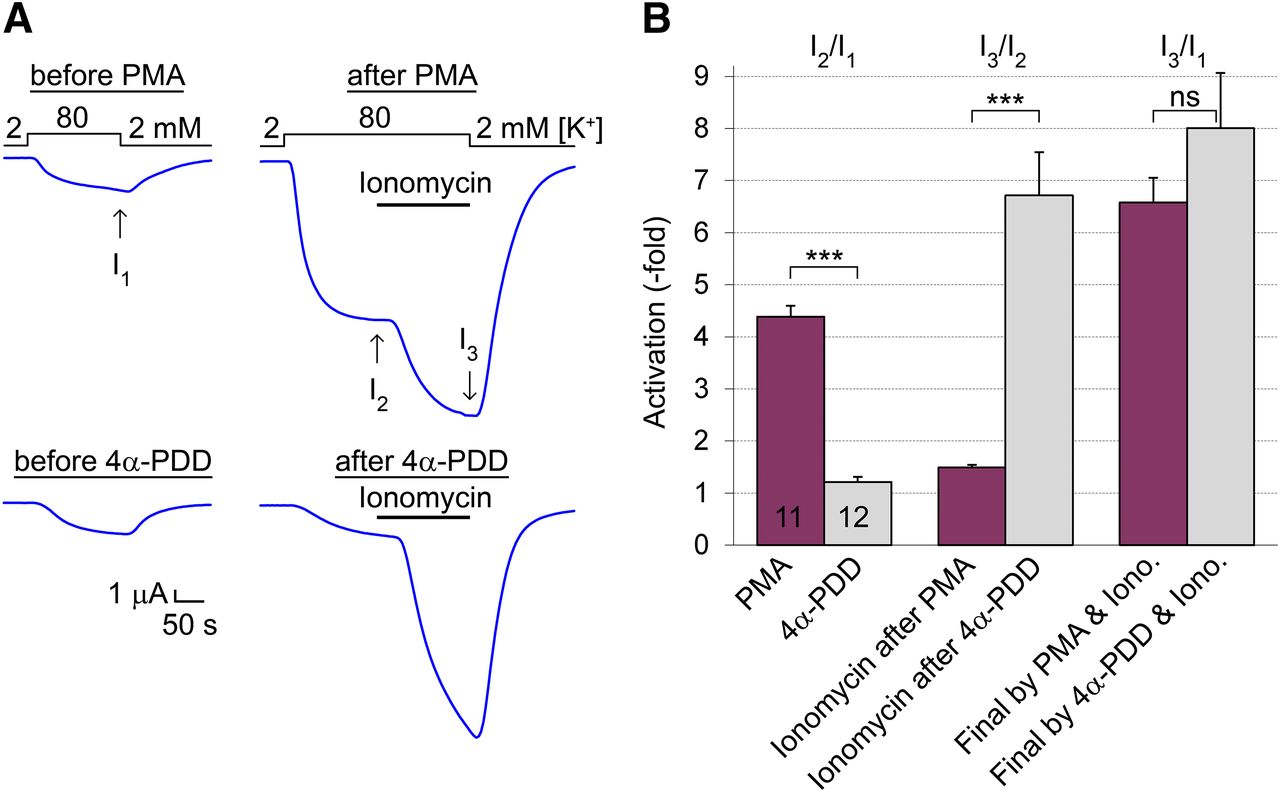
We examined whether successive stimulation of PKC (by PMA) and calcineurin (by the calcium ionophore ionomycin) results in a higher activation of TRESK than that evoked by only calcineurin or whether these treatments produce the same final activity level. If the effect of PMA depends on the phosphorylation state of S264, then the degree of activation by PMA + ionomycin should not exceed the effect of ionomycin. Calcineurin efficiently dephosphorylates S264 in response to ionomycin, irrespective of the initial effect of PMA on this residue. Ionomycin activates TRESK maximally within 3 minutes, and the current recovers to the resting state in about 10–30 minutes (Czirják et al., 2004); however, activation by PMA is much slower, reaching its maximum in about 30–60 minutes (Rahm et al., 2012). Therefore, we first measured basal TRESK current, afterward applied PMA (100 nM) for 44–48 minutes, and finally measured the K+ current again and administered ionomycin (0.5 μM) for 160 seconds (see the upper representative recordings in Fig. 2A). In the control (calcineurin only) group, the cells were treated with 4α-phorbol 12,13-didecanoate (4α-PDD, a phorbol with no effect on PKC) before application of ionomycin (lower representative recordings in Fig. 2A).

Ionomycin activates TRESK to the same degree after PMA and 4α-PDD treatment. (A) Representative TRESK currents were recorded before (left) and after (right) the application of PMA (100 nM, upper curves) or the inactive analog 4α-PDD (100 nM, lower curves) for 44–48 minutes. At the end of the second measurement, ionomycin (0.5 μM) was administered for 160 seconds in 80 mM [K+] as indicated by the horizontal black bar. The basal TRESK current at the beginning of the experiment, the current after the phorbol treatment, and the final current after the application of ionomycin are indicated as I1, I2, and I3, respectively, by the vertical arrows. The small nonspecific leak current measured in 2 mM [K+] was subtracted from the values of I1, I2, and I3 in the calculations. (B) Relative activations of TRESK current by PMA (purple, left pair of columns, I2/I1) or 4α-PDD (gray) were calculated from the same experiment as illustrated in (A). The subsequent activation by ionomycin was estimated by comparing the currents measured before and after application of the ionophore (i.e., after the PMA or 4α-PDD treatment, middle pair of columns, I3/I2). The final activation was calculated by normalizing the current recorded at the end of ionomycin administration to the basal current at the beginning of the experiment (right pair of columns, I3/I1). Note that TRESK current reached the same (about 7-fold) final level of activation when ionomycin was applied after PMA or 4α-PDD pretreatment. ***P < 0.0005 Mann-Whitney U test, also significant after Bonferroni’s correction; ns, not significant.
PMA increased TRESK current more than 4-fold on average in this cell preparation, whereas 4α-PDD had no effect (Fig. 2B, first pair of columns). Subsequent application of ionomycin increased the K+ current of PMA-treated cells further, about 1.5-fold (third column in Fig. 2B), resulting in a 6.6- ± 0.5-fold final activation compared with the basal current level measured at the beginning of the experiment (n = 11, fifth column in Fig. 2B). Ionomycin substantially increased the K+ current of the cells pretreated with 4α-PDD, resulting in an 8.0- ± 1.1-fold final activation (n = 12, sixth column in Fig. 2B). The final activations after ionomycin in the PMA and 4α-PDD groups were not significantly different, indicating that the application of ionomycin after PMA treatment did not result in a higher activity level of TRESK than the administration of the calcium ionophore alone.
Activation of Mouse TRESK by PMA Is Much Weaker than that of the Human Channel.
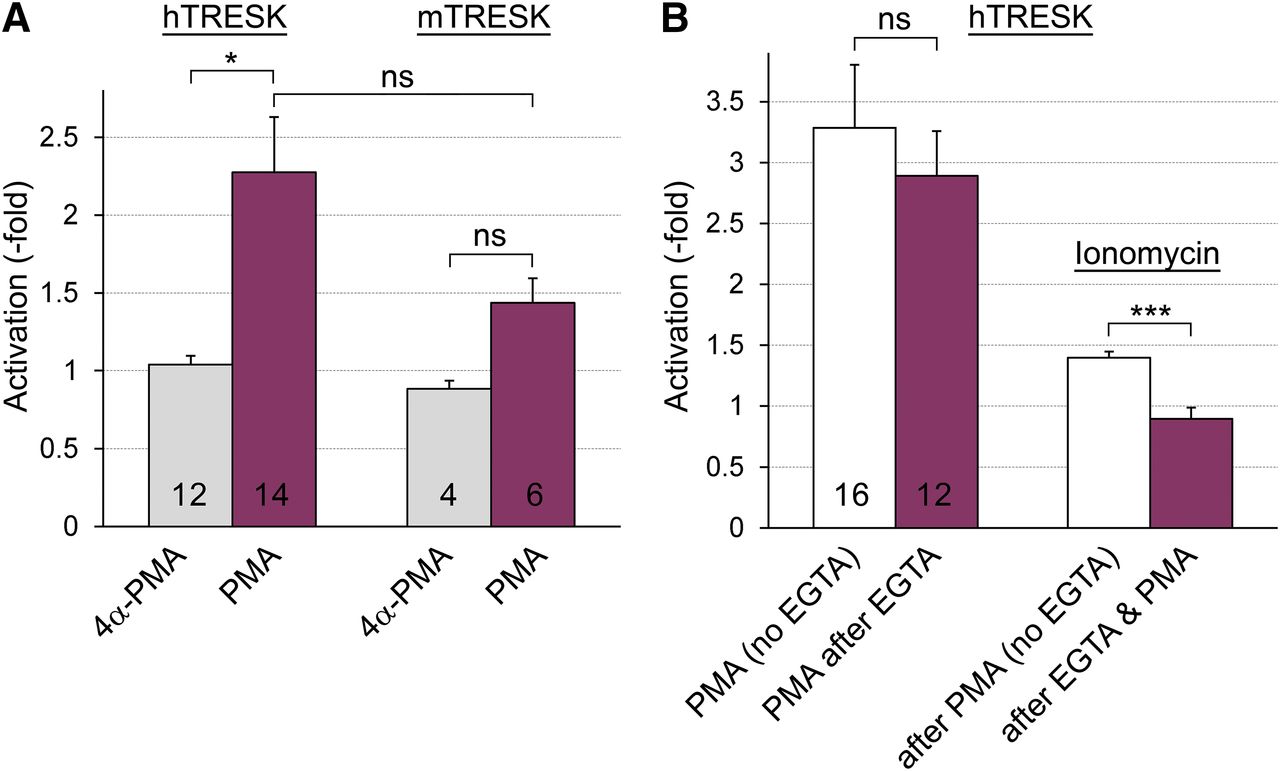
Another phorbol ester with no effect on PKC, and structurally even more similar to PMA than 4α-PDD, has also been examined using the double-measurement protocol introduced in Fig. 1A. Human TRESK current was not influenced by 4α-PMA under conditions when the effect of PMA was clearly detected, further indicating the specificity of PMA for TRESK activation (Fig. 3A). In the same oocyte preparation, 4α-PMA and PMA were also tested on mouse TRESK current. The average activation of the mouse channel by PMA was smaller than that of human TRESK; in fact, it was not significantly different from the negative control 4α-PMA in this experiment (n = 4 vs. 6, Fig. 3A). In another oocyte preparation, PMA activated mouse TRESK 2.1- ± 0.3-fold (n = 6), whereas human TRESK current was increased 3.7- ± 0.7-fold (n = 11). The effect of PMA on mouse TRESK proved statistically significant in the combined data set of the two experiments (P < 0.05, n = 12, Wilcoxon matched-pairs test), suggesting that mouse TRESK was also activated by PKC, although evaluation of its small and variable response required relatively high sample numbers. In the combined data set, after the normalization for the distinct average activation levels of human TRESK in the two experiments, the difference between the activation of the human and mouse channel was statistically significant (P < 0.01, heteroscedastic t test).

The effect of PMA is weak on mouse TRESK, and it is not affected by EGTA microinjection. (A) The K+ currents of Xenopus oocytes expressing human or mouse TRESK were measured before and after the application of PMA (100 nM, for 49–56 minutes) or the inactive analog 4α-PMA (as indicated below the columns, protocol as in Fig. 1A). The current measured after the phorbol treatment was normalized to the basal value, and the averages were plotted in the graph. (B) The relative activations of human TRESK current by PMA and ionomycin were analyzed by using a protocol similarly to that in Fig. 2A. The cells were (purple, PMA after EGTA group) or were not (white, no EGTA group) microinjected with 50 nl of solution containing 50 mM EGTA plus 50 mM HEPES after the first measurement of K+ current, before the application of PMA (100 nM). Note that the microinjection of EGTA did not influence TRESK activation by PMA (left pair of columns). The cells were finally challenged with ionomycin (0.5 μM), and the relative activations (calculated as I3/I2 in Fig. 2A) are shown as the right pair of columns. Note that EGTA prevented TRESK activation by ionomycin (compare the third white with the fourth purple column). *P < 0.05 Welch’s ANOVA followed by Games-Howell test, ***P < 0.0005 Mann-Whitney U test (also significant after Bonferroni’s correction); ns, not significant.
Effect of PMA on Human TRESK Is Not Mediated by Calcineurin.
Regarding the apparent relationship between S264 and the effect of PMA, we aimed to confirm, also by applying the wild-type channel, that the action of PMA is not mediated by calcium and calcineurin. Therefore, we prevented the activation of calcineurin by the IC microinjection of high concentration of the calcium chelator EGTA (50 mM, 50 nl per oocyte, also containing 50 mM HEPES for pH stabilization). After estimation of the basal TRESK current, the cells were or were not injected with EGTA, and subsequently they were treated with PMA. After application of PMA, TRESK current was measured again, and finally all cells were stimulated with ionomycin (protocol as in Fig. 2A). TRESK was similarly activated by PMA after the microinjection of EGTA as in the noninjected cells (Fig. 3B, left pair of columns). The K+ current of the noninjected (no EGTA) cells was further increased about 1.5-fold by ionomycin after the PMA treatment (third white column in Fig. 3B), whereas ionomycin (after PMA) was ineffective in the cells microinjected with EGTA (fourth column in Fig. 3B), indicating that the microinjection of EGTA prevented the action of calcineurin; however, it did not influence TRESK activation by PMA. Thus, the effect of PMA is not mediated by calcineurin.
Coexpression of a MARK2 Construct with TRESK Abrogates the Effect of PMA.
If the activation of PKC indirectly results in slow dephosphorylation of S264, then this effect can be counterbalanced by the overexpression of another kinase phosphorylating this residue. The S262–267 serine cluster of TRESK is specifically phosphorylated by microtubule affinity–regulating kinases (Braun et al., 2011); therefore, we have applied a MARK2 construct (MARK2Δ) to oppose the effect of PMA. To prevent the known inhibition of MARK2 by novel-type PKC (Watkins et al., 2008), the C terminus of the kinase was truncated at residue 361. We followed the protocol introduced in Fig. 2A throughout this experiment: we measured basal TRESK current, applied PMA, measured the current again, and administered ionomycin for final activation. Control cells injected with half amount of TRESK cRNA [TRESK (0.5x) group] were also examined to exclude the influence of the expression levels on the results.
The coexpression of MARK2Δ with TRESK diminished the activation of the K+ current by PMA (light blue and purple columns in Fig. 4A). Whereas TRESK was activated about 3-fold by PMA in both control groups in this cell preparation, MARK2Δ reduced this activation to a negligible level [compare the three purple columns in Fig. 4B, P < 0.001 for comparison of TRESK (2×) + MARK2Δ to either control groups]. However, MARK2Δ did not impede TRESK regulation in general. The final application of ionomycin increased the K+ current in the cells coexpressing MARK2Δ with TRESK similarly to the control groups expressing only the channel (compare the light yellow columns in Fig. 4B). Apparently, MARK2Δ maintained the phosphorylation of S264 against the slow dephosphorylating effect induced by PMA; however, it could not counteract the overwhelming phosphatase activity of calcineurin binding directly to the channel.
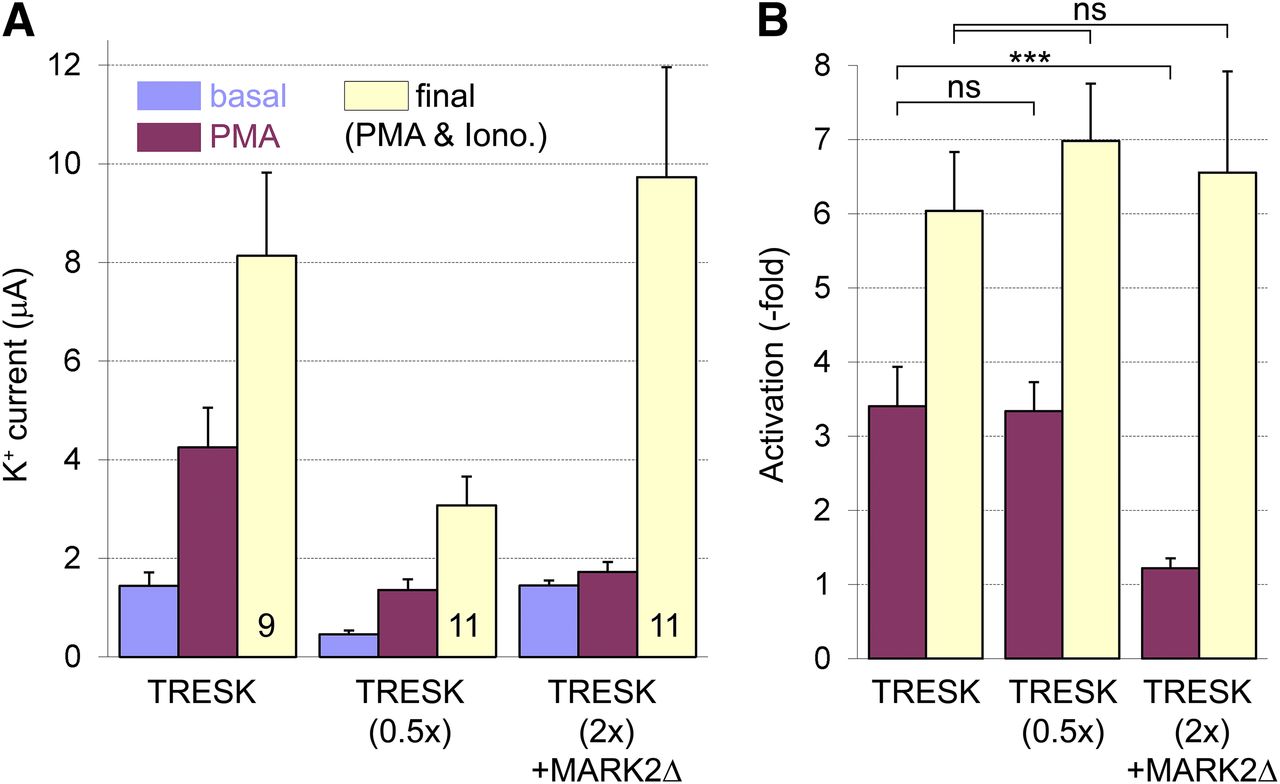
Coexpression of a truncated construct of MARK2 kinase with TRESK prevents activation of the channel by PMA. (A) The average amplitudes of basal TRESK currents, the currents after the application of PMA (100 nM), and the currents after the final administration of ionomycin (light blue, purple, and yellow columns, respectively, as I1, I2, and I3 in Fig. 2A) are represented. Three groups of oocytes expressing human TRESK, injected with half amount of TRESK cRNA, or coexpressing TRESK with MARK2Δ are illustrated (three triads of columns, respectively, as indicated below the triads). (B) Relative activations of TRESK currents by PMA (purple, as I2/I1 in Fig. 2A) and the final activations by ionomycin (0.5 μM) after PMA (yellow, as I3/I1 in Fig. 2A) were calculated for the three groups from the data shown in (A). Note that the activation by PMA was diminished in the presence of MARK2Δ (compare the purple columns); however, the effect of ionomycin was not influenced by the coexpression of the kinase (yellow columns). In this experiment, a double amount of TRESK cRNA was coinjected with MARK2Δ to obtain the same basal K+ current amplitude as in the control (TRESK) group. In a previous similar experiment, when equal amounts of TRESK cRNA were injected, the coexpression of MARK2Δ also prevented the activation of TRESK by PMA, although the basal K+ current was reduced in the cells coexpressing MARK2Δ compared with the control group (not shown). Note that the average K+ current after the application of PMA is in the same range in the TRESK (0.5×) as in the TRESK (2×) + MARK2Δ group, verifying that the degree of TRESK activation by PMA was independent of the current amplitudes in this experiment. ***P < 0.001, MANOVA followed by Tukey HSD test; ns, not significant.
PMA Slows the Return of the Current to the Resting State after Activation by Calcineurin.
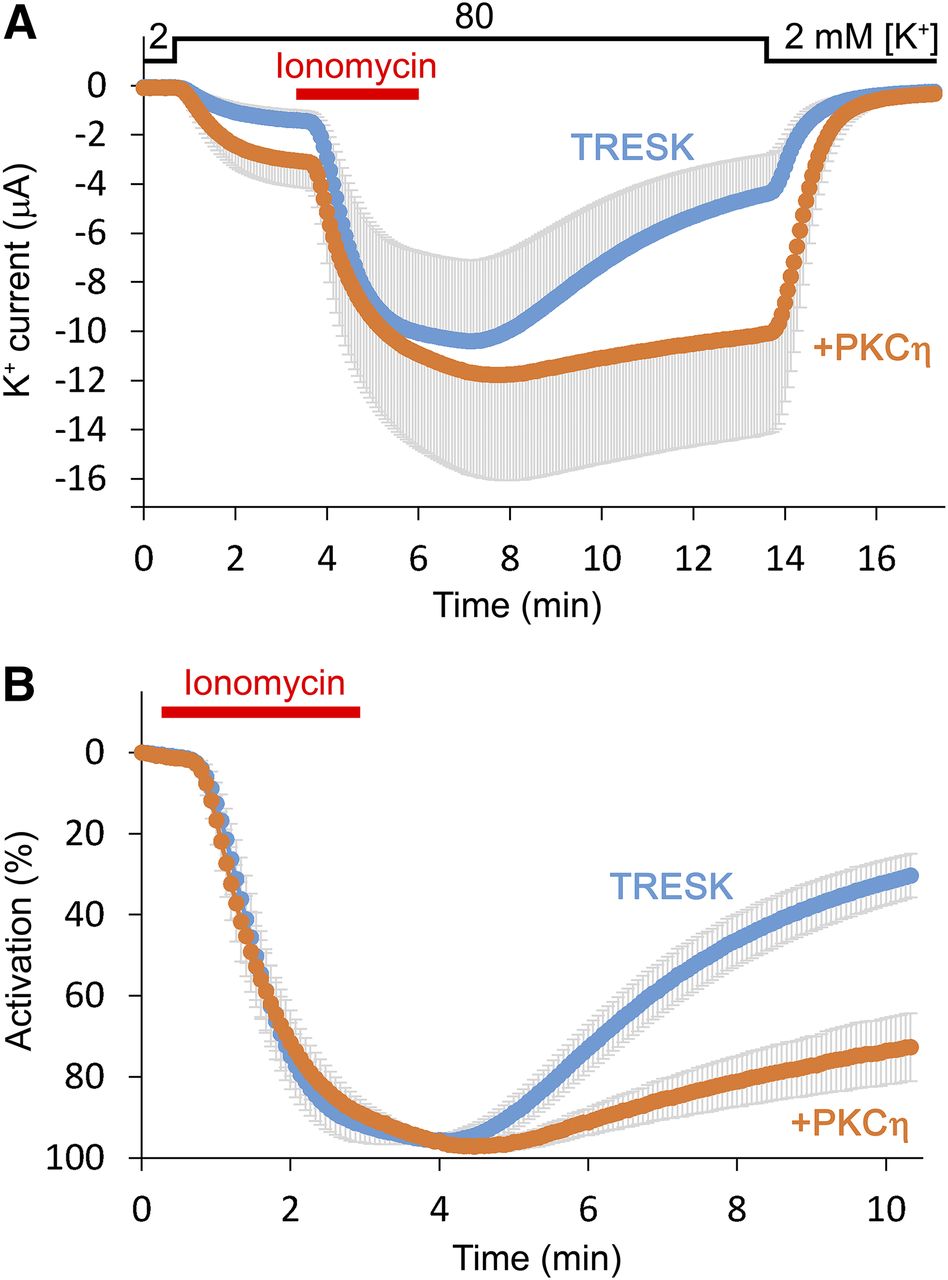
Recovery of the current of dephosphorylated TRESK channels to the resting (inhibited) state after the calcineurin-dependent activation relies on the kinase activity phosphorylating the S262–267 serine cluster. The effect of PMA on this kinase activity was estimated by measuring the recovery rate of TRESK current after ionomycin application. Cells expressing wild-type TRESK were stimulated (red bar in Fig. 5) with ionomycin (0.5 μM) or with the combination of ionomycin plus PMA (100 nM), and the subsequent return of the K+ current to the resting state was compared between the two groups (purple and orange curves in Fig. 5). The peak currents were identical at the end of the stimulation (12.5 ± 1.1 μA in the ionomycin and 11.5 ± 0.8 μA in the ionomycin + PMA groups, n = 5 each). The current recovered toward the resting state at the end of the measurement when only ionomycin had been administered (6.5 ± 0.6 μA); however, the current in the ionomycin + PMA group did not decrease (13.8 ± 1.4 μA, P < 0.002, Student’s t test). When only PMA was applied, TRESK current slowly increased during the measurement (from 1.3 ± 0.2 μA basal value to 4.8 ± 0.7 μA). The reduced current recovery in the ionomycin + PMA group is compatible with the conclusion that the application of PMA resulted in the inhibition of the kinase phosphorylating TRESK.

PMA slows the return of TRESK current to the resting state after the activation by ionomycin. Three groups of oocytes expressing human TRESK were stimulated with ionomycin (0.5 μM), ionomycin (0.5 μM) plus PMA (100 nM), or PMA alone as indicated by the red bar (purple, orange and light blue curves, respectively, n = 5 in each group; S.E. is shown as gray error bars). The currents were measured at the end of 300-millisecond voltage steps to −100 mV applied every 4 seconds in 2 or 80 mM [K+], as indicated above the graph. Note that the application of PMA in addition to ionomycin prevented the recovery of TRESK current toward the resting state (orange curve).
Coexpression of Novel-Type PKC with TRESK Reproduces the Effects of PMA.
Novel-type isoforms PKCη and PKCε have been cloned from mouse brain RNA by reverse-transcription PCR, and their coexpression with TRESK was tested. Whereas the resting current was 1.4 ± 0.4 μA in the group expressing only the channel (n = 7), coexpression of PKCη with TRESK resulted in 3.0 ± 1.0 μA average current (n = 5). The difference was not statistically significant owing to the large variation of channel expression in this experiment (compare the light blue with the orange curve in Fig. 6A at the time point before the application of ionomycin). Nevertheless, TRESK was activated more strongly by ionomycin in the control cells expressing only the channel (7.3- ± 0.3-fold) than in the cells coexpressing PKCη (4.2- ± 0.7-fold, P < 0.001, Student’s t test). The reduced apparent activation in the PKCη group in response to ionomycin suggests that TRESK was activated by the coexpression of PKCη under basal conditions. Recovery from the calcineurin-mediated activation was also strikingly different between the two groups. The activation recovered to 30% ± 5% of its maximal value in the control group at the end of the measurement, whereas it remained as high as 73% ± 8% in the PKCη group (Fig. 6B, P < 0.001, Student’s t test). This result indicates that the rate of inhibitory rephosphorylation of TRESK was drastically reduced by PKCη.
Coexpression of novel-type PKC with TRESK slows recovery of the current from the activation induced by ionomycin. (A) The average K+ currents of Xenopus oocytes expressing human TRESK (light blue, n = 7) or coexpressing the channel with PKCη (PKCη, orange, n = 5) are plotted. Cells were stimulated with ionomycin (0.5 μM), as indicated by the red bar. Afterward, the return of the current to the resting state was recorded for a long period in 80 mM EC [K+]. [K+] changes are shown above the graph. Only plus or minus error bars (gray, S.E.) are shown. (B) Activation of the same currents as in (A) was plotted as percentage values. The K+ current measured before the application of ionomycin was normalized to 0% activation, whereas the maximum current amplitude to 100%. The major part of the variation of data in (A) was caused by the different channel expression in the oocytes, and recovery from activation was rather uniform within the groups (see gray error bars). Note that recovery from the activated state was significantly slowed in the presence of PKCη.
The preceding observations were also reproduced by applying wild-type PKCε and human TRESK-S252A mutant (curves not shown). The S252A mutation of the 14-3-3-binding site did not interfere with the mechanism of action of novel-type PKC; that is, the effects were maintained when only one of the two main regulatory regions, the S262–267 cluster, was intact. Compared with the TRESK-S252A only group, coexpression of PKCε increased the average basal TRESK current from 1.2 ± 0.2 (n = 5) to 3.6 ± 1.0 µA (n = 7, not significant). PKCε reduced the apparent activation by ionomycin from 5.1- ± 0.6-fold to 2.5- ± 0.2-fold (P < 0.05) and increased the remaining activation at the end of the measurement from 28% ± 6% to 63% ± 8% (i.e., it reduced the rate of recovery, P < 0.01, ANOVA followed by Tukey HSD test). In the same experiment, coexpression of the K437R kinase dead mutant version of PKCε (Uberall et al., 1997) did not evoke any of these effects (n = 7 oocytes), indicating that the kinase activity of PKCε was required for the regulation of TRESK current.
MARK2Δ Counterbalances the Effects of PKCε on TRESK Activation and Recovery Rate.
To enhance the effect of PKCε on TRESK, we coexpressed the A159E mutant constitutively active version of the kinase (PKCε-CA) with the channel (Uberall et al., 1997). In this group, the basal background K+ current was 6.5 ± 1.2 μA (n = 10, see the orange PKCε-CA average curve in Fig. 7). The additional coexpression of MARK2Δ (i.e., triple coexpression: TRESK + PKCε-CA + MARK2Δ) reduced the basal current to 2.6 ± 0.3 μA (n = 9, P < 0.01, heteroscedastic t test, blue PKCε-CA+MARK2Δ curve in Fig. 7). Ionomycin caused little activation in the PKCε-CA group (1.5- ± 0.1-fold, measured at the end of ionomycin application); however, the relative activation in response to ionomycin was substantially larger in cells also coexpressing MARK2Δ (3.2 ± 0.3-fold, P < 0.002, heteroscedastic t test). The maximum currents evoked by ionomycin were identical in the two groups (Fig. 7). These data clearly indicate that MARK2Δ efficiently counterbalanced the activation of basal TRESK current by PKCε-CA.

MARK2Δ restores the basal inhibition of TRESK in the presence of PKCε and accelerates the recovery of the K+ current to the resting state after ionomycin. The average K+ currents of Xenopus oocytes coexpressing human TRESK with the constitutively active A159E mutant PKCε (PKCε-CA, orange, n = 10), or coexpressing the channel with PKCε-CA and MARK2Δ (triple coexpression, PKCε-CA + MARK2Δ, blue, n = 9) are plotted. Cells were stimulated with ionomycin (0.5 μM), as indicated by the red bar. The method of representation is similar to that in Fig. 6A. Note the reduced basal TRESK current in the presence of MARK2Δ and the identical peak currents in the two groups. The recovery to the resting state after ionomycin was accelerated in the cells also coexpressing MARK2Δ compared with the group coexpressing only PKCε-CA and TRESK.
Recovery to the resting state after the calcium-dependent activation was also significantly different between the two groups. In the PKCε-CA group, TRESK current did not recover after the washout of ionomycin; the activity level reached 154% ± 25% at the end of the measuremen if the degree of activation at withdrawal of ionomycin was taken as 100%. In sharp contrast, MARK2Δ induced complete recovery to the resting state after the withdrawal of ionomycin (9% ± 5% remaining activation of TRESK current at the end of the measurement, P < 0.0005, Mann-Whitney U test, Fig. 7), which indicates that MARK2Δ restored the phosphorylation of S264 when the endogenous kinase activity for this reaction was inhibited by PKCε-CA.
Treatment of Cells with PMA Results in the Dephosphorylation of TRESK Protein.
We used the Phos-tag SDS-PAGE method to analyze the phosphorylation state of TRESK in the plasma membrane preparations from Xenopus oocytes. The N70Q mutation was introduced to prevent N-glycosylation and reduce the consequent molecular weight heterogeneity of the channel subunit. An N-terminal double-HA (human influenza hemagglutinin) tag was inserted to provide sufficient signal intensity in Western blots after Phos-tag SDS-PAGE. The Phos-tag method was suitable for the investigation of TRESK dephosphorylation; however, it was also characterized by some initially unexpected anomalies.
As the control group for phosphorylated TRESK, the oocytes were incubated in the presence of cyclosporine A (1 μM) and FK506 (1 μM) calcineurin inhibitors for 45 minutes. TRESK protein prepared from these cells, corresponding to the resting phosphorylation and inhibited state of the channel, was visible as two faint bands in the Western blot image of Phos-tag gels (CsA + FK506, lane 2, Fig. 8A). If the same amount of TRESK protein, isolated from the same number of oocytes of the same cell preparation, was in vitro dephosphorylated with λ phosphatase, then a very intense lower band was observed (λ phosphatase, lane 5, Fig. 8A). This finding indicates that the upper band corresponded to phosphorylated TRESK in lane 2, and its mobility was really reduced compared with the dephosphorylated channel, as described by the manufacturer in the user’s manual of Phos-tag. Nevertheless, it is inevitable to conclude that phosphorylated TRESK was detected much less efficiently by the method than the dephosphorylated channel protein. The major amount of phosphorylated TRESK remained invisible in the CsA + FK506 group in lane 2. It is possible to evaluate further data correctly only if this result is accepted.

Dephosphorylation of TRESK protein in response to PMA treatment of the cells is demonstrated by Phos-tag SDS-PAGE, followed by anti-HA immunoblot. (A1–A3) The oocytes expressing N70Q mutant, double HA-tagged human TRESK were incubated with CsA (1 μM) plus FK506 (1 μM) for 45 minutes (lane 2), with ionomycin (1 μM) for 3 minutes (lane 3), or with PMA (100 nM) for 45 minutes in the presence of CsA + FK506 (lane 4). The plasma membrane proteins from another group of oocytes treated with CsA + FK506 (as in lane 2) were in vitro dephosphorylated with λ phosphatase (lane 5). Noninjected cells, treated with CsA + FK506 (non-inj.), were applied as a control for the specificity of the anti-HA Western blot (lane 1). The proteins of the plasma membrane preparation from all groups of these cells were analyzed on 8% SDS-PAGE gels containing 15 μM Phos-tag reagent and 45 μM Zn2+, using the neutral (Tris-MOPS) buffer system. Dephosphorylated TRESK is indicated with an asterisk (*), the region of phosphorylated TRESK proteins with a double asterisk (**), whereas dimeric TRESK with a hash (#). The phosphorylation status of TRESK was examined in three independent representative experiments, and in each experiment, five groups of equal numbers of Xenopus oocytes were used (n = 11, 34, and 26 for each group, in (A1–A3), respectively). Lanes 3 and 4 were loaded in reverse order in (A1). (B1–B3) The same samples as in (A1–A3), respectively, were run on conventional SDS-PAGE gels without Phos-tag and visualized by anti-HA Western blot to compare the amounts of total (phosphorylated + dephosphorylated) TRESK protein. Numbering of the lanes corresponds to the samples in (A1–A3). In (B2a and B2b), the image of the same blotting membrane is shown with a longer and shorter exposition time, respectively. In (B1 and B3), the Tris-MOPS buffer system was used for the SDS-PAGE; in the (B2), the Tris-Gly system.
In addition to the in vitro λ phosphatase reaction, another positive control for TRESK dephosphorylation in the living cell was also applied. The same number of oocytes as in the CsA+FK506 control group were incubated with ionomycin (1 µM) for 3 minutes in the absence of calcineurin inhibitors. After dephosphorylation of TRESK by calcineurin, a prominent lower band was detected in the Phos-tag gels of all three representative experiments (ionomycin, lane 3, Fig. 8A). The band was shifted to the dephosphorylated position, and it became more intense than that in the CsA+FK506 group (compare lane 3 with lane 2). Comparisons of the CsA + FK506, λ phosphatase and ionomycin control groups indicate that TRESK dephosphorylation is manifested as a high-intensity lower band, which represents the well detectable fraction of the protein in Phos-tag gels. It is feasible to compare TRESK dephosphorylation in two samples based on the intensity of the lower bands if these samples contain equal amounts of total TRESK protein, which is to be determined by conventional (No Phos-tag) SDS-PAGE followed by Western blot (Fig. 8B).
The effect of PMA on the phosphorylation status of TRESK was examined by applying the above-described principles. The same number of oocytes as in the CsA + FK506 group were incubated with PMA (100 nM) for 45 minutes in the presence of CsA (1 μM) and FK506 (1 μM). The total amount of TRESK protein in the plasma membrane fraction of the oocytes has not been changed by the PMA treatment (compare lane 2 with lane 4 in Fig. 8B). In the second representative experiment, a very short exposition of the film is also shown to illustrate the precisely equal amounts of total TRESK protein in these samples Fig. 8B. When the same samples were tested in Phos-tag gels, the lower band was always more intense in the PMA group than in the control cells (compare lane 2 with lane 4 in Fig. 8A). Altogether we performed this experiment five times and analyzed the data by densitometry. After the subtraction of the background density counts, the data were normalized to the maximum dephosphorylation induced by ionomycin in each of the five independent experiments corresponding to distinct oocyte preparations. The intensity of the dephosphorylated TRESK band was increased by PMA in all five cases. The normalized densities in the two groups were statistically different (P < 0.01, Mann-Whitney U test), unequivocally indicating that TRESK protein was dephosphorylated in response to the treatment of the cells with PMA.
In the PMA-treated group, another band also appeared in the phosphorylated protein range. Although it may not change the above conclusion about the dephosphorylation of TRESK in response to PMA, it is natural to ask questions about the origin of this band. This band is present in all the representative Western blot images with variable intensity; it is most prominent in lane 4 in Fig. 8A2. Its position is slightly different from that of the upper band in lane 2, suggesting that it corresponds to a phosphorylated form of TRESK, which arises only in the PMA-treated cells, and it is characterized by higher detection efficiency than the phosphorylated protein of the CsA+FK506 group. These data are consistent with the hypothesis that TRESK is phosphorylated at one (or more) of its putative consensus PKC sites, in addition to the indirect dephosphorylation of its regulatory region, which gives rise to the additional band.
Discussion
TRESK (K2P18.1, KCNK18) background K+ channel contributes to the stabilization of the resting membrane potential of sensory neurons in the dorsal root and trigeminal ganglia (Kang and Kim, 2006; Dobler et al., 2007). It is expressed in the nonpeptidergic NP1 and NP2 classes of polymodal nociceptors categorized by the markers Mas-related G-protein-coupled receptor D and A3 (Mrgprd and Mrgpra3), respectively. It is also present in the low threshold mechanoreceptor, neurofilament heavy chain (Nefh) positive, NF1 subpopulation of myelinated neurons characterized by NECAB2, the N-terminal EF-hand calcium binding protein 2 (Usoskin et al., 2015; LaPaglia et al., 2018). Furthermore, TRESK mRNA was detected in the mouse autonomic nervous system, in the sensory and motor neurons of the nodose and superior cervical ganglions, respectively (Cadaveira-Mosquera et al., 2012), and in the mouse retina (Hughes et al., 2017).
A certain frameshift mutation of TRESK was found to be linked to familiar migraine and the function of the channel was also related to pain sensation in different rodent experimental models (Lafrenière et al., 2010; Tulleuda et al., 2011; Liu et al., 2013; Zhou et al., 2013; Guo and Cao, 2014; Yang et al., 2018). Recently, it has been suggested that the frameshift-induced alternative translation initiation and the dominant negative effect of the truncated TRESK subunit on TREK-1 and TREK-2 channels are responsible for migraine pathogenesis (Royal et al., 2019). Although a highly selective TRESK inhibitor is not yet available, great efforts have been made to identify pharmacological compounds modulating this putative drug target (Czirják and Enyedi, 2006b; Bautista et al., 2008; Kang et al., 2008; Beltrán et al., 2013; Kim et al., 2013; Wright et al., 2013; Monteillier et al., 2016; Park et al., 2016; Veale and Mathie, 2016; Castellanos et al., 2018; Park et al., 2018).
IC signaling pathways may influence the excitability of sensory neurons via the regulation of TRESK. The calcium-dependent activation of the channel was initially reported in the Xenopus oocyte expression system (Czirják et al., 2004). This regulation is mediated by the phosphatase calcineurin, which interacts directly with the PxIxIT- and LxVP-like calcineurin-binding motifs of TRESK (Czirják and Enyedi, 2006a, 2014). The calcium-dependent activation has been confirmed by other studies (Lafrenière et al., 2010; Andres-Enguix et al., 2012; Rahm et al., 2014), and it was found to influence the background K+ current and the excitability of sensory neurons in response to the activation of Gq-coupled receptors and the calcium-permeable TRPV1 channel (Kang et al., 2008; Kollert et al., 2015).
The regulatory regions of TRESK were identified by alanine-scanning mutagenesis (Czirják et al., 2004). The phosphorylation of recombinant TRESK fragments was examined in vitro using radioactive labeling with 32P, in kinase reactions with PKA (Czirják et al., 2008) and MARK2 (Braun et al., 2011) and in calcium-dependent phosphatase assays with mouse brain cytosol (Czirják and Enyedi, 2014). In the present study, we demonstrate for the first time that TRESK channel is dephosphorylated in the living cell, in good accordance with the previously reported role of calcineurin in the calcium-dependent regulation. Alteration of the migration pattern of TRESK subunit in Phos-tag gels, evoked by the application of ionomycin to the cells, was similar to that in vitro dephosphorylation of the protein with λ phosphatase.
As a new regulatory mechanism, the activation of TRESK by PMA was described in Xenopus oocytes (Rahm et al., 2012). We also investigated the regulation of the channel by novel-type PKC in this heterologous expression system. The cytoplasmic composition of oocytes is maintained during two-electrode voltage-clamp measurement, and long and repeated current recordings can be performed. In contrast, even the robust calcium-dependent TRESK regulation is difficult to record by whole-cell patch clamp in mammalian cells (Kang and Kim, 2006; Kang et al., 2008; Czirják and Enyedi, 2010; Braun et al., 2011). Therefore, we did not examine the slow activation of the channel by PKC using mammalian cell electrophysiology, although the effect of PMA on TRESK was recently detected by thallium flux measurements in baculovirus transduced U20S cells (Wright et al., 2013; Wright et al., 2017). The small and variable response of mouse TRESK to PMA also suggests that the rodent experimental systems may not be optimal for the investigation of the regulation by PKC.
The effect of PMA on human TRESK was reproducible throughout several experiments. In this study, we report for the first time that the coexpression of novel-type PKC η and ε isoforms with TRESK activates the background K+ current. The effects of the coexpression were similar to those of the pharmacologic activation of PKC; both increased the basal TRESK current, reduced the relative activation by ionomycin, and decreased the rate of recovery after the withdrawal of the ionophore. Whereas PKCη shows relatively low expression (Usoskin et al., 2015), PKCε is a well established mediator of inflammatory and neuropathic pain in dorsal root and trigeminal ganglia (Khasar et al., 1999; Aley et al., 2000; Dina et al., 2001; Pan et al., 2010; Honda et al., 2017). PKCε also has a pivotal role in nociceptor priming [for review, see the book chapter by Kandasamy and Price, 2015)]. In contrast to the activation of PKCε in several models of inflammatory pain, PKCε was reported to be downregulated in chronic nerve constriction injury (Zhou et al., 2003). If TRESK was activated by PKCε in the human nociceptor neurons similarly to Xenopus oocytes, then this mechanism could also contribute to the regulation of the membrane potential (e.g., when TRPV1 is sensitized by direct PKCε-dependent phosphorylation) (Numazaki et al., 2002).
The plausible interpretation of the mechanism of PKC-dependent TRESK activation is illustrated in Fig. 9. Novel isoforms of PKC inhibit the kinase responsible for the steady-state phosphorylation of TRESK at the S262–267 cluster; afterward, the channel is slowly activated by the weak phosphatase activity of the cytoplasm. This mechanism is independent of calcineurin (i.e., the calcium/calmodulin-dependent phosphatase does not mediate the effect); however, the pathway is related to the calcineurin-dependent regulation in another respect because activation of novel-type PKC results in the dephosphorylation of the same residues of TRESK as those targeted by calcineurin. Several lines of evidence support this conclusion. PKC does not activate TRESK via calcineurin since the chelation of cytoplasmic calcium with EGTA or mutations of the calcineurin-binding sites of TRESK did not influence the effect of PKC. The PKC-dependent activation relies on dephosphorylation of the S262–267 cluster, as reflected by the insensitivity of the S264A and S264E mutants to PMA. The importance of this dephosphorylation is also indicated by the MARK2Δ coexpression experiments, when the enforced phosphorylation of the S262–267 cluster prevented TRESK activation by PMA (Fig. 4) or constitutively active PKCε (Fig. 7).

Schematics illustrating the mechanism of TRESK activation by novel-type PKC. TRESK is activated by the dephosphorylation of the S262, 264, 267 serine cluster (only S264 is shown), whereas it is inhibited by the phosphorylation of the same regulatory region. Novel-type PKC inhibits the kinase activity responsible for TRESK phosphorylation (i.e., PKC activates the channel by the release of inhibition). After the inhibition of the TRESK-inhibitory kinase, the channel is slowly dephosphorylated by a weak protein phosphatase activity in a process different from the rapid and robust calcium-dependent activation of the channel by calcineurin. Microtubule-affinity regulating kinase 2 (MARK2) can be used to phosphorylate the S262, 264, 267 cluster under experimental conditions, but other kinases may also phosphorylate TRESK in vivo. The S252 regulatory site of TRESK is not depicted, since it does not contribute to the effect of novel-type PKC.
Direct biochemical evidence also indicates that TRESK protein is dephosphorylated in response to PMA treatment of the cells. Human TRESK contains 26 serine, threonine, or tyrosine residues in its IC regions, and phosphorylation of these sites may give rise to considerable complexity. Despite the high number of possible phosphorylations, PMA treatment apparently rearranged the migration pattern of TRESK protein and clearly resulted in accumulation of the dephosphorylated form. Since the protein mobility in Phos-tag gels is determined not only by the number of phosphorylations but also by their position, the reduction of the complexity of the phosphorylation pattern may result in better detection efficiency when a higher fraction of the protein runs into a given band.
PKC may result in dephosphorylation of TRESK by activation of a phosphatase or via inhibition of the kinase phosphorylating the channel. PMA decelerated the return of TRESK current to the resting state after the calcium-dependent activation evoked by ionomycin (Fig. 5). Recovery was also slowed by the coexpression of novel-type PKC constructs with TRESK (Figs. 6 and 7). The decelerated relative (percentage) recovery from the activation suggests that novel-type PKC inhibited the kinase responsible for the inhibitory phosphorylation of the channel.
Our results shed light on the mechanism of TRESK activation by novel-type PKC for the first time and explain the pharmacologic effect of PMA on this channel in the Xenopus oocyte expression system. The calcium-dependent regulation of TRESK by calcineurin appears to be more direct than the activation evoked by PKC. Both mechanisms result in dephosphorylation of the S262–267 regulatory cluster; however, calcineurin can dephosphorylate TRESK in general, as this ubiquitous phosphatase binds directly to the channel with high affinity. In contrast, the effect of PKC relies on an intermediate step, on the regulatory kinase phosphorylating TRESK, which may vary in the different cell types. MARK1–MARK3 kinases phosphorylate the S262–267 cluster under experimental conditions and are expressed in the dorsal root ganglion neurons (Usoskin et al., 2015); however, other kinases may also act on TRESK, and their identification is beyond the scope of the present study. Regarding the complex mechanism of action and the slow development of TRESK activation in Xenopus oocytes, great efforts and substantially different methods will be required in future studies to determine whether TRESK is regulated by PKCε in human sensory neurons.
Acknowledgments
We thank Alice Dobolyi and Irén Veres for skillful technical assistance.
Authorship Contributions
Participated in research design: Pergel, Lengyel, Enyedi, Czirják.
Conducted experiments: Pergel, Lengyel, Enyedi, Czirják.
Performed data analysis: Pergel, Lengyel, Enyedi, Czirják.
Wrote or contributed to the writing of thr manuscript: Pergel, Lengyel, Enyedi, Czirják.
Footnotes
- Received February 18, 2019.
- Accepted April 4, 2019.
This work was supported by the Hungarian Research Fund (NKFIH K-127988). E.P. was supported by VEKOP-2.3.2-16-2016-00002. The research was financed by the Higher Education Institutional Excellence Program of the Ministry of Human Capacities in Hungary within the framework of the molecular biology thematic program of the Semmelweis University.
Abbreviations
- CsA
- cyclosporine A
- EC
- extracellular
- HA
- hemagglutinin
- IC
- intracellular
- K2P18
- two-pore domain K+ channel 18 (TRESK)
- MARK
- microtubule-affinity regulating kinase
- 4α-PDD
- 4α-phorbol 12,13-didecanoate
- PKC
- protein kinase C
- PMA
- phorbol 12-myristate 13-acetate
- 4α-PMA
- 4α- phorbol 12-myristate 13-acetate
- TRESK
- TWIK-related spinal cord K+ channel (K2P18.1)
- TRPV1
- transient receptor potential cation channel subfamily V member 1
- Copyright © 2019 by The American Society for Pharmacology and Experimental Therapeutics


