


Abstract
The two-state coagonist model has been successfully used to analyze and predict peak current responses of the γ-aminobutyric acid type A (GABAA) receptor. The goal of the present study was to provide a model-based description of GABAA receptor activity under steady-state conditions after desensitization has occurred. We describe the derivation and properties of the cyclic three-state resting-active-desensitized (RAD) model. The relationship of the model to receptor behavior was tested using concatemeric α1β2γ2 GABAA receptors expressed in Xenopus oocytes. The receptors were activated by the orthosteric agonists GABA or β-alanine, the allosteric agonist propofol, or combinations of GABA, propofol, pentobarbital, and the steroid allopregnanolone, and the observed steady-state responses were compared with those predicted by the model. A modified RAD model was employed to analyze and describe the actions on steady-state current of the inhibitory steroid pregnenolone sulfate. The findings indicate that the steady-state activity in the presence of multiple active agents that interact with distinct binding sites follows standard energetic additivity. The derived equations enable prediction of peak and steady-state activity in the presence of orthosteric and allosteric agonists, and the inhibitory steroid pregnenolone sulfate.
SIGNIFICANCE STATEMENT The study describes derivation and properties of a three-state resting-active-desensitized model. The model and associated equations can be used to analyze and predict peak and steady-state activity in the presence of one or more active agents.
Introduction
The classic two-state concerted transition model (the MWC model) was originally introduced by Monod, Wyman, and Changeux to study allosteric transitions in multimeric proteins (Monod et al., 1965). More recently, it has been employed to describe activation of transmitter-gated ion channels, including the γ-aminobutyric acid type A receptor (GABAA receptor) (Chang and Weiss, 1999; Ruesch et al., 2012; Akk et al., 2018). The model postulates two states for the receptor, resting and active. The receptor contains one or more functionally equivalent agonist binding sites, and receptor activation is driven by the higher affinity of the binding sites to the agonist in the active state. Only four parameters (extent of constitutive activity, affinity of the resting receptor for agonist, affinity of the active receptor for agonist, and the number of agonist binding sites) are required to describe receptor activation (Forman, 2012; Ehlert, 2014; Steinbach and Akk, 2019). Despite its simplicity, the MWC model has been shown to account for receptor activation by a number of orthosteric and allosteric agonists, and agonist combinations (Chang and Weiss, 1999; Ruesch et al., 2012; Ziemba and Forman, 2016; Akk et al., 2018; Cao et al., 2018).
Desensitization is explicitly excluded in the two-state model, which is therefore better suited to analyze peak, i.e., pseudo-steady-state, responses, and activity from receptors exhibiting weak desensitization such as the ρ subunit-containing GABAA receptor. However, for the majority of transmitter-gated ion channels, including the ubiquitous α1β2γ2 subtype of the GABAA receptor, desensitization is a fundamental property. Furthermore, for many endogenous and clinical GABAergic agents, steady-state, rather than peak, currents more appropriately reflect clinically relevant aspects of receptor function. To provide a tool to study, and predict, steady-state activity we expanded the two-state MWC model to include a desensitized state while retaining the concerted nature of state transitions. The three-state resting-active-desensitized (abbreviated RAD; Fig. 1A) model is a cyclic model with N identical sites for an agonist. The sites have low affinity to the agonist when the receptor is in the resting state, and high affinity when the receptor is in the active or desensitized state. Like the classic MWC model, the three-state RAD model can be further expanded to describe steady-state activation in the presence of multiple agonists.

The RAD model. (A) Kinetic scheme for the standard RAD model, shown with two binding sites for agonist X. The receptor can occupy a resting (R), active (A), or desensitized (D) state. The active and desensitized states have high affinity to X, whereas the resting state has low affinity to X. The parameter L (= R/A) describes the equilibrium between the resting and active states, and the parameter Q (= A/D) describes the equilibrium between the active and desensitized states. The parameter KX is the equilibrium dissociation constant for X in the resting receptor. The parameter cXKX is the equilibrium dissociation constant for X in the active and desensitized receptors. The classic MWC model contains only R and A states with no other modifications in states or equilibrium constants. (B) Modification of the RAD model in which the drug X has low affinity to resting and active states and high affinity to the desensitized state. The modified model was employed to analyze receptor behavior in the presence of the inhibitory steroid pregnenolone sulfate.
A modification of the model (Fig. 1B) was derived to describe the effect of the endogenous inhibitory steroid pregnenolone sulfate (PS). Coapplication of PS with GABA enhances apparent desensitization of the receptor (Akk et al., 2001; Eisenman et al., 2003). The modified RAD model contains N binding sites for pregnenolone sulfate that have high affinity in the desensitized state and low affinity in the active or resting states.
The relationship of the models to receptor behavior was tested using the concatemeric α1β2γ2 GABAA receptor expressed in Xenopus oocytes. The receptor was activated by several combinations of orthosteric (GABA, β-alanine) and allosteric (propofol, pentobarbital, 3α5αP, PS) agents. The observed data are compared with predictions made using the RAD model.
Materials and Methods
Receptors and Expression.
The GABAA receptors were expressed in Xenopus laevis oocytes. Harvesting of oocytes was conducted under the Guide for the Care and Use of Laboratory Animals as adopted and promulgated by the National Institutes of Health. The animal protocol was approved by the Animal Studies Committee of Washington University in St. Louis (approval no. 20170071).
The receptors consisted of concatemeric β2-α1-γ2L (βαγ) and β2-α1 (βα) constructs. The design and properties of the concatemeric receptors have been described previously (Bracamontes and Steinbach, 2009; Bracamontes et al., 2011). The cDNAs in the pcDNA3 vector were linearized with XbaI (NEB Laboratories, Ipswich, MA) and the cRNAs generated using mMessage mMachine (Ambion, Austin, TX). The oocytes were injected with a total of 10 ng cRNA in a 1:1 (βαγ/βα) ratio. Injected oocytes were incubated in bath solution (96 mM NaCl, 2 mM KCl, 1.8 mM CaCl2, 1 mM MgCl2, and 5 mM HEPES; pH 7.4) with supplements (2.5 mM Na pyruvate, 100 IU/ml penicillin, 100 μg/ml streptomycin, and 50 μg/ml gentamycin) at 16°C for 2–3 days prior to electrophysiological recordings.
Electrophysiology.
The recordings were conducted using standard two-electrode voltage clamps. The oocytes were clamped at −60 mV. The chamber (RC-1Z; Warner Instruments, Hamden, CT) was perfused with bath solution at 5–8 ml/min. Solutions were gravity-applied from 30-ml glass syringes with glass Luer-Slips via Teflon tubing. Solutions were switched manually.
The current responses were amplified with an Axoclamp 900A (Molecular Devices, Sunnyvale, CA) or OC-725C amplifier (Warner Instruments), digitized with a Digidata 1320 or 1200 series digitizer (Molecular Devices), and stored using pClamp (Molecular Devices).
A typical experiment entailed recording of a 10- to 20-second baseline, followed by a test agonist application for 90–330 seconds (1.5–5.5 minutes), and bath application until full recovery. Owing to long exposure times, each cell was exposed to only one to three test concentrations of agonist rather than a complete range of agonist concentrations. Thus, the concentration-response relationships shown reflect average responses from cells exposed to an incomplete range of agonist concentrations. The effects of the inhibitory steroid PS were determined by coapplying the steroid with 1 mM or 3 μM GABA. Each cell was tested with one to three concentrations of PS. Each cell was also tested with 3 mM GABA + 100 μM propofol to determine the maximal response to which the responses to test drugs were compared.
Analysis of Peak Currents.
The current traces were analyzed using Clampfit (Molecular Devices) to determine the peak and steady-state amplitudes. In cases in which the current response had not reached steady-state (defined as ΔI <2% during the last 20 seconds of agonist application) by the end of the 4- to 5-minute agonist application, steady-state was estimated by exponential fitting of the current decay.
The current amplitudes were converted to units of probability of being in the active state (PActive) by matching the relative peak responses against a scale ranging from the PActive of 0 to 1 (Forman and Stewart, 2012; Eaton et al., 2016). Wild-type concatemeric receptors in the absence of agonist exhibit minuscule constitutive activity (PActive = 0.00011) (Akk et al., 2018); therefore, the holding current in the absence of agonists was considered to have a PActive indistinguishable from 0. The current level corresponding to PActive of one was estimated by exposing the receptors to the combination of 3 mM GABA and 100 μM propofol (Shin et al., 2018). The values of PActive in the presence of test agonists are expressed as mean ± S.D.
The activation parameters for peak currents were determined as described previously [e.g., (Akk et al., 2018)]. The peak currents, in PActive units, were fitted with the following equation (Forman, 2012; Steinbach and Akk, 2019): (1)where [X] is the concentration of agonist X, KX is the equilibrium dissociation constant for agonist X in the resting receptor, cX is the ratio of the equilibrium dissociation constant for X in the active receptor to KX, and NX is the number of binding sites for X. L expresses the level of background activity, and is calculated as the ratio of resting to active receptors. In the absence of other agonists, L was constrained to 8000 (Akk et al., 2018). When the activity of X was studied in the presence of a low concentration of a background agonist Y, L was constrained to the value calculated as (1 − PActive,Y)/PActive,Y. Curve-fitting was carried out using Origin v. 7.5 (OriginLab, Northampton, MA) on pooled data from at least five cells. The fitted values for KX and cX are given as best-fit parameter ± S.E. of the fit.
Predictions for Current Responses.
The predictions for peak current responses were made as described in detail previously (Shin et al., 2019). In brief, the PActive was calculated using the state function (eq. 1) that pertains to the two-state MWC model (Forman, 2012; Steinbach and Akk, 2019). The activation parameters (receptor affinity and efficacy) were taken from earlier studies (Shin et al., 2017, 2018; Akk et al., 2018). The predictions for the probability of being in the active state during the steady-state response (PActive,S.S.) were made using eqs. 4 (for a single agonist) or 25 (for agonist combinations) that pertain to the three-state model that incorporates a desensitized state (Fig. 1). More details are provided below.
When predicting responses to two or more agonists the nominal concentration of each agonist was adjusted to account for cell-to-cell variability (Shin et al., 2019). By matching the relative experimental peak response to the previously determined concentration-response relationship, the basis of the predicted response to a combination of agonists was the observed PActive of responses to individual agonists rather than the nominal concentrations of the individual agonists. For example, the predicted response to GABA + propofol is calculated on the basis of the observed responses to GABA and propofol applied separately, rather than on the nominal concentrations of GABA and propofol.
Materials and Chemicals.
The inorganic salts used to prepare the bath solution and GABA were purchased from Sigma-Aldrich (St. Louis, MO). Propofol was purchased from MP Biomedicals (Solon, OH). The steroids 3α5αP and pregnenolone sulfate were bought from Sigma-Aldrich or Tocris (Bio-Techne, Minneapolis, MN).
The stock solution of GABA was made in the bath solution at 500 mM, stored in aliquots at −20°C, and diluted on the day of experiment. The solution of β-alanine was made at 30 mM in bath solution on the day of experiment. Stock solution of propofol was made in dimethyl sulfoxide (DMSO) at 200 mM and stored at room temperature. 3α5αP was dissolved in DMSO at 10–20 mM and stored at room temperature. PS was dissolved in DMSO at 50 mM and stored at 4°C.
Results
Description of the Three-State Model.
The two-state MWC model (Forman, 2012; Steinbach and Akk, 2019) can be readily extended to include a desensitized state originating from the active state. We have termed the modified, three-state model as the resting-active-desensitized (or “RAD”) model (Fig. 1). The model retains the concerted nature of the state transitions, i.e., all sites undergo identical and simultaneous state transition. In the absence of agonist, L = R/A and Q = A/D. The ratio of the dissociation constant for the high-affinity state to that for the low-affinity state is cX; the affinity of the desensitized state to the agonist is postulated to be identical to that of the active state, as has been shown experimentally for the related nicotinic receptor (Sine et al., 1995; Edelstein et al., 1996; Grosman and Auerbach, 2001).
The equilibrium probability of being high-affinity, i.e., in an active or desensitized state is described by the following equation: (2)where we define
 (3)The probability of being active is the probability of being active given that the receptor is high-affinity times the probability the receptor is high-affinity, where Prob[Active given Active or Desensitized] = Q/(1 + Q).
 (4)Equation 4 can be used to estimate activity under steady-state conditions. As Q→∞ (or 1/Q = D/A→0, i.e., minimal desensitization), PActive approaches
 (5)As [X] → 0 (no agonist), PActive approaches
 (6)and as [X] → ∞ (saturating agonist), PActive approaches
 (7)The equation for the normalized EC50 for activation is similar to that for the two-state MWC model. To emphasize the similarity, let µ=1+1/Q. Then, the EC50 for activation normalized to its affinity to the agonist is:
 (8)As L → 0 (low energy of activation)
 (9)As L → ∞ (high energy of activation)
 (10)As Q → 0 (strong desensitization)
 (11)As Q → ∞ (weak desensitization), ΥX approaches the value for the two-state MWC model with those values of L and cX.
 (12)The probability of being desensitized is
 (13)In the absence of agonist
 (14)And at saturating agonist
 (15)The relative probability of being active at steady-state, i.e., the ratio of the probabilities of being in the active state at steady-state vs. peak is:
 (16)When Q is large (minimal desensitization), then ΨX approaches 1. The constitutive relative probability of being open in the absence of agonist is
 (17)The relative probability of being active in the presence of a saturating concentration of X is:
 (18)When cX = 1 (competitive antagonist) then Ψ[X]=0 = Ψ[X]=∞, whereas when cX < 1 (agonist) then Ψ[X]=0 > Ψ[X]=∞.
An Illustration of Receptor Behavior.
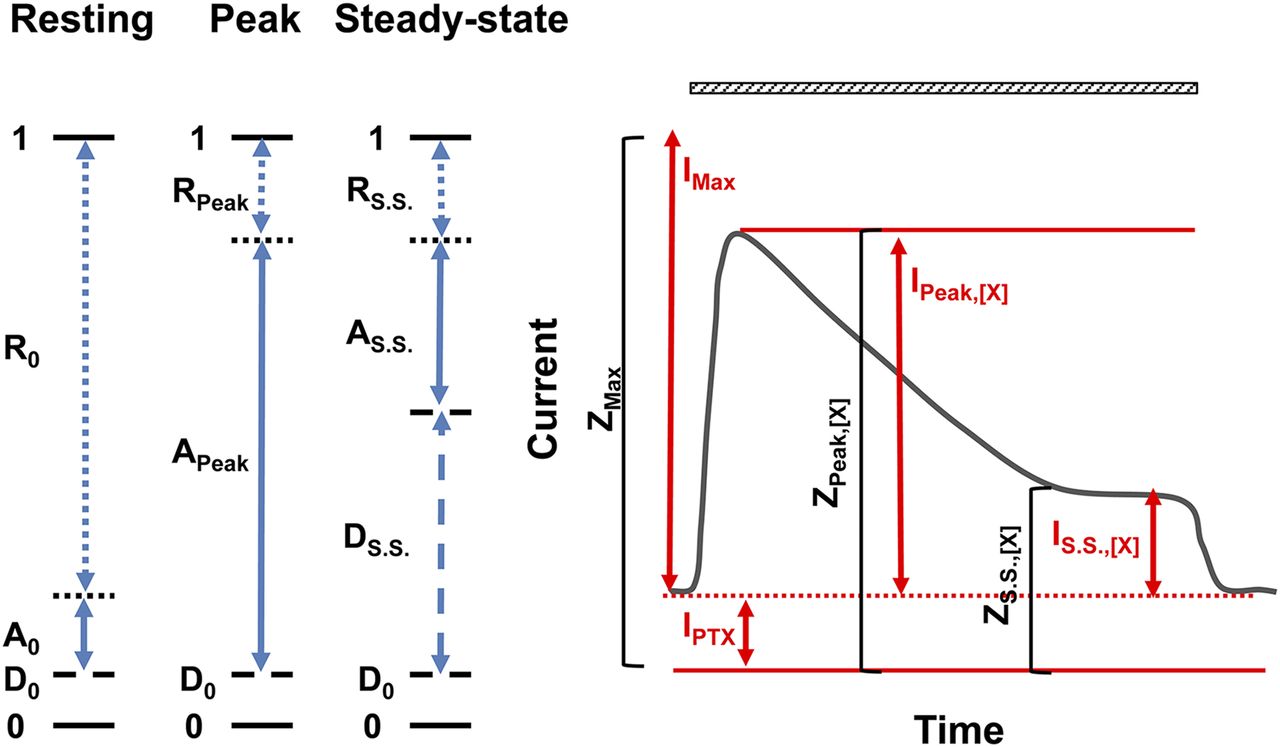
Figure 2 illustrates a simulated current response and its relation to the kinetic scheme. On the left, a scheme is shown of the states of the receptor (resting, active, and desensitized) with the fractions of the population indicated by the lines. A graph of a response to an application of agonist X is shown on the right. The parameters discussed are indicated on the graph.

Illustration of receptor behavior. The left panel shows the states of the receptor (resting, active, and desensitized). The fractions of the populations in each state are shown by the arrows (dotted, resting receptor; solid, active receptor; dashed, desensitized receptor). D0 is the fraction of desensitized receptors in the absence of agonist. The right panel shows a simulated current response to application of agonist X over the time indicated by the striped bar above the trace. IPTX shows the level of constitutive activity as determined by blocking the constitutively active receptors with picrotoxin. IPeak,[X] gives the peak response to X, IMax shows the peak response to agonist or combination of agonists eliciting a response with POpen of 1. IS.S.,[X] is the steady-state current level in the presence of X. ZPeak,[X] is the total current at the peak of the response and is equal to IPeak,[X] − IPTX.
Two important assumptions are made in the analysis of the peak response. First, the peak response is not affected by development of desensitization (i.e., desensitization is slow). The second assumption is that the maximal potentiated response activates all receptors that were not desensitized in the steady-state before the application of agonist. This assumption is also made for the analysis of responses in terms of the two-state MWC model, and allows the response to be converted to the probability of being active.
The total range of response is: (19)where “scale” converts probability of being active to current. The maximal probability of being active (PActive,max) is assumed to be 1, and D0 is the probability a receptor is desensitized in the absence of agonist.
The normalized peak response to a given concentration of agonist X is then given as: (20)
(20)
Under the assumption that the peak response is not affected by the development of desensitization, then the normalized peak response can be analyzed in terms of the two-state MWC model to yield estimates of KX and cX. The steady-state response can be analyzed in terms of the relative response compared with the peak. An earlier result gave an equation for the relative probability of being active. We can define the relative probability of being active from the steady-state (fully desensitized) response to [X] relative to the peak response to [X]: (21)
(21)
There are estimates for all the terms in the equation except for Q, so Q can be estimated from the concentration dependence of Ψ[X].
Peak and Steady-State Activation of the Concatemeric α1β2γ2L GABAA Receptor by GABA.
Cells expressing concatemeric α1β2γ2L receptors were exposed to 90- to 330-second applications of 0.3–1000 μM GABA. To minimize various errors associated with long-duration recordings, each cell was exposed to only one to three test concentrations of GABA rather than to a full range of agonist concentrations. Each cell was also tested with 3 mM GABA + 100 μM propofol that was considered to activate all receptors not desensitized prior to drug application (Shin et al., 2018). Sample current responses and the concentration-response data for peak and steady-state currents are shown in Fig. 3.

Peak and steady-state activation by GABA. (A) Sample current traces from cells expressing wild-type concatemeric α1β2γ2L receptors activated by 1, 10, 100, or 1000 μM GABA. The dashed lines show the steady-state current levels as determined by exponential fitting of the decay phase. (B) Concentration-response relationships for peak and steady-state currents. The data points show mean ± S.D. from five to six cells per concentration. The curves were fitted with eqs. 1 and 4, respectively. The best-fit parameters for peak currents are: KGABA = 59 ± 22 μM and cGABA = 0.0020 ± 0.0006. The curve for steady-state currents was fitted using the KGABA and cGABA values constrained to those obtained in fitting the peak currents. The best-fit value for Q was 0.27 ± 0.02. The value of L was constrained to 8000 (Akk et al., 2018), and the number of binding sites for GABA was constrained to 2.
Channel activity was analyzed by first determining the activation parameters (KGABA, cGABA) from peak currents using eq. 1. In the second step, the steady-state currents from the same set of cells were analyzed using eq. 4, with KGABA and cGABA constrained to the values determined in the analysis of peak responses.
From the analysis of peak responses, we estimate a KGABA of 59 ± 22 μM (best-fit parameter ± S.E. of the fit) and a cGABA of 0.0020 ± 0.0006. The number of binding sites for GABA was constrained to 2, and L was held at 8000 (Akk et al., 2018). The estimated values for KGABA and cGABA are similar to our previous estimates (KGABA = 72 μM, cGABA = 0.0033), obtained from experiments in which each cell was exposed to short-duration applications of the full range of agonist concentrations (Akk et al., 2018).
To determine the value of Q (= A/D in the RAD model; Fig. 1), we fitted the concentration-response curve for steady-state currents using eq. 4. The values of KGABA and cGABA were constrained to those obtained from fitting the peak currents in the same set of cells (59 μM and 0.0020, respectively). Curve-fitting the concentration-response data yielded a Q of 0.27 ± 0.02. Thus, under steady-state conditions, the ratio of active to desensitized receptors is approx. 1:4 for the α1β2γ2L concatemeric receptor.
Peak and Steady-State Activation of the Concatemeric α1β2γ2L GABAA Receptor by Propofol.
We next determined receptor desensitization properties in the presence of the allosteric agonist propofol. In the RAD model, desensitization, determined by the parameter Q, is a property of the receptor rather than agonist. Accordingly, we expected the values of Q to be similar in the presence of either propofol or GABA.
To shift the propofol concentration-response relationship to lower concentrations and to reduce propofol-induced block (Ruesch et al., 2012; Shin et al., 2018), the recordings were conducted in the presence of a low concentration (3 μM) of GABA. The probability of being in the active state in the presence of 3 μM GABA alone was 0.033 ± 0.026 (mean ± S.D.; n = 47 cells). Propofol concentration-response relationships were obtained by exposing each cell to 3 μM GABA alone, followed by GABA combined with one to three concentrations of propofol. Additionally, each cell was tested with 3 mM GABA + 100 μM propofol. Sample currents and the concentration-response relationships for peak and steady-state currents are shown in Fig. 4.

Peak and steady-state activation by propofol. (A) Sample current traces from cells expressing wild-type concatemeric α1β2γ2L receptors activated by 3 μM GABA (gray traces and gray time scales) and 3 μM GABA combined with 0.1, 0.5, 5, or 20 μM propofol (PRO; black traces and black time scales). The dashed lines show the steady-state current levels for GABA + propofol, as determined by exponential fitting of the decay phase. (B) Concentration-response relationships for peak and steady-state currents. The data points show mean ± S.D. from five to six cells per concentration. The curves were fitted with eqs. 1 and 4, respectively. The best-fit parameters for peak currents are: KPRO = 10 ± 2 μM and cPRO = 0.37 ± 0.02. The curve for steady-state currents was fitted using the KPRO and cPRO values constrained to those obtained in fitting the peak currents. The best-fit value for Q was 0.36 ± 0.04. The value of L was constrained to 29 as determined from background open probability in the presence of 3 μM GABA. The number of binding sites for propofol was constrained to 6 (Shin et al., 2018).
Analysis of the peak responses yielded a KPRO of 10 ± 2 μM and a cPRO of 0.37 ± 0.02. The number of propofol binding sites, NPRO, was constrained to 6 (Shin et al., 2018), and the value of L, calculated from the background activity as (1 − PActive,3 μM GABA)/PActive,3 μM GABA, was constrained to 29. The fitted KPRO and cPRO values are similar to previously reported values for the concatemeric receptor [KPRO = 21 μM and cPRO = 0.22; (Shin et al., 2018)]. Analysis of the steady-state responses using eq. 4, and KPRO and cPRO constrained to the values obtained in fitting the peak responses, yielded a Q of 0.36 ± 0.04.
Desensitization in the Presence of a Saturating Concentration of Strong Agonist.
In the RAD model, activation and desensitization are fully coupled at steady-state, so agonists activate and desensitize with relative desensitization determined solely by Q (= A/D; Fig. 1). If drug X is an efficacious agonist (cX << 1), then at saturating concentrations of X the term LΓX in eq. 22 will become very small, and the probability of being active approaches Q/(1 + Q): (22)This will be true for all high-efficacy agonists, so relative desensitization is predicted to be constant in the presence of all high-efficacy agonists and agonist combinations.
We tested this prediction by comparing PActive,S.S. in the presence of two efficacious orthosteric agonists, GABA and β-alanine. The agonists were applied at saturating concentrations: 1 mM for GABA and 30 mM for β-alanine. Using the previously reported activation parameters for GABA and β-alanine (Shin et al., 2019), the estimated LΓGABA is 0.10 and LΓβ-alanine 0.05. The steady-state probability of being active was determined by comparing the steady-state current level to the peak amplitude, while taking into consideration the estimated PActive of the peak response at saturating agonist concentration [0.92 for GABA and 0.96 for β-alanine; (Shin et al., 2019)]. In the presence of 1 mM GABA, the PActive,S.S. was 0.16 ± 0.04 (mean ± S.D.; n = 9), and in the presence of 30 mM β-alanine, the PActive,S.S. was 0.19 ± 0.06 (n = 7). Sample current traces and data summary are given in Fig. 5. The calculated values for Q are 0.19 ± 0.06 for GABA and 0.24 ± 0.08 for β-alanine.

Comparison of desensitization to maximal responses to orthosteric agonists or combinations of orthosteric and allosteric agonists. (A) Sample traces in the presence of 30 mM β-alanine, 1 mM GABA combined with 20 μM propofol, 50 μM pentobarbital (PEB), or 1 μM 3α5αP. The dashed lines show the level of steady-state current, estimated by exponential fitting of the decay phase. A representative trace for 1 mM GABA is provided in Fig. 3A. (B) Steady-state open probability in the presence of GABA, β-alanine, or combinations of GABA and an allosteric agonist. The open symbols show responses from individual cells (five to nine cells per condition). The filled symbols and error bars give mean ± S.D., and the horizontal lines show the grand mean (solid line) ± S.D. (dashed lines) for the entire data set.
Coapplication of an allosteric agonist with saturating GABA did not affect desensitization (Fig. 5). The PActive,S.S. was 0.22 ± 0.03 (n = 5), 0.19 ± 0.05 (n = 8), and 0.17 ± 0.11 (n = 6) in cells exposed to 1 mM GABA combined with 20 μM propofol, 50 μM pentobarbital, or 1 μM 3α5αP, respectively. The calculated Q values are 0.29 ± 0.04 for GABA + propofol, 0.24 ± 0.08 for GABA + pentobarbital, and 0.23 ± 0.20 for GABA + 3α5αP. We propose that propofol, pentobarbital, and allopregnanolone have minimal effect on the value of Q, i.e., the ratio of active to desensitized receptors.
Effect of Pregnenolone Sulfate on Steady-State Current.
The steroid pregnenolone sulfate inhibits the GABAA receptor. Previous work using single-channel patch clamp has indicated that PS acts by reducing the mean duration of the single-channel cluster without affecting intracluster open- and closed-time distributions (Akk et al., 2001). In whole-cell recordings, the effect manifests as more rapid apparent desensitization with minimal effect on peak amplitude (Eisenman et al., 2003). The data indicate that PS acts by altering apparent desensitization.
We examined the effect of 0.01–50 μM PS on steady-state current in the concatemeric α1β2γ2L receptor activated by a saturating concentration (1 mM) of GABA. To minimize error associated with multiple long-duration drug applications on the same cell, each cell was exposed to one to three concentrations of PS rather than to the complete range of steroid concentrations. Thus, the concentration-response relationships indicate pooled data of average responses from cells exposed to an incomplete range of concentrations. Curve fitting the PS concentration-response relationship with the Hill equation yielded an IC50 of 0.24 ± 0.03 μM (best-fit parameter ± S.E. of the fit). A sample current response is shown in Fig. 6A.

Receptor inhibition by the steroid pregnenolone sulfate. (A) Sample current trace showing the effect of 10 μM pregnenolone sulfate on concatemeric α1β2γ2L receptors activated by 1 mM GABA. (B) PS concentration-response relationship for receptors activated by 1 mM GABA. The data points show mean ± S.D. from five cells per concentration. The curve was fitted with eq. 23, yielding a Q of 0.31 ± 0.01, KPS of 3.5 ± 1.2 μM, and cPS of 0.054 ± 0.014. The number of binding sites for PS was held at 1. The term LΓGABA was constrained to 0.10 (see text). The inset more clearly demonstrates the incomplete block, also predicted by eq. 23, at high concentrations of PS. (C) Sample current trace demonstrating the effect of 10 μM PS on receptors activated by 3 μM GABA. (D) PS concentration-response relationship for receptors activated by 3 μM GABA. The data points show mean ± S.D. from 5 to 11 cells per concentration. The relatively large error limits reflect cell-to-cell variability in responses to 3 μM GABA. The curve shows the predicted effect of PS calculated using the Q, KPS, and cPS values determined in the presence of 1 mM GABA (B) and LΓGABA constrained to 29. There were no free parameters in generating the predicted line in (D).
Further analysis was conducted in the framework of the modified RAD model (Fig. 1B). In this model, PS binds with high affinity to the desensitized state resulting in receptor accumulation in the desensitized state and inhibition of current response. The model does not require modification of receptor properties (L or Q) or parameters of activation by agonist X (KX or cX). For receptors activated by agonist X, the probability of being in the active state in the presence of PS is: (23)where [PS] is the concentration of the steroid, KPS is the equilibrium dissociation constant of the resting and active receptor to PS, and cPS is the ratio of the equilibrium dissociation constant of the desensitized receptor to KPS. The number of sites for PS is assumed to be 1. For PS to shift equilibrium towards the desensitized state, i.e., reduce receptor activity, cPS < 1. Γ[X] is described by eq. 3. Fitting the PS concentration-response data to eq. 23 yielded a Q of 0.31 ± 0.01, KPS of 3.5 ± 1.2 μM, and cPS of 0.054 ± 0.014. LΓGABA was held at 0.10. The fitted value for Q is close to that estimated for responses to GABA. The fitted curve is shown in Fig. 6B. We note that inhibition at high concentrations of PS does not seem to be complete (Fig. 6B, inset), in agreement with predictions made by eq. 23.
The position of the concentration-response relationship for PS-mediated inhibition of steady-state activity depends on the concentration of GABA used to activate the receptor. For this kinetic mechanism, the potency of PS would decrease when the fraction of receptors that is active decreases since a smaller fraction of receptors would be available to interact with high affinity. For receptors activated by 3 μM GABA (<EC50), the IC50 was 4.0 ± 1.1 μM (best fit parameter ± S.E. of the fit). A sample current trace is shown in Fig. 6C. To test whether the model can account for the increase in IC50 at a lower concentration of GABA, we simulated the concentration-response relationship for PS-mediated inhibition in the presence of 3 μM GABA using eq. 23. The predicted curve and the observed data are shown in Fig. 6D. It is important to note that the predicted curve was generated with no free parameters. The term LΓGABA was calculated from the observed response in the absence of PS, and other parameters were estimated from the fit to data with 1 mM GABA.
Effects of Agonist Combinations on Steady-State Currents.
As in the case of the classic two-state MWC model, coapplication of agonist Y affects the action of agonist X by a change in the effective value of L when the two drugs interact with distinct sites. The probability of being in the high-affinity state is: (24)and the probability of being in the active state is:
 (25)The denominator in eq. 25 can be modified with additional Γ terms for additional agonists.
To confirm the prediction experimentally, we measured peak and steady-state activity in the presence of a triple agonist combination of 2 μM GABA + 0.15 μM 3α5αP + 5 μM propofol. In six cells, the mean PActive,Peak was 0.59 ± 0.13 and the mean PActive,S.S., 0.23 ± 0.03. The PActive,S.S., calculated using eq. 4, with the value of Q constrained to 0.3, is 0.20 ± 0.01. Figure 7A shows a comparison of predicted versus observed PActive,S.S./PActive,Peak as a function of PActive,Peak for several additional combinations of orthosteric and allosteric agonists.
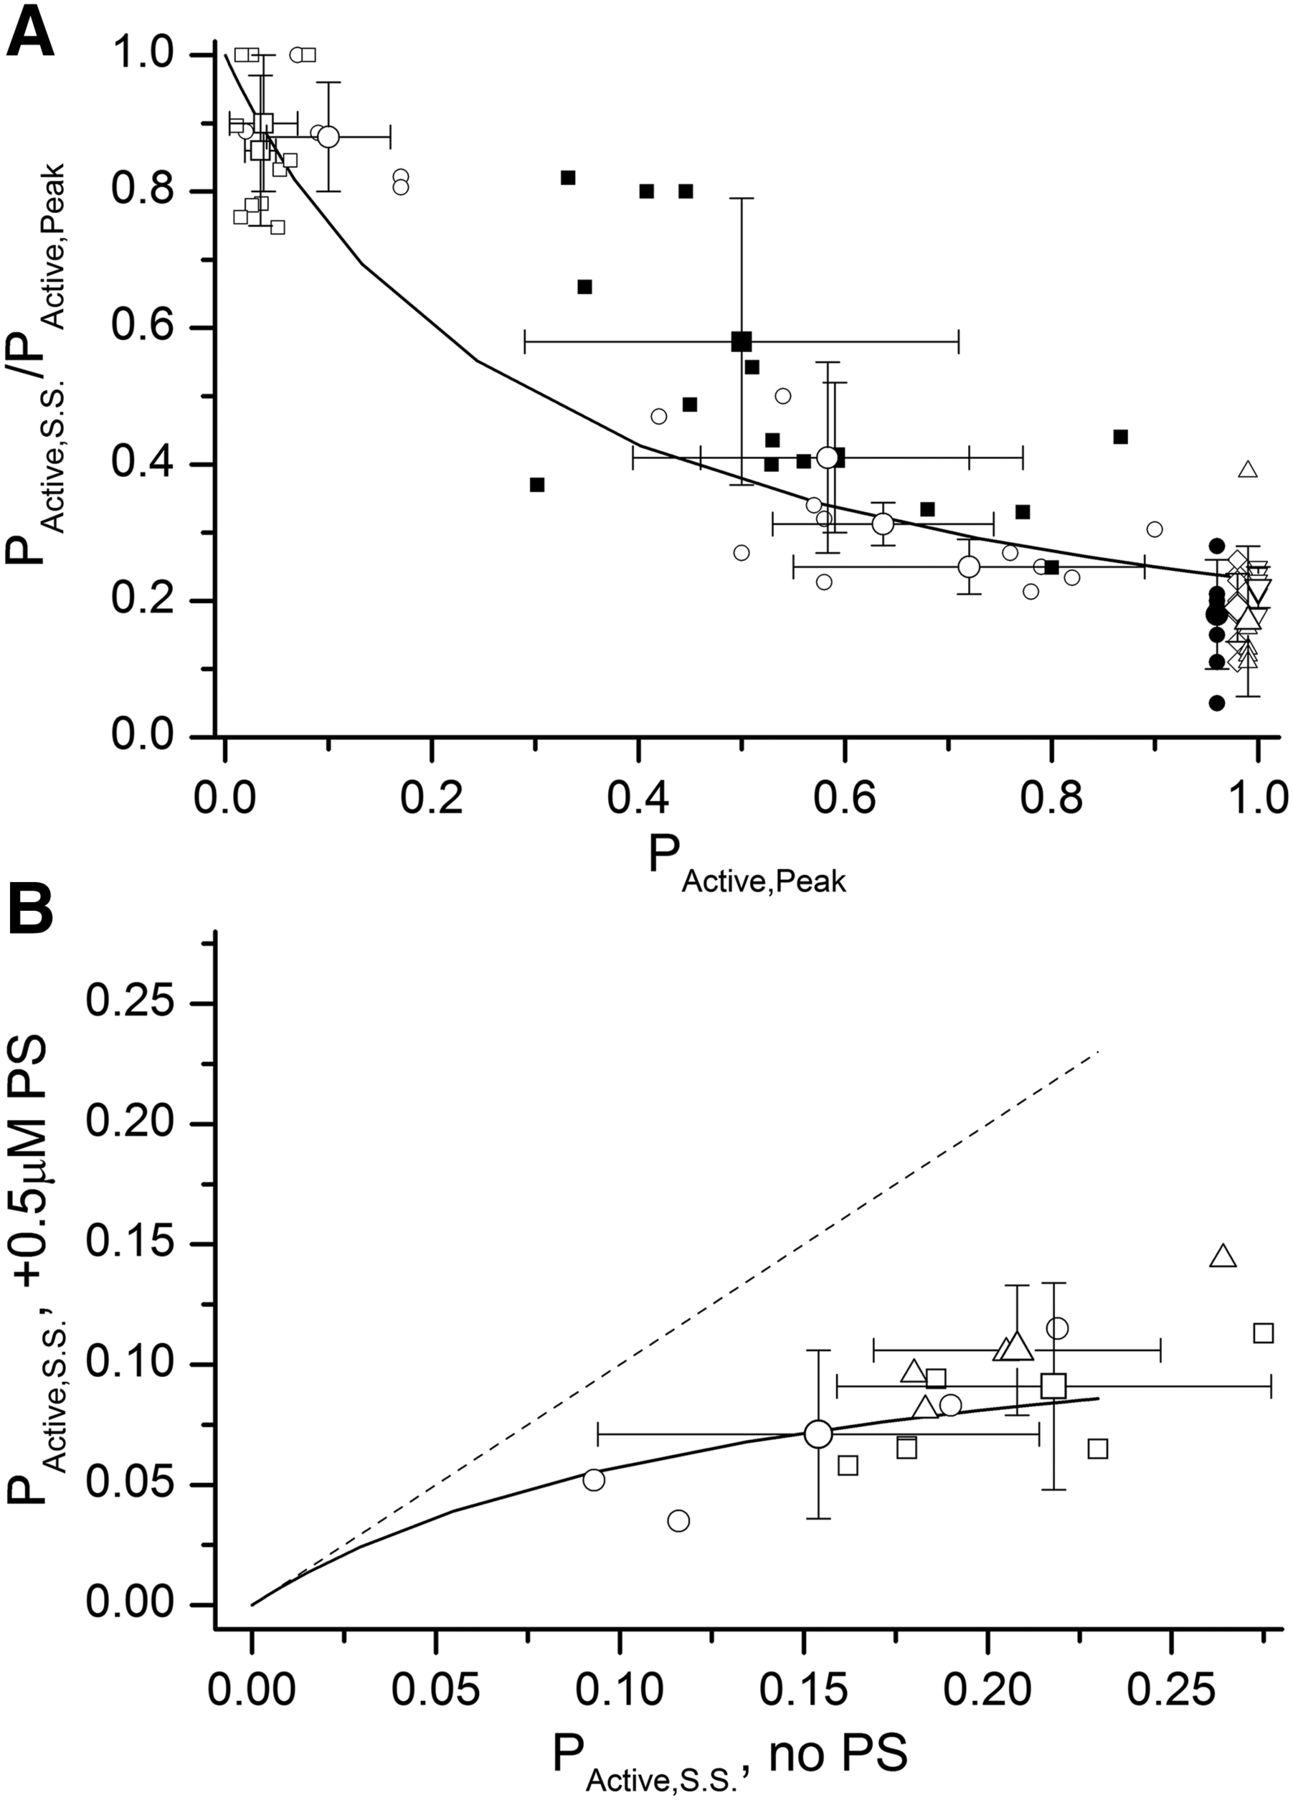
Independence of the actions of GABAergic agents. (A) Ratio of steady-state to peak open probability as a function of peak open probability. The solid line shows the predicted relationship using eq. 4 with Q constrained to 0.3. Small data points show the data from individual cells. Large data points show mean ± S.D. for 30 mM β-alanine (filled circle; n = 8 cells), combinations of 3–10 μM GABA + 0.1–3 μM 3α5αP (open circles; n = 3–5 cells per condition), 3 μM GABA + 0.05–0.1 μM propofol (open squares; n = 5–6 cells per condition), 1–2 μM GABA + 0.1–0.15 μM 3α5αP + 5 μM propofol (filled squares; n = 6–8 cells per condition), 1 mM GABA + 1 μM 3α5αP (triangle; n = 6 cells), 1 mM GABA + 20 μM propofol (inverted triangle; n = 5 cells), and 1 mM GABA + 50 μM pentobarbital (diamond; n = 8 cells). (B) Summary of the effect of 0.5 μM PS on steady-state current elicited by 1 mM GABA + 1 μM 3α5αP (circle; n = 4 cells), 1 mM GABA + 5 μM propofol (square; n = 7 cells), or 1 mM GABA + 1 μM 3α5αP + 5 μM propofol (triangle; n = 4 cells). Small data points show the data from individual cells. Large data points show mean ± S.D. The solid line shows the predicted effect of 0.5 μM PS at various steady-state open probabilities. The prediction was made using eq. 26, with KPS constrained to 3.5 μM and cPS constrained to 0.054. The dashed line indicates the zero effect line.
We further tested the independence of drug actions by determining the inhibitory effect of PS on receptors activated by various combinations of agonists. Figure 7B shows the comparison of observed data with predictions made assuming independence of the actions of PS and various agonists. The predictions for steady-state open probability in the presence of PS and combinations of agonists were made using the following equation: (26)where X, Y, and Z denote the individual agonists (e.g., GABA, 3α5αP, and propofol), and the term Γ is described by eq. 3. The underlying assumptions in eq. 26, that GABA, propofol, 3α5αP, and PS interact with distinct binding sites, are supported by previous observations (Park-Chung et al., 1999; Akk et al., 2001; Ruesch et al., 2012; Shin et al., 2019).
The data indicate that for combinations of GABA + 3α5αP, GABA + propofol, and GABA + 3α5αP + propofol, there is good agreement between the predicted effect of PS and the observed data (Fig. 7B). Overall, the findings demonstrate independence of the actions of GABA, 3α5αP, propofol, and PS in generating steady-state activity.
Discussion
The major goal of this study was to develop a model to analyze steady-state activity in the GABAA receptor. Most subtypes of the GABAA receptor, including the synaptic α1β2γ2 isoform, exhibit marked desensitization during prolonged application of agonist. Although synaptic receptors are most prominently activated phasically during transient increase in GABA in the synaptic cleft, many other GABAergic agents are present chronically in the brain. These include taurine, endogenous neuroactive steroids, and, under clinical conditions, various GABAergic anxiolytic and sedative agents. Furthermore, tonic activation of extrasynaptic receptors by ambient GABA is best described through steady-state activity.
We present and describe the properties of a three-state resting-active-desensitized model (Fig. 1). The RAD model retains salient features of the classic two-state resting-active MWC model, including the concerted nature of state transitions (Forman, 2012; Ehlert, 2014; Steinbach and Akk, 2019). In the two-state model, full description of channel activation is described by four parameters: the extent of unliganded gating that is an inherent property of the receptor, affinity of the resting receptor for agonist, affinity of the active receptor for agonist, and the number of binding sites for the agonist. The additional transition to the desensitized state in the RAD model is defined by a parameter (termed Q in the present study) describing equilibrium between the active and desensitized states. The value of Q can be determined by fitting the concentration-response curve for steady-state activity to eq. 4. Alternatively, for high-efficacy agonists or agonist combinations, Q can be estimated directly from a single high-concentration response using eq. 22.
The fitted value of Q was 0.27 in the concatemeric α1β2γ2L receptor activated by GABA. The value of Q was similar in receptors activated by a saturating concentration of β-alanine (0.24) or when a saturating concentration of GABA was coapplied with propofol (0.29), pentobarbital (0.24), or 3α5αP (0.23). In other words, under conditions in which most receptors are active during the peak response, approx. 4 out of 5 receptors become desensitized once steady-state is reached.
The RAD model contains a single desensitized state. Previous study of the γ-containing GABAA receptor has indicated multiple desensitized/nonconducting states, with desensitization time constants associated with these states ranging from 3 milliseconds to 10 seconds (Bianchi and Macdonald, 2002; Feng et al., 2004; Barberis et al., 2007). It is improbable that the reduction of desensitization to a single high-affinity nonconducting state fundamentally affects the value of Q, which is associated with steady-state open probability and thus not directly dependent on the number of desensitized states.
Previous work has indicated that many GABAA receptor agonists act independently and energetically additively in producing peak currents (Rüsch et al., 2004; Ruesch et al., 2012; Cao et al., 2018; Shin et al., 2019). This means that the actions of each drug in a combination can be considered separately with no necessity to invoke specific interactions between the combined drugs. Independence and additivity also readily enable prediction of peak amplitudes for any combination of agonists. The present study suggests that independence and energetic additivity apply likewise to steady-state currents in the presence of combinations of GABA, the steroid 3α5αP, and propofol.
The steroid PS inhibits the response of the GABAA receptor to GABA, and previous work has suggested that it acts by enhancing the probability that the receptor will be desensitized (Akk et al., 2001; Eisenman et al., 2003). The ability of PS to inhibit can be quantitatively described by the RAD model, assuming that PS binds preferentially to the desensitized state. It is clear that several other possible mechanisms cannot describe this inhibition. For example, it could be that PS binds to a site other than GABA and reduces receptor function by selectively binding to the resting state (Steinbach and Akk, 2019). In this case, PS would be more potent at lower concentrations of GABA, whereas we observed the opposite. An alternative is that PS is an open-channel blocker (i.e., it binds to and inhibits receptors in the A state), although single-channel data do not support this model (Akk et al., 2001). Also, in this case, the potency would decrease when a lower concentration of GABA is used to activate, but the inhibition would be complete at high concentrations of PS, unlike what is observed and shown in Fig. 6.
The RAD model (Fig. 1) can describe the steady-state activity in the presence of combinations of orthosteric and allosteric GABAergic agonists that interact with distinct sites. Furthermore, an extension of the model, expressed through eq. 26, can be used to predict steady-state open probability in the presence of any combination of GABA, 3α5αP, propofol, and PS.
The original MWC and the RAD models have the fundamental aspect that multiple compounds interact to increase or reduce receptor activity by independently making energetic contributions to the stabilization of particular states (resting, active, or desensitized). That is, drugs do not alter basic properties of the receptor (L or Q) nor activation properties of other agents (KX, cX, or NX). Energetic additivity is supported in the wild-type GABAA receptor by studies of agonist combinations (Rusch et al., 2004; Ruesch et al., 2012; Shin et al., 2017; Akk et al., 2018; Cao et al., 2018) and has been observed in some studies comparing the effects of mutations to individual binding sites for anesthetics (Guitchounts et al., 2012; Shin et al., 2018). In contrast, energetic additivity was found notably missing in a recent study that demonstrated that mutations to residues abutting and nonabutting the anesthetic binding sites could reduce anesthetic sensitivity (Szabo et al., 2019). Finally, lack of energetic additivity, and a potential for allosteric interaction between individual sites, have been shown for the two functional binding sites for steroids located in the α subunit and at the β-α interface (Chen et al., 2019). It is perhaps not surprising that structural changes can have allosteric effects in a receptor that clearly has a conformationally plastic structure. In sum, simple schemes with a basis in the concerted transition model can be remarkably successful at quantitative prediction, because mutations or drug-binding events make independent and additive contributions to the energies of particular states.
Authorship Contributions
Participated in research design: Steinbach, Akk.
Conducted experiments: Germann, Pierce, Burbridge.
Performed data analysis: Germann, Pierce, Burbridge, Akk.
Wrote or contributed to the writing of the manuscript: Germann, Pierce, Burbridge, Steinbach, Akk.
Footnotes
- Received April 15, 2019.
- Accepted June 21, 2019.
This work was supported by the National Institutes of Health National Institute of General Medical Sciences [Grant GM108580] and funds from the Taylor Family Institute for Innovative Psychiatric Research.
Abbreviations
- Allopregnanolone
- 3α5αP, 5α-pregnan-3α-ol-20-one
- c
- ratio of the equilibrium dissociation constant of the open receptor to that of the closed receptor
- GABAA receptor
- γ-aminobutyric acid type A receptor
- K
- equilibrium dissociation constant of the closed receptor
- L
- measure of unliganded activity calculated as ratio of resting to active receptors
- MWC model
- Monod-Wyman-Changeux model
- PActive
- probability of being in the active state
- PActive,Peak
- probability of being in the active state during the peak response
- PActive,S.S.
- probability of being in the active state during the steady-state response
- PS
- pregnenolone sulfate
- Q
- measure of desensitization calculated as ratio of active to desensitized receptors
- RAD
- resting-active-desensitized
- Copyright © 2019 by The American Society for Pharmacology and Experimental Therapeutics


