


Abstract
Both synthetic and endogenous glucocorticoids are important pharmaceutic drugs known to bind to the ligand-binding domain (LBD) of glucocorticoid receptor (GR), a member of the nuclear receptor (NR) superfamily. Ligand binding induces conformational changes within GR, resulting in subsequent DNA binding and differential coregulator recruitment, ultimately activating or repressing target gene expression. One of the most crucial coregulators is peroxisome proliferator-activated γ coactivator 1-α (PGC1α), which acts to regulate energy metabolism by directly interacting with GR to modulate gene expression. However, the mechanisms through which PGC1α senses GR conformation to drive transcription are not completely known. Here, an ancestral variant of the GR (AncGR2) LBD was used as a tool to produce stable protein for biochemical and structural studies. PGC1α is found to interact more tightly and form a more stable complex with AncGR2 LBD than nuclear receptor coactivator 2. We report the first high-resolution X-ray crystal structures of AncGR2 LBD in complex with PGC1α and dexamethasone (DEX) or hydrocortisone (HCY). Structural analyses reveal how distinct steroid drugs bind to GR with different affinities by unique hydrogen bonds and hydrophobic interactions. Important charge clamps are formed between the activation function 2 and PGC1α to mediate their specific interactions. These interactions lead to a high level of protection from hydrogen-deuterium exchange at the coregulator interaction site and strong intramolecular allosteric communication to ligand binding site. This is the first structure detailing the GR–PGC1α interaction providing a foundation for future design of specific therapeutic agents targeting these critical metabolic regulators.
SIGNIFICANCE STATEMENT High-resolution structures of AncGR2 LBD bound to DEX and HCY in complex with PGC1α reveal the molecular mechanism of PGC1α binding to AncGR2 LBD as well as the distinct affinities between DEX and HCY binding. Identifying the structural mechanisms that drive drug affinity is of pharmacologic interest to the glucocorticoid receptor field as an avenue to guide future drug design targeting GR-PGC1α signaling, which plays a crucial role in controlling hepatic glucose output.
Introduction
Glucocorticoid receptor (GR) is a ligand-regulated transcription factor that plays key roles in inflammation, metabolism, and immunity (Kadmiel and Cidlowski, 2013). GR consists of a N-terminal domain, a DNA-binding domain, a flexible hinge region, and a C-terminal ligand-binding domain (LBD) (Hollenberg et al., 1985). The highly disordered N-terminal domain is required for full transcriptional activity through ligand-independent interaction with coregulators (Hollenberg and Evans, 1988). The GR DNA-binding domain recognizes both positive and negative glucocorticoid response elements (GREs) to facilitate target gene activation or repression (Weikum et al., 2017a). GR ligands bind to the ligand-binding pocket (LBP) within the LBD and allosterically stabilize the distal activation function-2 (AF-2) region composed of helices 3, 4, and 12. The AF-2 region can interact with different coactivators that contain a conserved LXXLL motif or corepressors that present a conserved LXXX(I/L)XXX(I/L) motif (l-leucine, I-isoleucine, X-any amino acid). Helix 12 in the AF-2 region is termed the activation function helix (AF-H) and can switch between different conformations to favor differential binding to coactivators and corepressors (Kauppi et al., 2003; Schoch et al., 2010).
In response to stress or low blood sugar, the adrenal gland secretes cortisol (also known as hydrocortisone, HCY), a cholesterol-derived glucocorticoid that functions to induce glucose uptake, regulate metabolism, and suppress the immune system (Chrousos, 2009) (Fig. 1A). HCY is clinically used as an anti-inflammatory agent, but this endogenous hormone is rapidly metabolized and drives off-target gene activation via the closely related mineralocorticoid receptor in some tissue. Synthetic glucocorticoids, including triamcinolone acetonide, mometasone furoate, and dexamethasone (DEX), typically have improved therapeutic effects for inflammatory and autoimmune disease compared with HCY. However, both HCY and synthetic glucocorticoids can have adverse side effects when they are used in high doses and for prolonged periods, such as weight gain, Cushing’s syndrome, and osteoporosis. GR-mediated transactivation is believed to be the predominant molecular mechanism involved in the side effects (Schäcke et al., 2002). Designing new dissociated GR ligands that preferentially induce transrepression rather than transactivation to achieve significant clinical benefits with reduced side effects is expected to be the future of corticoid-driven treatment (Schäcke et al., 2005).

DEX binds more tightly to AncGR2 LBD and has higher potency in transactivating GREs than HCY. (A and B) Chemical structures of GR endogenous ligand cortisol/HCY (A) and synthetic ligand DEX (B). Structures show canonical steroid carbon and oxygen atom (in gray circle) numbering. (C) DEX binds to AncGR2 LBD with a tighter Ki than HCY as measured by fluorescence polarization competition with FAM-DEX. (D) DEX transactivates positive GREs with higher potency than HCY. Error bars in both C and D indicate S.D. from three replicates and from three independent experiments.
Peroxisome proliferator-activated γ coactivator 1-α (PGC1α) was first identified as a coactivator for peroxisome proliferator-activated receptor γ (PPARγ) (Puigserver et al., 1998). Since then, PGC1α has been demonstrated to play crucial roles in regulating glucose, lipid, energy metabolism, adaptive thermogenesis, and mitochondrial biogenesis (Knutti and Kralli, 2001; Lin et al., 2005; Boström et al., 2012). Human PGC1α was first found to enhance transcription when treated with a GR agonist. The GR LBD interacts with the N-terminal domain of PGC1α containing a nuclear receptor (NR) interaction motif. Together, these data suggest PGC1α acts as a coactivator for GR (Knutti et al., 2000). A subsequent study found that the expression of PGC1α was strongly induced in the livers of fasting mice or in primary hepatocytes with DEX treatment, indicating its role in controlling hepatic glucose output. Indeed, PGC1α can coactivate both GR and hepatic nuclear factor-4α to increase transcriptional activation of phosphoenolpyruvate carboxykinase, the rate-limiting enzyme in gluconeogenesis (Yoon et al., 2001).
There are only three structural investigations of PGC1α binding to LBDs from two NRs: liver receptor homolog 1 and PPARγ (Li et al., 2008; Mays et al., 2017; Yamamoto et al., 2018). How PGC1α interacts with the GR LBD is still unknown. Soluble expression of human GR (hGR) from Escherichia coli is challenging, and many mutations must be introduced to promote folding and crystallization (Schoch et al., 2010; He et al., 2014). These mutations, identified via random mutagenesis, may not faithfully capture the allostery driven by ligand binding to the wild-type GR (Seitz et al., 2010).
Here we use the reconstructed ancestral GR protein (AncGR2), which represents the ∼420-million-year-old common ancestor of all bony vertebrates including ray- and lobe-finned fish. The sequence of AncGR2 LBD was constructed by maximum likelihood phylogenetics and shares 80% identity and 96% similarity with hGR, with all residues in the LBP conserved (Bridgham et al., 2009) (Supplemental Fig. 1). AncGR2 has been used successfully in prior studies to understand the structural basis of ligands and coregulator binding (Bridgham et al., 2009; Kohn et al., 2012; Weikum et al., 2017b).
We present the first high-resolution structures of AncGR2 LBD with DEX and HCY in complex with PGC1α. Unique charge clamps were identified that may contribute to the recognition of PGC1α by GR, leading to the formation of a more stable complex with strong allosteric communications between ligand and coactivator binding sites.
Materials and Methods
Protein Expression and Purification.
Maltose-binding protein (MBP)-fused ancestrally reconstructed GR LBD (GR2 LBD) with a decahistidine tag was expressed and purified as previously reported with some modifications (Weikum et al., 2017b). Briefly, protein was expressed in E. coli BL21(pLysS) cells by adding 0.3 mM isopropyl-1-thio-d-galactopyranoside (IPTG) and 50 μM DEX or HCY for induction at 16°C overnight. After cells lysis by sonication on ice, his-tagged fusion protein was purified by His-Trap affinity chromatography.
For ligand binding assays, MBP-fused–GR2 LBD was purified by Superdex 200 (S200) size exclusion chromatography (GE Healthcare, Piscataway, NJ) in a buffer containing 20 mM HEPES pH 7.4, 150 mM NaCl, 1 mM EDTA, 5 mM dithiothreitol, and 0.005% Tween-20. For all other assays, the MBP-his tag was removed by recombinant Tobbaco Etch Virus (rTEV) protease cleavage. Undigested fusion protein, cleaved tag, and His-tagged rTEV were separated from the digested AncGR2 LBD by His-Trap affinity chromatography. AncGR2 LBD was further purified by Superdex 75 (S75) size exclusion chromatography (GE Healthcare). Protein was concentrated to 3–5 mg/ml, snap-frozen in liquid nitrogen, and stored at −80°C for later use.
Protein Crystallization, Data Collection, and Structure Determination.
GR2 LBD in 20 mM HEPES (pH 7.4), 200 mM NaCl, and 5% glycerol was concentrated to 4 mg/ml. Crystallization trials were performed by the hanging-drop vapor diffusion method at 16°C using 1 μl of precipitant and 1 μl of protein in the presence of two molar equivalents of PGC1α NR Box 2 peptide (NH2-EEPSLLKKLLLAPA-COO−). Crystals of the AncGR2 LBD–DEX were formed in 0.3 M sodium chloride, 2.6 M sodium formate, and 0.1 M PIPES pH 7.0, whereas AncGR2 LBD–HCY crystals were obtained in 0.05 M sodium thiocyanate, 0.95 M sodium tartrate dibasic dehydrate, and 0.1 M HEPES pH 7.5. Before data collection, the crystals were soaked for 5 seconds in mother liquor containing 25% glycerol and flash-frozen in liquid nitrogen. Diffraction data were collected remotely from the South East Regional Collaborative Access Team (SER-CAT) ID-22 beamline at the Advanced Photon Source (APS) at Argonne National Laboratories at 100 K.
Indexing, integration, and scaling were performed using HKL-2000 (Otwinowski and Minor, 1997). The program Phaser-MR (Adams et al., 2010) was used for molecular replacement using the structure of GR2-Dex-nuclear receptor coactivator 2 (Tif2)-peptide complex (Protein Data Bank [PDB] code 3GN8) as an initial search model (Bridgham et al., 2009). Structure refinement and model building were performed using PHENIX (version 1.12) and COOT (Emsley and Cowtan, 2004). PyMOL (version 1.8.2) was used to visualize structures, perform alignments and generate figures (Schrödinger, LLC, Portland, OR). Hydrogen bonds and hydrophobic contacts were identified by Ligplot (version 4.5.3) (Wallace et al., 1995). Conformational structural analysis was performed using ProSMART (version 0.845) (Nicholls et al., 2014).
Differential Scanning Fluorometry.
Differential scanning fluorometry (DSF) was performed using a StepOne Plus Real Time PCR System (ThermoFisher Scientific, Waltham, MA). AncGR2 LBD in 20 mM Tris (pH 7.4), 300 mM NaCl, and 5% glycerol at 10 μM was used. Protein was incubated with 50 μM DEX or HCY, 50 μM coregulator peptides, and SYPRO orange dye (Sigma-Aldrich, St. Louis, MO) at a final 1:1000 dilution. The peptide sequences used were as follows: Tif2 NR Box 3 (NH2-KENALLRYLLDKDD-COO−), silencing mediator of retinoic acid and thyroid hormone receptor (SMRT) (NH2-TNMGLEAIIRKALMGKY-COO−), and nuclear corepressor (NCoR) ID2 (NH2-DPASNLGLEDIIRKALMGSFDDK-COO−). Temperature scans were performed from 25 to 95°C at a rate of 0.5°C/minute, and fluorescence was monitored using the ROX filter (602 nm). Three technical replicates and three biologic replicates were conducted. The data were normalized and fit to a two-state model with a single transition between native and denatured protein using Boltzmann sigmoidal curve as previously described elsewhere (Weikum et al., 2017b).
Fluorescence Polarization Binding Assays.
N-terminal fluorescein amidite (FAM)-labeled coregulator peptides, with the sequences shown earlier, were used at a final concentration of 50 nM in the assay buffer containing 20 mM HEPES (pH 7.4), 150 mM NaCl, and 5% glycerol. Increasing concentration of GR2LBD was added into labeled peptides with fluorescence polarization signal monitored using a Neo plate-reader (BioTek Instruments, Winooski, VT) at an excitation and emission wavelength of 485 and 528 nm, respectively. Three technical replicates and three biologic replicates (i.e., three separate preparations of protein) were conducted, and the graphs are a compilation of all data collected. Binding data were fit with a one-site specific binding curve [Y = Bmax × X/(Kd + X)] in GraphPad Prism (version 8; GraphPad Software, San Diego, CA).
Competition binding assays were performed using 100 nM MBP-fused GR2LBD in the presence of 12 nM FAM-labeled DEX. Increasing amounts of unlabeled DEX and HCY ligands were added into solution with fluorescence polarization signal recorded as mentioned above. Three technical replicates and three biologic replicates using three separate preparations of proteins were conducted and graphs are a compilation of all data collected. Binding data were fit with one-site Ki-fit curve in GraphPad Prism (version 8; (GraphPad Software).
Hydrogen-Deuterium Exchange–Mass Spectrometry.
Hydrogen-deuterium exchange–mass spectrometry (HDX-MS) was performed using a UPLC HDX system coupled with a Q-Tof Premier mass spectrometer and a robotic autosampler (Waters Corporation, Milford, MA) as previously described elsewhere (Deng et al., 2017). Exchange reaction was initialized by diluting each protein sample (at 2 mg/ml) 1:7 (v/v) into 10 mM phosphate buffer in 99.9% D2O. After 0, 10, 100, 1000, and 10,000 seconds, an equal volume of quenching buffer [100 mM phosphate, 0.5 M tris(2-carboxyethyl) phosphine, 0.8% formic acid, and 2% acetonitrile, pH 2.5] precooled at 1°C was added to stop the exchange reaction. The reactions at each time point were performed in triplicate.
Quenched samples were fragmented by passing through an Enzymate BEH pepsin column (Waters Corporation) and further separated by an in-line C18 UPLC column and analyzed by mass spectrometry. Peptides were identified through database searching of AncGR2 LBD sequence using ProteinLynx Global Server (PLGS). The HDX-MS data were processed in DynamX (version 3.0), and the HDX difference between different states was calculated by comparing the relative fractional uptake for each residue at a given time.
Molecular Dynamics Simulations.
Molecular dynamics simulations were conducted as previously described elsewhere (Mays et al., 2017). Briefly, GR2-HCY, GR2-DEX, GR2-DEX-Tif2, and GR2-DEX-PGC1α complexes were solvated in an octahedral box of TIP3P (transferable intermolecular potential with three points) water with 10 Å buffer surrounding it. Na+ and Cl− ions were added to a final concentration of 150 mM to neutralize the protein. All minimizations and 1000 nanoseconds simulations were performed with Amber18 (Case et al., 2018) using a 2 femtoseconds timestep. All bonds between heavy atoms and hydrogens were fixed with the SHAKE algorithm (Ryckaert et al., 1977).
We took 25,000 evenly spaced frames from each simulation for further analysis. Root mean square fluctuations (RMSF) were calculated on Cα atoms of protein residues for each frame in the trajectory using the initial structure as the reference. Ligand C2 atom and all protein Cα atoms in a system were defined as nodes for dynamical networks analysis. Edges were drawn between a pair of nodes when they were within 4.5 Å for at least 75% of the molecular dynamics simulation trajectory.
Cartesian covariance and correlation between two nodes were calculated using Carma program (Glykos, 2006). The edge distances were derived from pairwise correlations as a measure of communication within the network. Suboptimal paths between ligand and AF-H regions were identified using the Floyd-Warshall algorithm (Floyd, 1962) and subopt program in NetworkView plugin in VMD (Humphrey et al., 1996).
Reporter Gene Assays.
HeLa cells were maintained and passaged in α-minimal essential medium (Life Technologies, Carlsbad, CA) supplemented with 10% stripped FBS (Invitrogen, Carlsbad, CA). Cells grown in 96-well plates were transfected at 70% confluence with 10 ng of GR, 50 ng of 6× GRE firefly luciferase reporter, and 1 ng of Renilla luciferase reporter under the control of the constitutively active pRL-CMV promoter. For transfection, OptiMEM media was used with FuGeneHD (Roche Applied Science, Indianapolis, IN). Twenty-four hours after transfection, the cells were treated with different concentrations of drugs or vehicle (DMSO) in triplicate. The Renilla and firefly luciferase activities were measured 24 hours after drug treatment using the DualGlo kit (Promega, Madison, WI) by a BioTek Instruments Neo plate-reader. Transactivation data were fit with log (agonist) versus response curve in GraphPad Prism version 8 (GraphPad Software).
Results
Higher Affinity for DEX versus HCY Is Preserved in AncGR2.
DEX resembles the classic glucocorticoid structure of HCY differing in three key ways: the A ring contains a C-C double bond between C1 and C2; a fluorine atom is located at C9 in the B ring, and the D ring contains a methyl group (-CH3) at C16 (Fig. 1, A and B). These structural differences enable 2-fold tighter binding of DEX to the AncGR2 LBD versus HCY (Ki = 20 nM [95% confidence interval (CI), 17–26] (20 nM [95% CI, 17–26]) versus 43 nM [95% CI, 36–52]) (Fig. 1C) as measured in a fluorescence polarization–based competitive binding assay. DEX is ∼10-fold more potent than HCY in gene transactivation from a GRE (HCY EC50 1.3 nM vs. Dex EC50 15 nM), which is consistent with previous reports report (He et al., 2014) (Fig. 1D). This is consistent with clinical usage of DEX as a more potent, efficacious, and long-acting drug compared with HCY (Zoorob and Cender, 1998).
High-Resolution Crystal Structures of AncGR2 LBD with Ligands and PGC1α.
Crystallization of human GR is challenging and requires the use GR mutants with enhanced solubility and crystallization properties. We leveraged the ancestrally reconstructed AncGR2, which behaves faithfully in its ligand binding, response, and allostery but shows enhanced expression, solubility, and crystallization (Bridgham et al., 2009; Kohn et al., 2012; Weikum et al., 2017b).
To understand the molecular determinants of PGC1α binding to GR, we determined the X-ray crystal structures of AncGR2 LBD with PGC1α in complex with both DEX and HCY ligands. Both crystals formed in the C2221 space group with one AncGR2 LBD molecule in the asymmetric unit. The structure of AncGR2 LBD–DEX–PGC1α trimeric complex was refined to 1.64 Å (Supplemental PDB File 1) and that of AncGR2 LBD–HCY–PGC1α complex was refined to 1.60 Å (Supplemental PDB File 2) (Table 1). This represents the highest resolution GR LBD-ligand complexes to date, indicating the benefit of using an ancestrally reconstructed sequence variant for crystallography studies (Bledsoe et al., 2002; Suino-Powell et al., 2008; Bridgham et al., 2009; Kohn et al., 2012; He et al., 2014; Weikum et al., 2017b).
Data collection and refinement statistics
Overall, AncGR2 LBD adopts the classic NR/SR structure, consisting of a helical sandwich with three layers, including 11 α helices and four β strands (Fig. 2A). The PGC1α coactivator peptide forms a short α helix and binds to the AF-2 region formed by helix 3, helix 4, and helix 12 (AF-H). Both DEX and HCY ligands occupy in the LBP at the base of AncGR2 LBD, as supported by unambiguous electron density (Fig. 2, B and C). The glucocorticoid ligands make extensive hydrophobic interactions, and the carbonyl O1 on the A ring of the ligand participates in a hydrogen bond network with Gln39 and Arg80 and a structurally conserved water molecule (Supplemental Fig. 2A). Residue Gln111 makes hydrogen bond with hydroxyl O3 on the D ring. Residue Asn33 hydrogen bonds with both hydroxyls O2 and O5. Likewise, residue Thr208 makes two hydrogen bonds with atoms O4 and O5 on the D ring (Fig. 2, D and E).

Crystal structures of AncGR2 LBD with PGC1α in complex with DEX and HCY. (A) Overall structure of AncGR2 LBD with DEX (green) bound to PGC1α (purple), with α-helices shown in light blue, β-strands in yellow, and loops in gray. (B and C) 2Fo-Fc omit electron density map (contoured to 2.0 σ) surrounding DEX (B) and HCY (C) in the LBP. (D and E) Extensive hydrogen bonds (dark blue residues) and hydrophobic interactions (light blue residues) are formed between AncGR2 LBD with DEX (D) and HCY (E).
The AncGR2 LBD HCY-PGC1α and AncGR2 LBD DEX-PGC1α complexes show very little conformational variation. The root mean square deviation (RMSD) between these structures is 0.12 Å out of 212 Cα atoms. The residues in the N-terminal loop, the loops preceding helix 3, between helix 9 and 10, together with the short helix 6 and its surrounding loops are the only regions with high RMSDs (Supplemental Fig. 3A). ProSMART analysis, which compares local structural similarity over a sliding window of seven to nine residues, confirmed high similarity in most structural elements with differences in the areas omitted from the RMSD analysis (Supplemental Fig. 3B) (Nicholls et al., 2014).
Detailed structure comparison between the DEX-bound and HCY-bound AncGR2 LBD complexes provides insight into the molecular determinants of their observed differences in binding affinity and transactivation efficacy. The double bond between C1 and C2 in DEX results in a stronger interaction between the ligands O1 atom and Gln39 (hydrogen bond distance as 3.0 Å in DEX vs. 3.4 Å in HCY) (Fig. 2, D and E). The fluorine atom at C9 of the B ring in DEX makes closer contact to residues Leu32, Phe92, and Met115 than the hydrogen atom in same position in HCY (Supplemental Fig. 2, B and C). Likewise, the additional CH3 group at C16 in DEX makes closer contact to residues Leu201, Phe204, Glu111, and Met115 than the hydrogen atom in same position in HCY (Supplemental Fig. 2, D and E). In contrast to DEX, HCY makes no hydrophobic contacts with aliphatic residues Met115 and Leu201 (Fig. 2, D and E). Taken together, HCY makes weaker hydrogen bonds and fewer hydrophobic contacts versus DEX, explaining the weaker affinity for the AncGR2 LBD.
PGC1α Binds the Holo-GR2 LBD with Affinity Similar to Tif2.
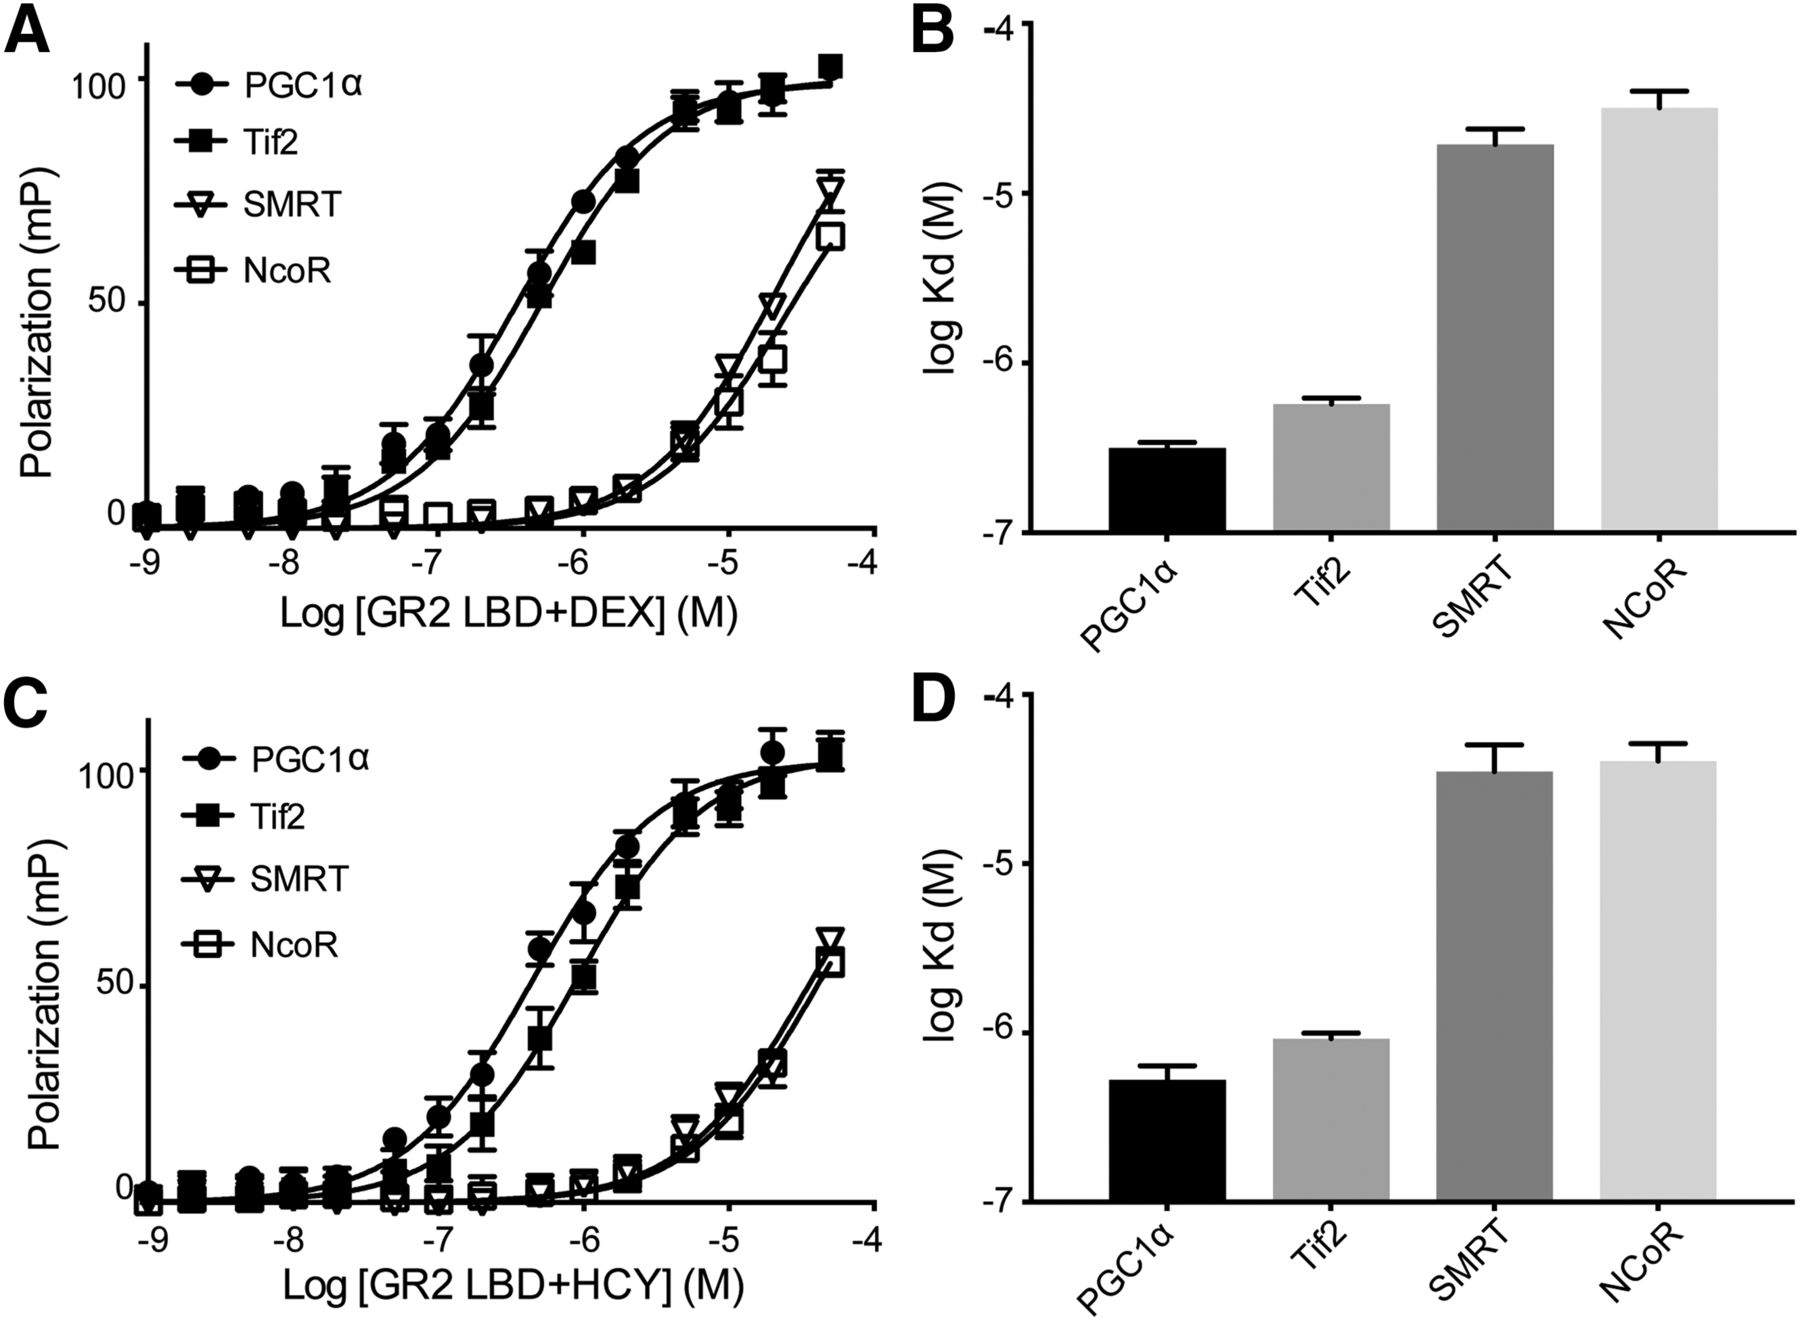
We determined the binding affinities for various FAM-labeled coregulator peptides on AncGR2 LBD–DEX/HCY complexes (Fig. 3). AncGR2 LBD bound slightly better to PGC1α than to Tif2 in complex with either ligand (Kd = 0.31 vs. 0.57 µM in presence of DEX; Kd = 0.52 vs. 0.97 µM in presence of HCY) (Fig. 3, A and C). In line with in cell and in vivo data, HCY induced weaker association with all coregulators tested relative to DEX (Fig. 3, B and D). As expected, AncGR2 LBD–agonist complexes bound to coactivators more tightly than to corepressors (Fig. 3).

Coregulator binding profiles for AncGR2 LBD in complex with ligands. (A and C) AncGR2 LBD with DEX (A) and HCY (C) was titrated into various FAM-labeled coregulator peptides to monitor fluorescence polarization signal changes to determine binding affinities. These data are represented as mean ± S.D. from three replicates and from three independent experiments (B and D). Binding affinities for various coregulator peptides bound to AncGR2 LBD with DEX (B) and HCY (D) are expressed as Kd with 95% CI.
PGC1α Stabilizes AncGR2 LBD More Than Other Coregulators.
Glucocorticoid ligands are known to increase the stability of the GR LBD and therefore are used in its expression and purification (Bledsoe et al., 2002). Here we used DSF-based thermal denaturation to determine the melting temperature (Tm) as a reporter of protein complex stability. We examined AncGR2 LBD’s thermostability in the presence of different ligands and coregulators. The AncGR2 LBD–DEX complex is more stable than the AncGR2 LBD–HCY complex (Tm = 54.5°C vs. 52.5°C, respectively) (Fig. 4, A and C). When the AncGR2 LBD is bound to DEX or HCY, both Tif2 and PGC1α increased the protein stability whereas NCoR and SMRT had no effect (Fig. 4, B and D). Upon coactivator binding, PGC1α stabilizes the complex by 2.5 and 3.3°C more than Tif2 in the DEX-bound and HCY-bound AncGR2 LBD (Tm = 58.5°C vs. 56.0°C; Tm = 57.5°C vs. 54.2°C), respectively (Fig. 4).

Thermostability of AncGR2 LBD bound to DEX and HCY and in complex with different coregulators. (A and C) Thermal unfolding curves of AncGR2 LBD bound to DEX (A) and HCY (C) in presence of coactivators. (B and D) Thermostability for various coregulators bound to AncGR2 LBD with DEX (B) and HCY (D) are expressed as Tm ± S.D. from three replicates and from three independent DSF experiments.
GR2 Recognizes PGC1α by Unique Hydrophobic Contacts and a Secondary Charge Clamp.
Both PGC1α box2 (NH2-141PSLLKKLLLAPA152-COO−) and Tif2 box3 peptides (NH2-742NALLRYLLDKD752-COO−) contain a consensus LXXLL motif and bind to the AncGR2 LBD at the AF-2 site. Residues Val44, Lys45, Leu58, Met62, Gln66, Glu220, and Met221 from AncGR2 LBD form a hydrophobic groove and make hydrophobic interactions with Leu143, Leu144, Leu147, Leu148, Leu149, and Ala152 from PGC1α (Fig. 5A). Comparison of the previously determined AncGR2 LBD–Tif2 structure (PDB 3GN8) shows that all residues except for Leu58 from helix4 are involved in Tif2 recognition groove. Tif2 fails to interact with Leu58 as it contains an Asp750 at the equivalent position of PGC1α Leu149, which would result in a polar incompatibility (Fig. 5B).

Recognition of PGC1α at the AncGR2 LBD AF-2 surface. (A and B) PGC1α (A) and Tif2 (B) bind to the AncGR2 LBD AF-2 and form extensive hydrophobic contacts, with participating residues in LBD colored in yellow. AncGR2 LBD–DEX–PGC1α structure was used for A; AncGR2 LBD–DEX–Tif2 (PDB code: 3GN8) was used for B. (C) Primary charge clamps mediated by Glu224 and Lys48 (shown in blue) hold PGC1α in place. (D) Different primary and secondary charge clamps are formed to mediate the PGC1α (purple) and Tif2 (cyan) binding to AncGR2 LBD.
To hold coactivators in position, SR LBDs form hydrogen bonds with the C- and N-termini of the NR box-containing peptides. These conserved interactions are described as primary charge clamps and are crucial for coregulator recognition. For PGC1α, Glu222 from AF-H forms a hydrogen bond with the amide nitrogen from Leu143. Lys48 from helix 3 recognizes the C terminus of PGC1α by forming hydrogen bonds with backbone carbonyls from Leu147 and Ala150, respectively (Fig. 5C). However, AncGR2 Lys48 in the Tif2 complex structure moves marginally away from its orientation in the PGC1α complex structure and thus only forms one hydrogen bond with Ala50 (Fig. 5D). There is a water-mediated hydrogen bond formed between AncGR2 Gln61 and PGC1α Leu148. This is not observed in the AncGR2 LBD–Tif2 complex structure (Fig. 5D).
The ability of bound coregulators to form a secondary charge clamp has been observed previously for GR, and it appears that PGC1α leverages this mechanism (Bledsoe et al., 2002). As such, an electrostatic interaction is formed between Asp59 in AncGR2 LBD helix 4 and Lys145 in PGC1α. In Tif2, the side chain of Arg746, which is at a position equivalent to PGC1α Lys145, extends away from AncGR2 Asp59 without forming strong favorable electrostatic interaction (Fig. 5D). Thus, both additional hydrophobic and charge-charge interactions are involved in the AncGR2 LBD–PGC1α interaction likely explaining its ability to stabilize AncGR2 to a greater extent than Tif2 (Figs. 3 and 4).
PGC1α Binding Rigidifies Local Dynamics around AF-2 Site of AncGR2 LBD.
Protein dynamics are crucial for enzyme catalysis, ligand recognition, protein allostery, and molecular evolution (Henzler-Wildman and Kern, 2007; Tokuriki and Tawfik, 2009; Motlagh et al., 2014; Liu et al., 2016). Solution-based studies, including nuclear magnetic resonance spectroscopy and HDX coupled with mass spectrometry, allow for measuring protein motions to probe conformational fluctuations that are not readily observed in static crystal structures. NR LBDs in their apo states are known to be dynamic. The equilibrium between subtly different conformational states can be shifted by binding to different ligands and coregulators, which are believed to play important roles in the mechanism of action of NR ligands (Hughes et al., 2012; Kojetin and Burris, 2013).
Here, we employed HDX-MS to investigate the dynamics of AncGR2 LBD with DEX bound to Tif2 and PGC1α. Overall, 108 peptic fragments from AncGR2 LBD were sequenced and mapped for HDX analysis. These peptides covered 96% of the AncGR2 LBD sequence with more than 5-fold redundancy (Supplemental Fig. 4). Residues at both N- and C-terminal regions, residues 140 and 156, are not covered by any peptides (Fig. 6A). We found a high percentage of deuterium uptake in AncGR2 LBD (∼70%), given the 1:7 dilution of H2O-containing solution into D2O. Comparison between Tif2-bound and PGC1α-bound complexes showed decreased deuterium uptake in the PGC1α-bound state. For instance, residues 58–65, 197–203, and 225–233 showed less deuterium uptake in the PGC1α-bound complex than the Tif2-bound complex (Fig. 6B). Mapping these residues onto the structure shows that they are in AF-H, helix 4, and helix 10, all of which are in or adjacent to the AF-2 site (Fig. 6C). This suggests that PGC1α binding produces a higher level of protection from deuterium exchange and thus more pronounced rigidification of the dynamic motions in these regions.

Differential HDX-MS of AncGR2 LBD–DEX bound to Tif2 and PGC1α. (A) Heat maps of deuterium uptake for AncGR2 LBD–DEX bound to Tif2 and PGC1α. Different time points of LBD incubation in D2O before measuring deuterium uptake are indicated on the left. (B) Three representative HDX plots of peptic fragments from Tif2-bound and PGC1α-bound AncGR2 LBD. (C). Differential HDX are mapped on the structure of AncGR2 LBD in complex with DEX. Residues are colored in a continuous gradient from blue to red, with their intensity scaling to the difference in percentage of deuterium exchange [(PGC1α-bound) − (Tif2-bound)]. Residues not covered by any peptides are shown in black.
Interestingly, some residues in helices 8 and 9 as well as the β4 strand are more flexible in the PGC1α-bound state than the Tif2-bound state. However, these differences are subtle compared those in the AF-2 site. Overall, the PGC1α-bound complex shows more dampened local dynamics, primarily at the AF-2 site, than Tif2-bound complex, which is in accordance with the higher global thermostability of the PGC1α-bound complex (Fig. 4).
Allosteric Communication between Steroid Ligand and AF-H.
Molecular dynamics (MD) simulations were performed to analyze conformational dynamics and allostery within the AncGR2 LBD complexes. During the entire 1-microsecond simulation, all AncGR2 LBD molecules were characterized by stable RMSDs of less than 2 Å (Supplemental Fig. 5, A and B). RMSFs were calculated on Cα atoms to measure the protein flexibility. Unsurprisingly, residues at both the N and C termini show the largest RMSFs. Moreover, loops before helix 3, between helix 9 and 10, and regions around the short helix 6 display larger RMSFs than the rest of the protein (Fig. 7, A and B). This is consistent with RMSD and ProSMART analyses mentioned previously.
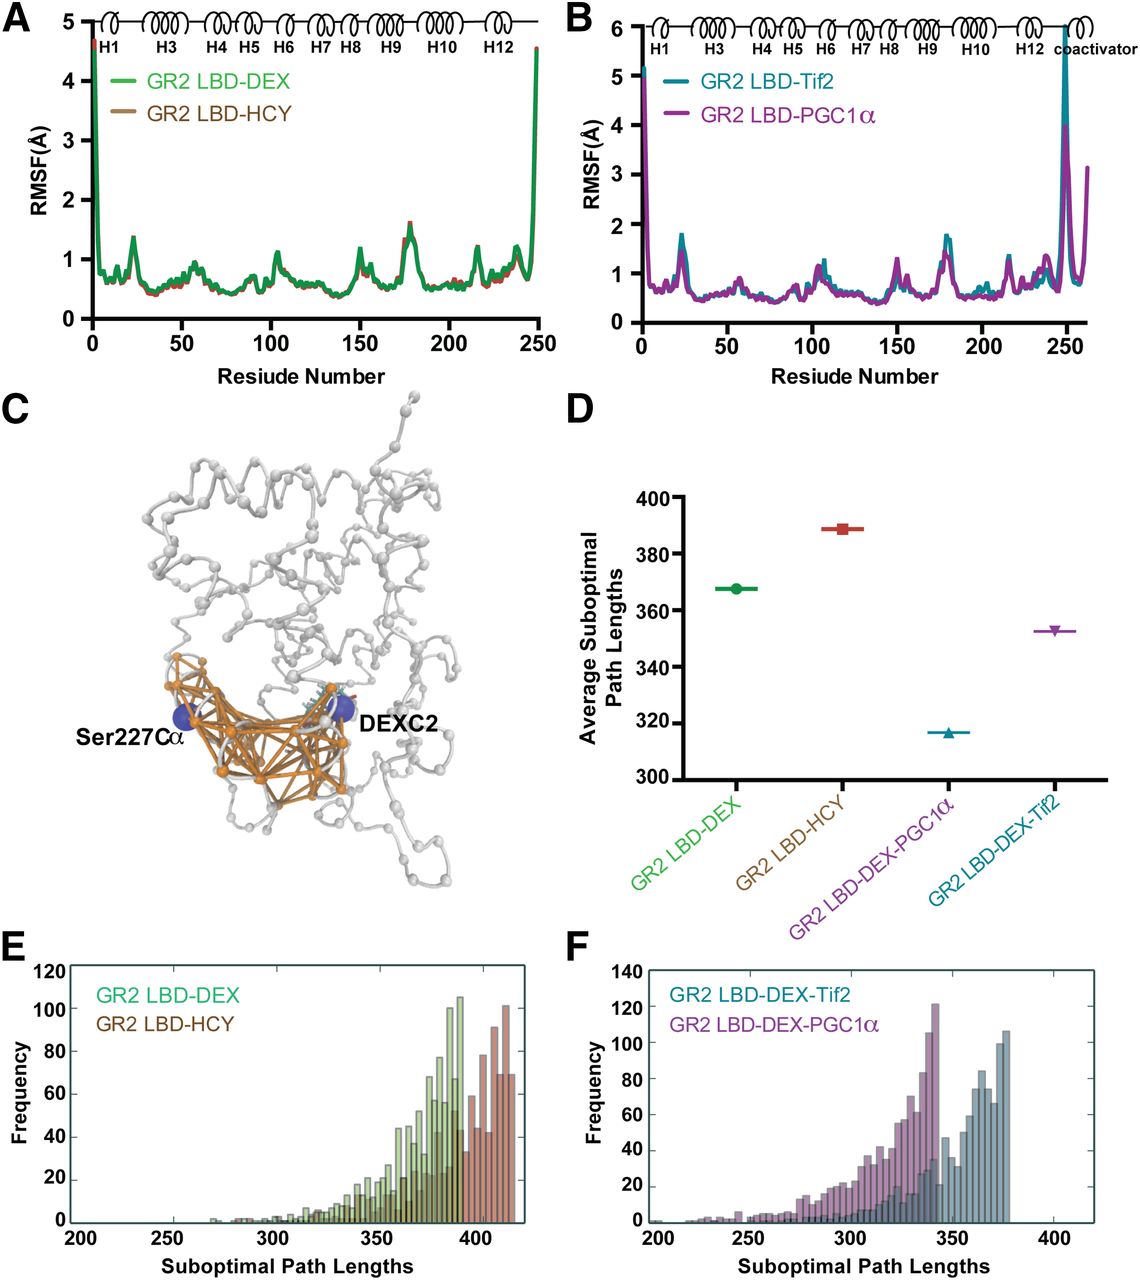
Allosteric communication between ligand and AFH. (A and B) Cα root RMSF plots of simulations of AncGR2 LBD with ligands (A) and AncGR2 LBD DEX in complex with coactivators (B). (C) Suboptimal paths connecting nodes Ser227 and ligand (both shown in blue) with edges (shown in orange) displayed. The other nodes in the protein are shown in gray. (D–F) Average values (D) and histograms (E and F) of top 1000 shortest suboptimal paths in AncGR2 with ligands (E) and AncGR2 LBD DEX in complex with coactivators (F).
We combined dynamical network analysis with the MD simulations to compare the strength of allosteric communication between the ligand and AFH. To construct the network, all protein Cα atoms and the ligand C2 atom were defined as nodes, and a pair of nodes were connected by edges if they have satisfied a given distance requirement (<4.5 Å) for at least 75% of the simulation time (Fig. 7C). Edge distance is derived from and inversely proportional to the pairwise correlations between two nodes across the simulation trajectory. Therefore, short distances represent strongly correlated nodes, whereas long distances indicate weak correlations between two nodes (Bowerman and Wereszczynski, 2016). Here, we selected the bound ligand and residue Ser227, located in the middle of AF-H, as two nodes to study GR allosteric communication (Fig. 7C). We identified the optimal (shortest) paths and the top 1000 suboptimal (longer) paths connecting these nodes. These analyses reveal that AncGR2 LBD–HCY has longer path lengths than AncGR2 LBD–DEX, and thus weaker allosteric communication (Fig. 7, D and E).
Both Tif2 and PGC1α binding to the AF-2 region result in shorter suboptimal path lengths; however, PGC1α causes shorter suboptimal path lengths, indicating that its binding strengthens communication between ligand and AF-H more than Tif2 (Fig. 7, D and F). Residues in LBP, AF-H, and identified allosteric paths connecting these sites, such as Gly36, Asn33, Ile225, Pro219, Leu222, and Gln228, are highly conserved between hGR and AncGR2 LBDs (Fig. 7C; Supplemental Fig. 1). Thus, the allosteric communication patterns observed here should be conserved in hGR LBD.
Discussion
Cortisol was identified as the endogenous glucocorticoid hormone nearly a century ago (Kendall, 1951). Since then, it has been clinically used to decrease immune response and inflammation. Later, the U.S. Food and Drug Administration approved DEX, a more potent synthetic glucocorticoid used for the treatment of asthma, rheumatoid arthritis, and other inflammatory conditions and allergic states. Both drugs target the GR LBD and drive agonist response. Here, we set out to comprehensively compare HCY and DEX using the ancestral AncGR2 LBD. We confirmed that DEX is more potent in vitro with a 2-fold lower Ki value than HCY when binding to AncGR2 LBD.
A previous study using a 3H radioactive labeling-based competition assay found an almost 10-fold difference in Ki values for the human receptor (He et al., 2014). The assays were performed differently: we used fluorescence-based techniques and purified AncGR2 LBD, whereas He et al. (2014) used GR-containing cell cytosol; this likely explains the differential observations in binding constants. We show that HCY has approximately 10-fold less potency than DEX in a luciferase-based reporter assay, which is consistent with previous findings for the human receptor. Along with this difference in affinity and potency, the AncGR2 LBD–HCY complex is less stable than it with DEX. When DEX is bound, AncGR2 LBD can recruit coactivators, such as Tif2 and PGC1α, with tighter binding affinities versus HCY. MD simulations and dynamic network analysis found stronger communication between the LBP and AF-H when DEX in bound, which is the potential underlying mechanism for better coactivator binding.
Structural comparison between these two agonists in complex with AncGR2 LBD reveals different interactions stemming from differences in their chemical structure and how these interactions are preserved in AncGR2 and extant GR LBDs. The fluorine and methyl moieties in DEX exables more extensive and closer contacts to the receptor versus HCY. A previous structural study at 2.5 Å resolution found that both Arg and Gln residues in the LBP made hydrogen bonds with carbonyl O1 from HCY. A specific additional water molecule, which was not observed in the DEX complex structure, was required to hold the HCY A-ring in position (He et al., 2014). However, this water molecule and water-mediated hydrogen bond network are found in both HCY and DEX complex structures presented here. Moreover, this water is also found to form hydrogen bonds with carbonyl O1 in the structures of AncGR2 LBD–triamcinolone acetonide and AncGR2 LBD–mometasone furoate complexes (Kohn et al., 2012; Weikum et al., 2017b). Together, these data indicate a general mechanism of having a water molecule in the Arg80- and Gln39-mediated hydrogen bond network to orient the A-ring and recognize O1, which is not unique to the HCY binding.
In our ∼1.6 Å resolution structures, we found the A-ring in HCY is extended farther away from Gln39 and causes a weaker hydrogen bond relative to DEX, which contains an A-ring double bond. This tighter hydrogen bond works in concert with increased hydrophobic contacts enabled by the C9 fluorine atom, and the C16 methyl group in DEX likely contributes the most to its enhanced binding affinity. Importantly, using the AncGR2 LBD helps to generate higher resolution structures than hGR LBD (1.6 Å vs. 2.5 Å), which in turn provides us with a better understanding of the structural mechanism of glucocorticoid ligand binding and thus better support for rational drug design in the future.
PGC1α plays pivotal roles in controlling mitochondrial biogenesis, glucose uptake, fatty acid oxidation, and metabolism of reactive oxygen species (Lin et al., 2002; Handschin and Spiegelman, 2006; Scarpulla et al., 2012). It acts through coactivating many nuclear receptors including PPARγ, GR, thyroid hormone receptor, and the farnesoid X receptor (Shin et al., 2003; Zhang et al., 2004; Lin et al., 2005). PGC1α has long been known as a GR-coactivator (Knutti et al., 2000); however, the structural basis for the PGC1α–GR LBD had not to be explored.
Our structural investigation found several unique interactions formed between AncGR2 LBD and PGC1α, including the electrostatic interaction mediated by Asp59. This interaction helps to recognize the residue Lys145, which is located in the middle of the conserved LXXLL motif. Previous studies found that Lys145 can be recognized by Asn312 in PPARγ LBD (PDB code:3CS8) (Li et al., 2008). Structural comparison between GR and PPARγ in complex with PGC1α shows that PPARγ Asn312 aligns with AncGR2 Asp59 (Supplemental Fig. 6). This indicates a general mechanism of accommodating a charged residue in the middle of the conserved LXXLL motif by electrostatic interaction. Mutations acting to disrupt this interaction were shown to significantly impair the PGC1α-mediated transactivation (Li et al., 2008). Interestingly, primary charge clamps, in particular the one formed with backbone amide group in Leu143, play a less significant role in PGC1α binding and transactivation in thyroid hormone receptor and PPARγ signaling (Wu et al., 2003, 2002). These results further highlight the crucial role of a secondary charge clamp in recognizing PGC1α by various NR LBDs.
Accession Numbers.
The atomic coordinates and structure factors have been deposited in the Protein Data Bank with the accession numbers 6NWK and 6NWL for AncGR2 LBD DEX-PGC1α complex and for AncGR2 LBD HCY-PGC1α complex, respectively.
Acknowledgments
Special thanks to Dr. C. Denise Okafor for her detailed guidance in performing simulations and data analysis. The authors want to thank the HDX-MS core in School of Medicine, Emory University for their technical assistance in data collection and analysis. X-ray data were collected at Southeast Regional Collaborative Access Team (SER-CAT) 22-ID beamline at the Advanced Photon Source, Argonne National Laboratory. Supporting institutions may be found at www.ser-cat.org/members/html. Use of the Advanced Photon source was supported by the U.S. Department of Energy, Office of Science, Office of Basic Energy Sciences, under Contract No. W-31-109-Eng-38.
Authorship Contributions
Participated in research design: Liu, Ortlund.
Conducted experiments: Liu, Wang.
Performed data analysis: Liu, Wang, Ortlund.
Wrote or contributed to the writing of the manuscript: Liu, Ortlund.
Footnotes
- Received April 3, 2019.
- Accepted July 30, 2019.
This work was supported by the National Institutes of Health [Grant R01DK115213] and W. M. Keck Foundation Medical Research Grant (to E.A.O.). X.L. was supported by an American Heart Association postdoctoral fellowship [17POST33660110].
↵
 This article has supplemental material available at molpharm.aspetjournals.org.

Abbreviations
- AF-2
- activation function 2
- AF-H
- activation function helix
- AncGR2
- ancestral variant of the glucocorticoid receptor 2
- CI
- confidence interval
- DEX
- dexamethasone
- FAM
- fluorescein amidite
- DSF
- differential scanning fluorometry
- GR
- glucocorticoid receptor
- GRE
- glucocorticoid response element
- HCY
- hydrocortisone
- HDX
- hydrogen-deuterium exchange
- HDX-MS
- hydrogen-deuterium exchange mass spectrometry
- hGR
- human glucocorticoid receptor
- LBD
- ligand-binding domain
- LBP
- ligand-binding pocket
- MBP
- maltose-binding protein
- MD
- molecular dynamics
- NCoR
- nuclear corepressor
- NR
- nuclear receptor
- PDB
- Protein Data Bank
- PGC1α
- peroxisome proliferator-activated γ coactivator 1-α
- PPARγ
- peroxisome proliferator-activated receptor γ
- RMSD
- root mean square deviation
- RMSF
- root mean square fluctuation
- SMRT
- silencing mediator of retinoic acid and thyroid hormone receptor
- Tif2
- nuclear receptor coactivator 2
- Tm
- melting temperature
- Copyright © 2019 by The American Society for Pharmacology and Experimental Therapeutics


