


Article Figures & Data
Figures
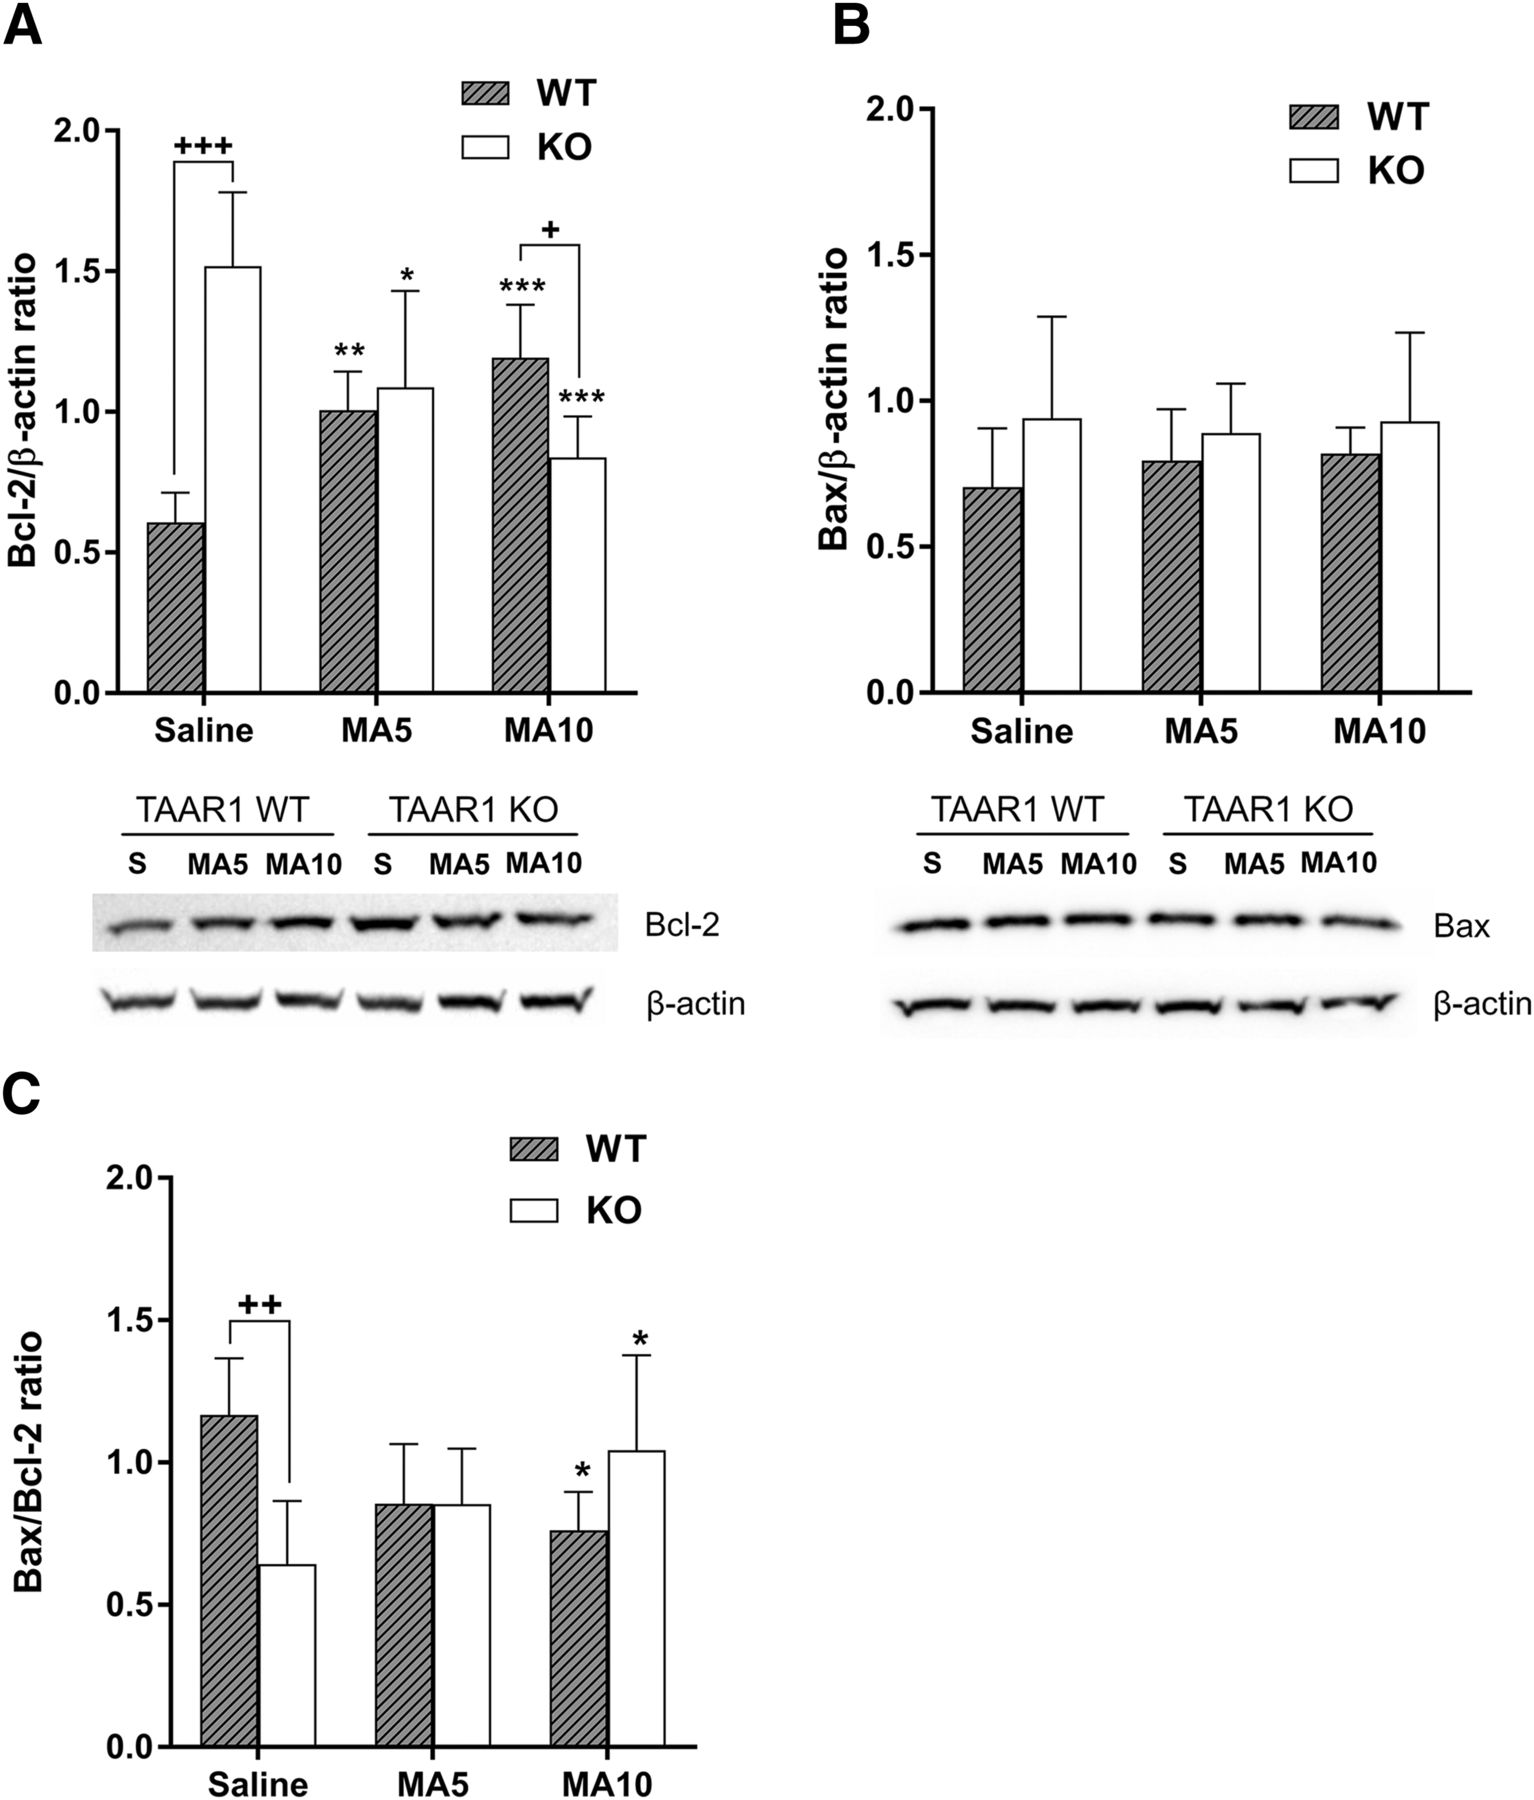
- Fig. 1.
MA upregulated Bcl-2 protein expression in the midbrain of Taar1 WT mice at 24 hours postinjection, but not in Taar1 KO mice. (A) Basal (saline-injected) Bcl-2 expression was significantly higher in Taar1 KO compared with Taar1 WT mice, and MA dose dependently decreased Bcl-2 expression in Taar1 KO mice and increased Bcl-2 expression in Taar1 WT mice compared with saline-injected animals. The Bcl-2 levels were reduced in Taar1 KO mice at the 4 × 10 mg/kg dose of MA compared with Taar1 WT mice. Bcl-2 levels were analyzed by two-way ANOVA. There was a significant genotype × treatment interaction [F(2,35) = 30.74; P < 0.0001], N = 6 to 7/genotype/treatment. (B) Bax protein levels were not different between the genotypes and were not affected by MA treatment. (C) The Bax/Bcl-2 ratio was significantly higher in the midbrain of saline-injected Taar1 WT mice compared with Taar1 KO mice. There was a significant genotype × treatment interaction [F(2,36) = 11.74; P < 0.001] for the Bax/Bcl-2 ratio. Additionally, MA dose dependently increased the Bax/Bcl-2 ratio in Taar1 KO mice, but decreased the ratio in WT mice. *P < 0.05; **P < 0.01; ***P < 0.001 vs. saline, +P < 0.05; ++P < 0.01; +++P < 0.001 between genotypes. Data are mean ± S.D.
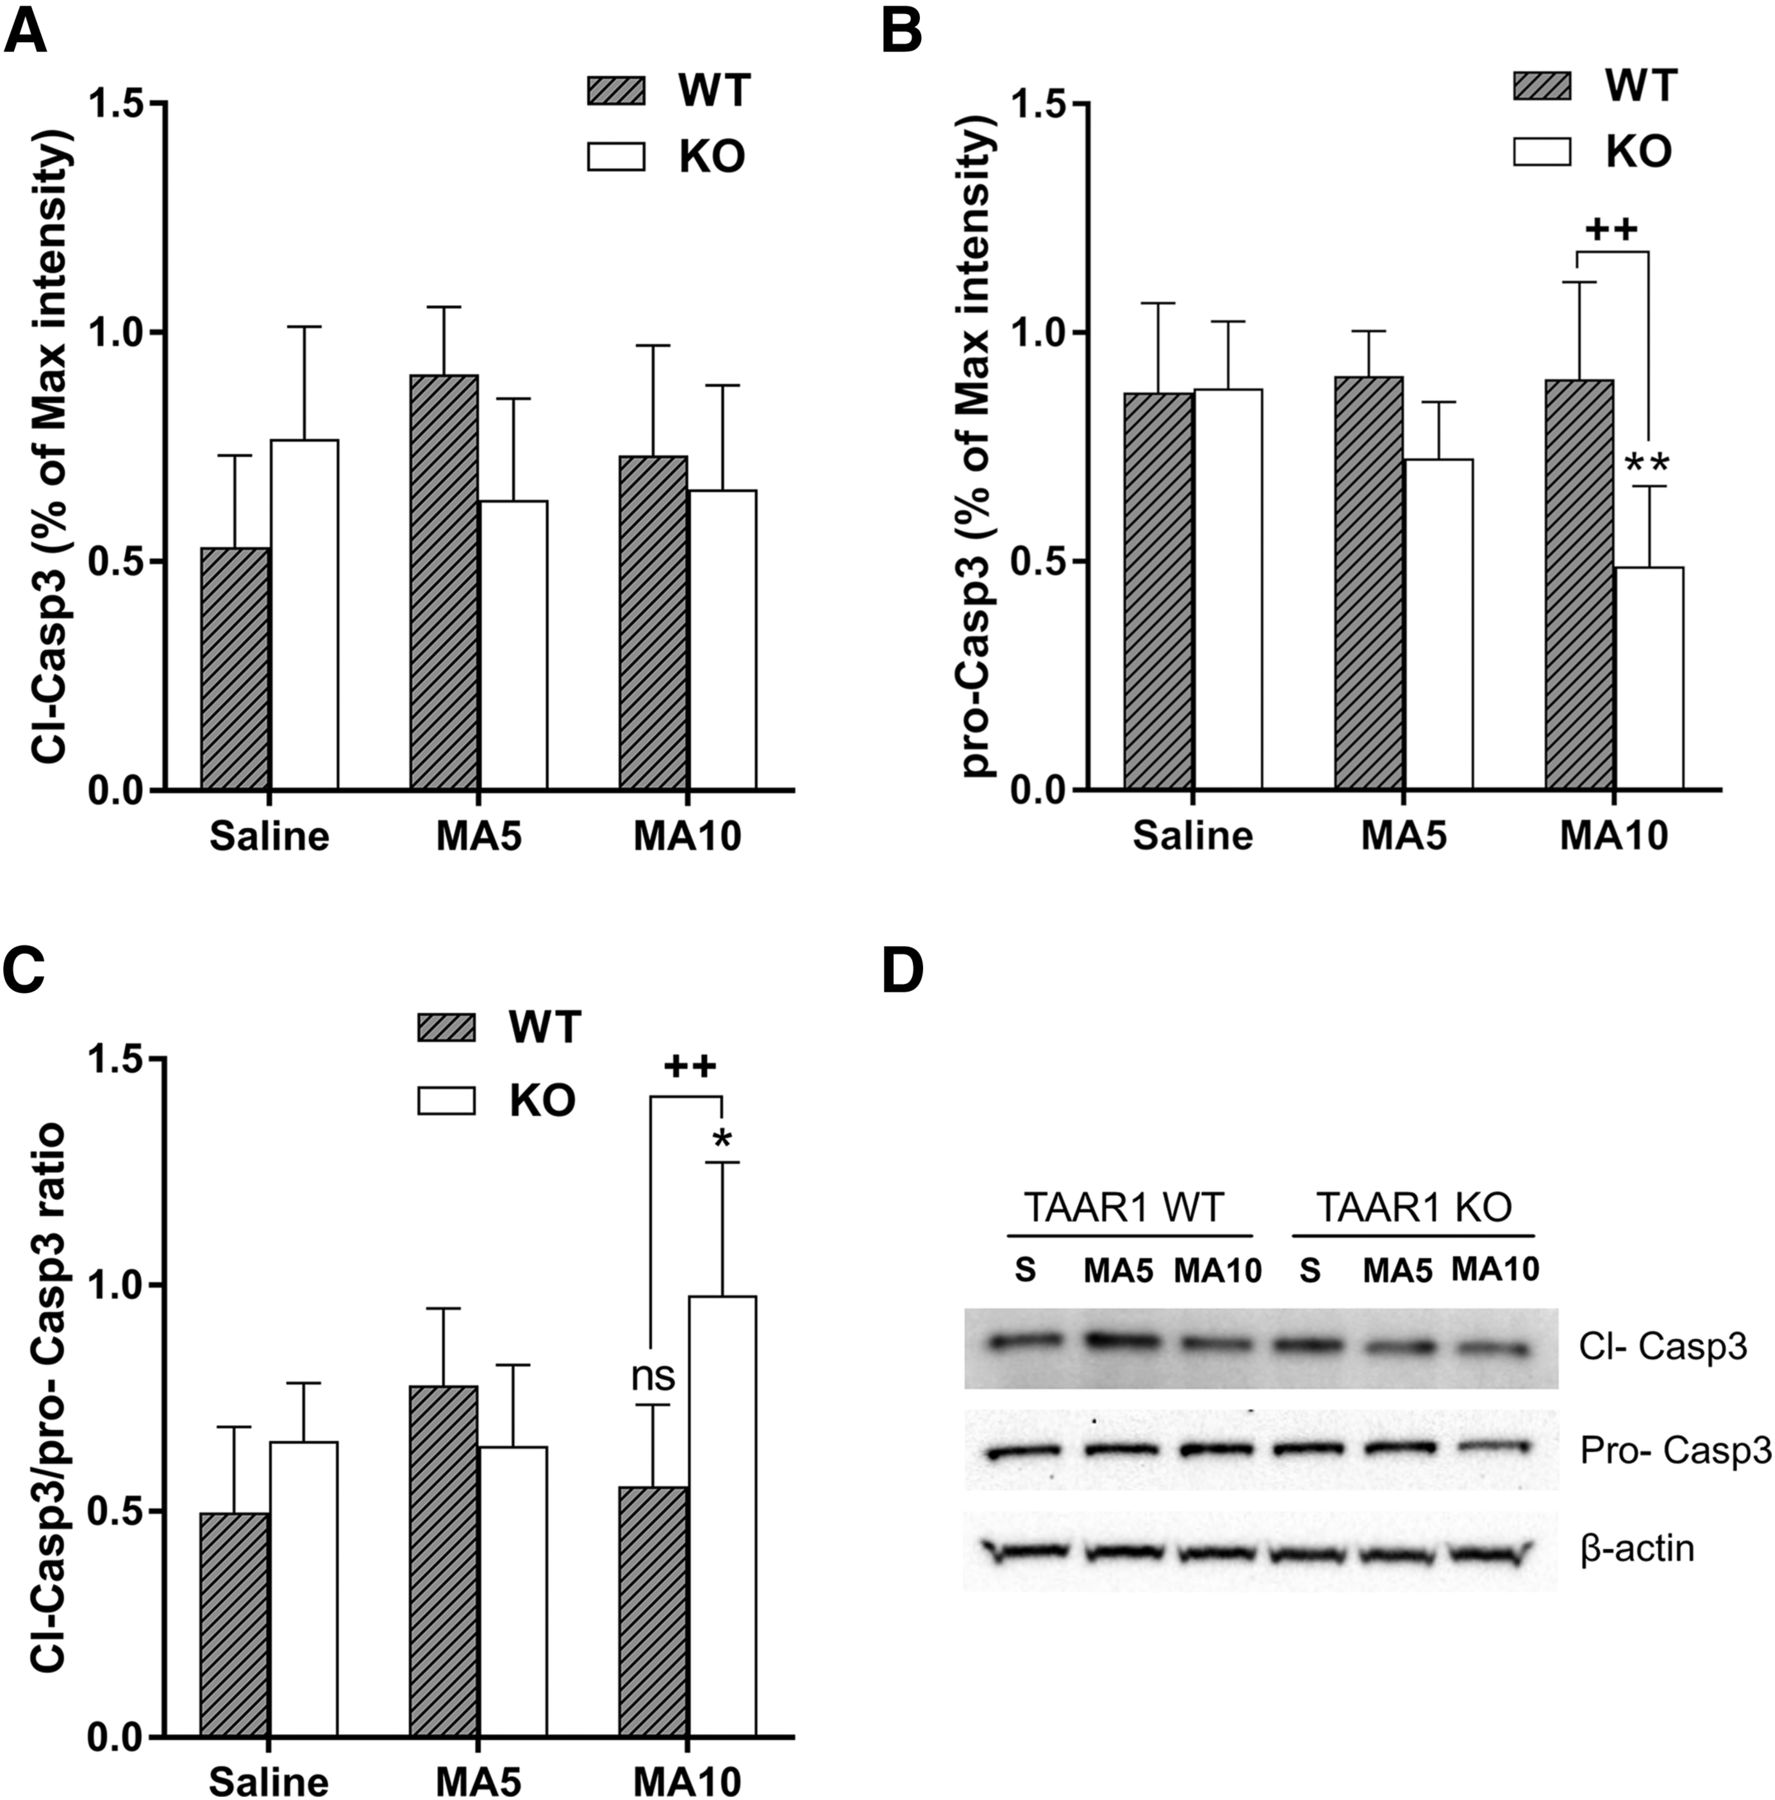
- Fig. 2.
The expression of cleaved caspase 3 (Cl-Casp3) and full-length caspase 3 (pro-Casp3) in the midbrain of Taar1 WT and KO mice at 24 hours after MA administration. (A) The expression of Cl-Casp3 was not different between saline- and MA-injected mice or genotypes. (B) However, pro-Casp3 in Taar1 KO mice was decreased after 10 mg/kg MA treatment. (C) The ratio of Cl-Casp3/pro-Casp3 was significantly higher in Taar1 KO mice after 4 × 10 mg/kg MA administration compared with saline-injected controls and MA-injected WT mice. There was a genotype × treatment interaction [F(2,35) = 6.723; P < 0.01]. N = 6 to 7/genotype/treatment. (D) Representative blots showing the expression levels of Cl-Casp3, pro-Casp3, and the internal control, β-actin. *P < 0.05; **P < 0.01 vs. saline, ++P < 0.01 between genotypes. Data are mean ± S.D.
- Fig. 3.
TAAR1 agonist RO5166017 increased Bcl-2 levels, but not Bax levels in HEK293 cells stably expressing mTAAR1. (A) RO5166017 dose dependently stimulated cAMP production in HEK-mTAAR1 cells. (B) Representative time course of RO5166017 treatment. Nontransfected or HEK-mTAAR1 cells were harvested 0, 2, 4, 6, and 18 hours after treatment with 100 nM RO5166017 (RO). Bcl-2, Bax, and the internal control, β-actin, were measured by western blot. (C) RO5166017 increased Bcl-2 levels in cells stably expressing mTAAR1 in a time-dependent manner; however, there was no agonist-induced regulation of Bcl-2 in nontransfected HEK293 cells. For Bcl-2, two-way ANOVA indicated an interaction between time × cell type [F(4,28) = 7.165, P < 0.001]. (D) Bax expression was not changed in nontransfected HEK293 or HEK-mTAAR1 cells. (E) The ratio of Bax/Bcl-2 was significantly lower in HEK-mTAAR1 cells than in nontransfected HEK293 cells. For the Bax/Bcl-2 ratio, there was a significant interaction between time × cell type [F(4,28) = 5.546, P < 0.01] by two-way ANOVA. Data shown represent the average of independent experiments, each time point conducted in duplicate. **P < 0.01; ***P < 0.001 vs. time (0 hour), +P < 0.05; +++P < 0.001 between two cell lines. Data are mean ± S.D.
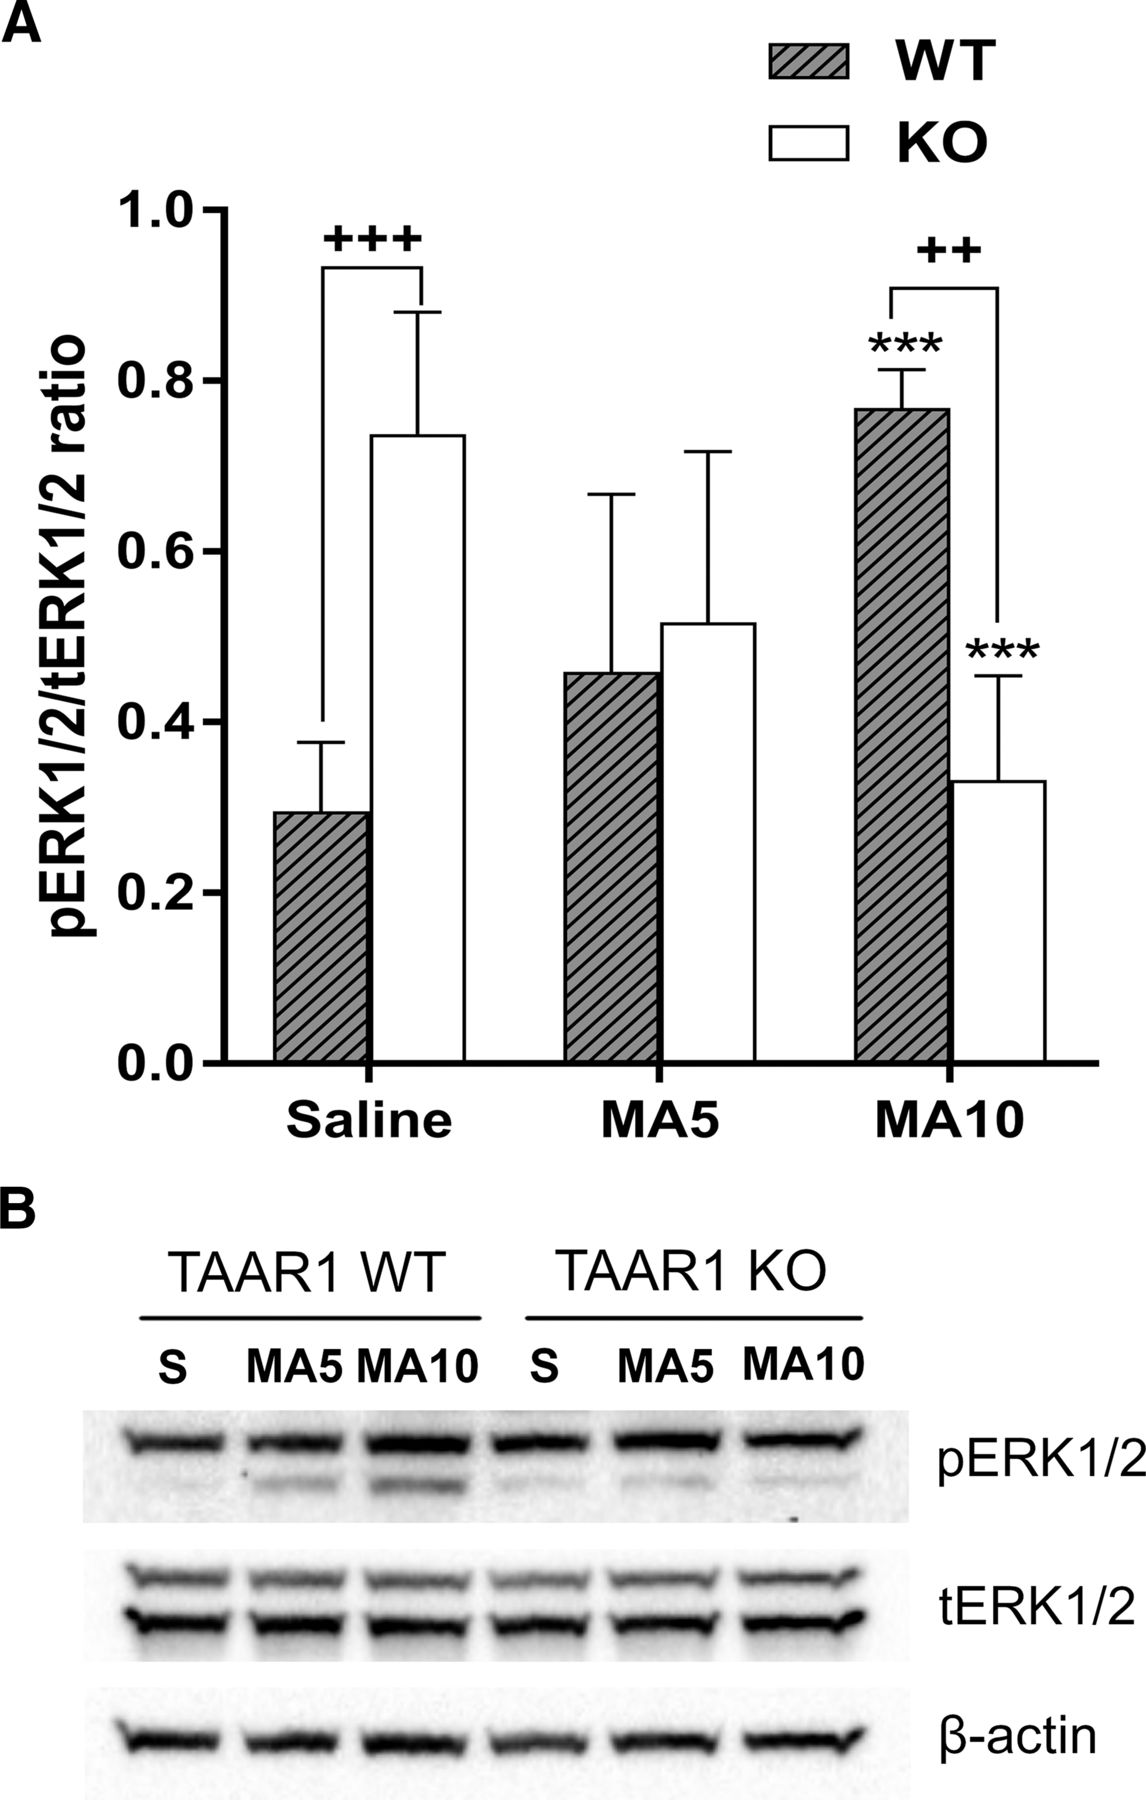
- Fig. 4.
MA upregulated ERK activation in the midbrain of Taar1 WT mice at 24 hours postinjection, but reduced ERK activation in Taar1 KO mice. (A) Basal (saline-injected) pERK expression was significantly higher in Taar1 KO compared with Taar1 WT mice, and MA dose dependently increased ERK activation in Taar1 WT mice and decreased ERK activation in Taar1 KO mice compared with saline-injected animals. The levels of pERK1/2 were reduced in Taar1 KO mice at the 4 × 10 mg/kg dose of MA compared with WT mice. **P < 0.01; ***P < 0.001 vs. saline, ++P < 0.0l +++P < 0.001 between genotypes. For pERK/total ERK (tERK), there was an interaction between genotype × treatment [F(4,34) = 16.44, P < 0.0001] by two-way ANOVA. N = 6 to 7/genotype/treatment. (B) Representative gels of protein levels. Data are mean ± S.D.
- Fig. 5.
Activation of TAAR1 stimulated the phosphorylation of ERK1/2. (A) Nontransfected HEK293 or HEK-mTAAR1 cells were stimulated with 100 nM RO5166017, and pERK1/2 and phosphorylated AKT (pAKT) levels were measured at 0, 2, 4, 6 and 18 hours by western blot. (A) Representative gels of protein levels. (B) pERK1/2 levels were higher at 4 and 6 hours in cells expressing mTAAR1. For pERK/total ERK (tERK), there was an interaction between time × cell line [F(4,19) = 4.508, P < 0.01]. (C) The agonist had no effect on AKT phosphorylation at ser473, but stimulated the phosphorylation at Thr308 (D and E). One-way ANOVA indicated an increase in the activation of AKT Thr308 in HEK-mTAAR1 cells at 18 hours compared with 0 hour (*P < 0.05). Nontransfected HEK293 cells lacked agonist-induced ERK1/2 or AKT activation. (F) Nontransfected HEK293 or HEK-mTAAR1 cells were serum starved for 3 hours and then pretreated with 10 μM EPPTB for 45 minutes before 30-minute incubation with 100 nM RO5166017. Data shown in (B, C, and E) represent the average of at least three independent experiments, with each time point conducted in duplicate. Data are mean ± S.D. *P < 0.05; **P < 0.01 vs. vehicle control or 0 hour, +P <0.05; ++P < 0.01 between two cell lines.
- Fig. 6.
TAAR1 stimulated Bcl2 levels through the ERK1/2 pathway. Nontransfected HEK293 or HEK-mTAAR1 cells were pretreated with 10 µM of U0126 for 1 hour before RO5166017 treatment. TAAR1 agonist-stimulated ERK activation and Bcl-2 expression were measured at 18 hours. (A) Representative gels of protein levels. (B) Pretreatment with U0126 blocked RO5166017-induced pERK1/2 levels in both cell lines. For pERK/total ERK (tERK), two-way ANOVA indicated that there was an interaction between treatment × cell line [F(3,16) = 214.1, P < 0.0001]. (C) Blocking ERK activation with U0126 prevented RO5166017-induced changes in Bcl-2 levels. For Bcl-2, there was an interaction between treatment × cell line [F(3,16) = 6.058, P < 0.01] by two-way ANOVA. *P < 0.05, vs. vehicle control, +P < 0.05, +++P < 0.001 between cell lines: !P < 0.05 agonist vs. agonist + U0126. Data shown in (B and C) represent the average of at least three independent experiments, with each time point conducted in duplicate. Data are mean ± S.D.
- Fig. 7.
TAAR1-stimulated Bcl-2 levels were blocked by EPPTB (EP). (A) Nontransfected or HEK-mTAAR1 cells were pretreated with 10 µM EPPTB for 2 hours, and then stimulated with 100 nM RO5166017 (RO). Representative gels of protein levels are shown. (B) No ERK activation or Bcl-2 changes were observed in nontransfected cells. However, RO5166017-induced ERK activation or increased Bcl-2 levels were abolished by EPPTB pretreatment. (C) For Bcl-2, there was an interaction between treatment × cell line [F(3,16) = 4.183, P < 0.05] by two-way ANOVA. Post hoc test following one-way ANOVA indicated significantly increased Bcl-2 following RO5166017 treatment compared with vehicle control, RO/EP, and EPPTB alone by one-way ANOVA. No significant difference between RO/EP or EPPTB alone compared with vehicle control. *P < 0.05; **P < 0.01 vs. vehicle control, !P < 0.05 agonist vs. agonist + EPPTB. Data shown represent the average of three independent experiments, each time point conducted in duplicate. Data are mean ± S.D.; tERK, total ERK.
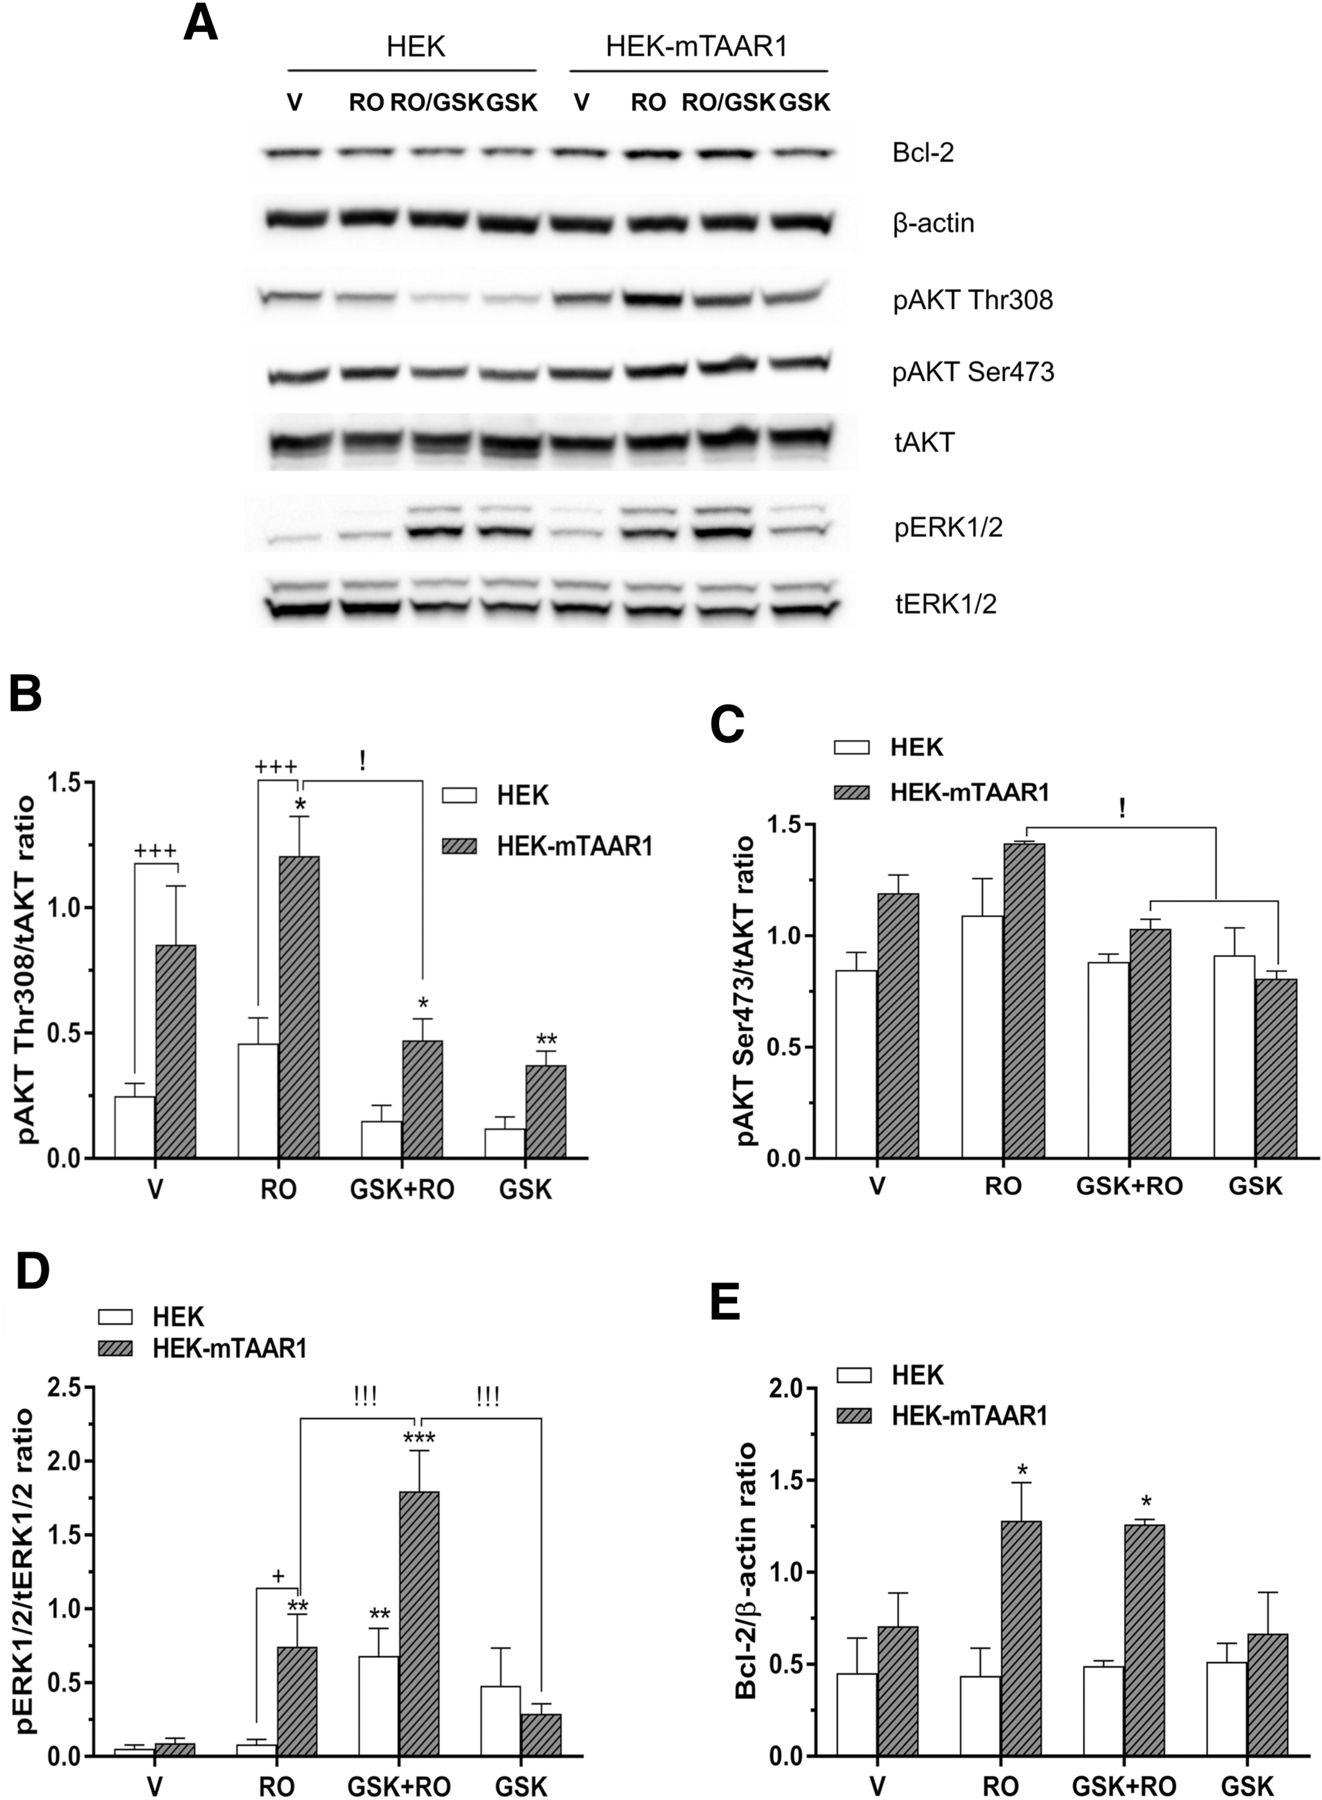
- Fig. 8.
Inhibition of AKT phosphorylation did not block TAAR1-induced Bcl-2 levels. Nontransfected or HEK-mTAAR1 cells were pretreated with 1 µM GSK2334470 (GSK) for 90 minutes, and then stimulated with 100 nM RO5166017 (RO) for 18 hours. ERK, AKT, Bcl-2, and internal control (β-actin) levels were measured by western blot. (A) Representative gels of protein levels. (B and C) GSK2334470 blocked the AKT phosphorylation at Thr308, but not at Ser473. For phosphorylated AKT (pAKT) Thr308/total AKT (tAKT), there was an interaction between treatment × cell line [F(3,16) = 6.103, P < 0.01] by two-way ANOVA. However, blocking AKT phosphorylation resulted in further increases in ERK1/2 levels in both cell lines (D). For pERK/total ERK (tERK), two-way ANOVA indicated an interaction between treatment × cell line [F(3,16) = 18.5, P < 0.0001]. Inhibiting of AKT phosphorylation did not block RO5166017-induced Bcl-2 levels (E). For Bcl-2, there was an interaction between treatment × cell line [F(3,16) = 7.633, P < 0.01] by two-way ANOVA. Post hoc test following two-way ANOVA indicated increased Bcl-2 following RO5166017 or GSK + RO treatment compared with vehicle control, but not GSK alone. *P < 0.05; **P < 0.01; ***P < 0.001 vs. vehicle control, +P < 0.05; +++P < 0.001 between two cell lines. !P < 0.05 agonist vs. agonist + GSK or GSK alone. Data shown represent the average of three independent experiments, each time point conducted in duplicate. Data are mean ± S.D.
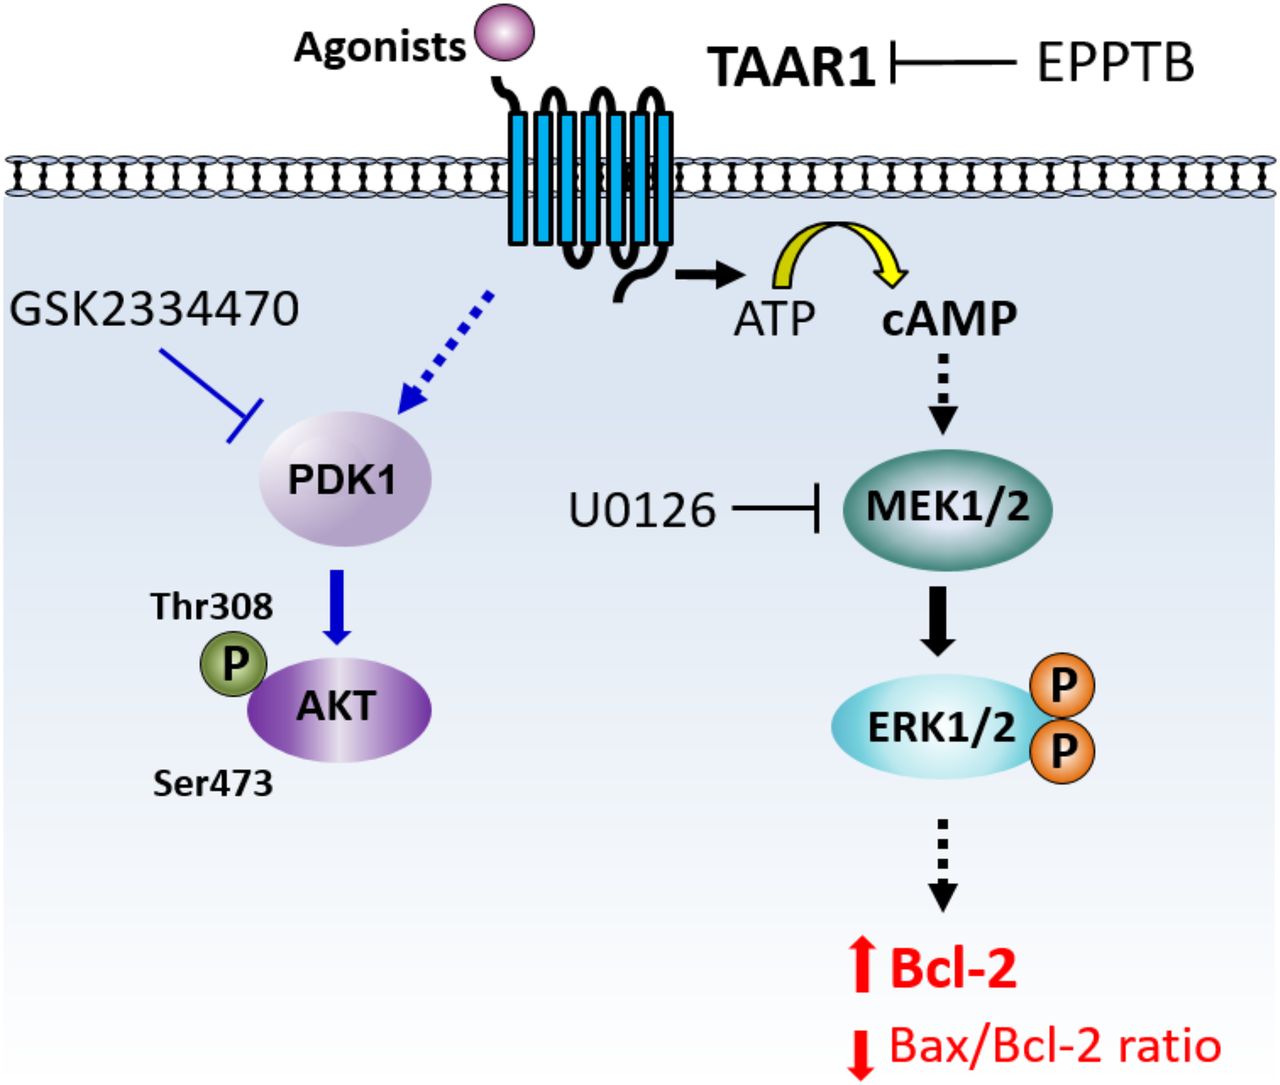
- Fig. 9.
TAAR1 signaling pathway/apoptotic pathway components. Activation of TAAR1 elicits cAMP accumulation and results in activation of ERK1/2. TAAR1 downstream signaling components increase antiapoptotic protein Bcl-2, but do not change the proapoptotic protein, Bax. This leads to a decreased Bax/Bcl-2 ratio, which could be protective, preventing apoptosis. The TAAR1 antagonist EPPTB blocks both ERK1/2 phosphorylation and changes in Bcl-2 levels. The TAAR1 agonist increased AKT phosphorylation at Thr308, but not at Ser473, which is not involved in TAAR1-induced apoptotic signaling.


