


Article Figures & Data
Figures
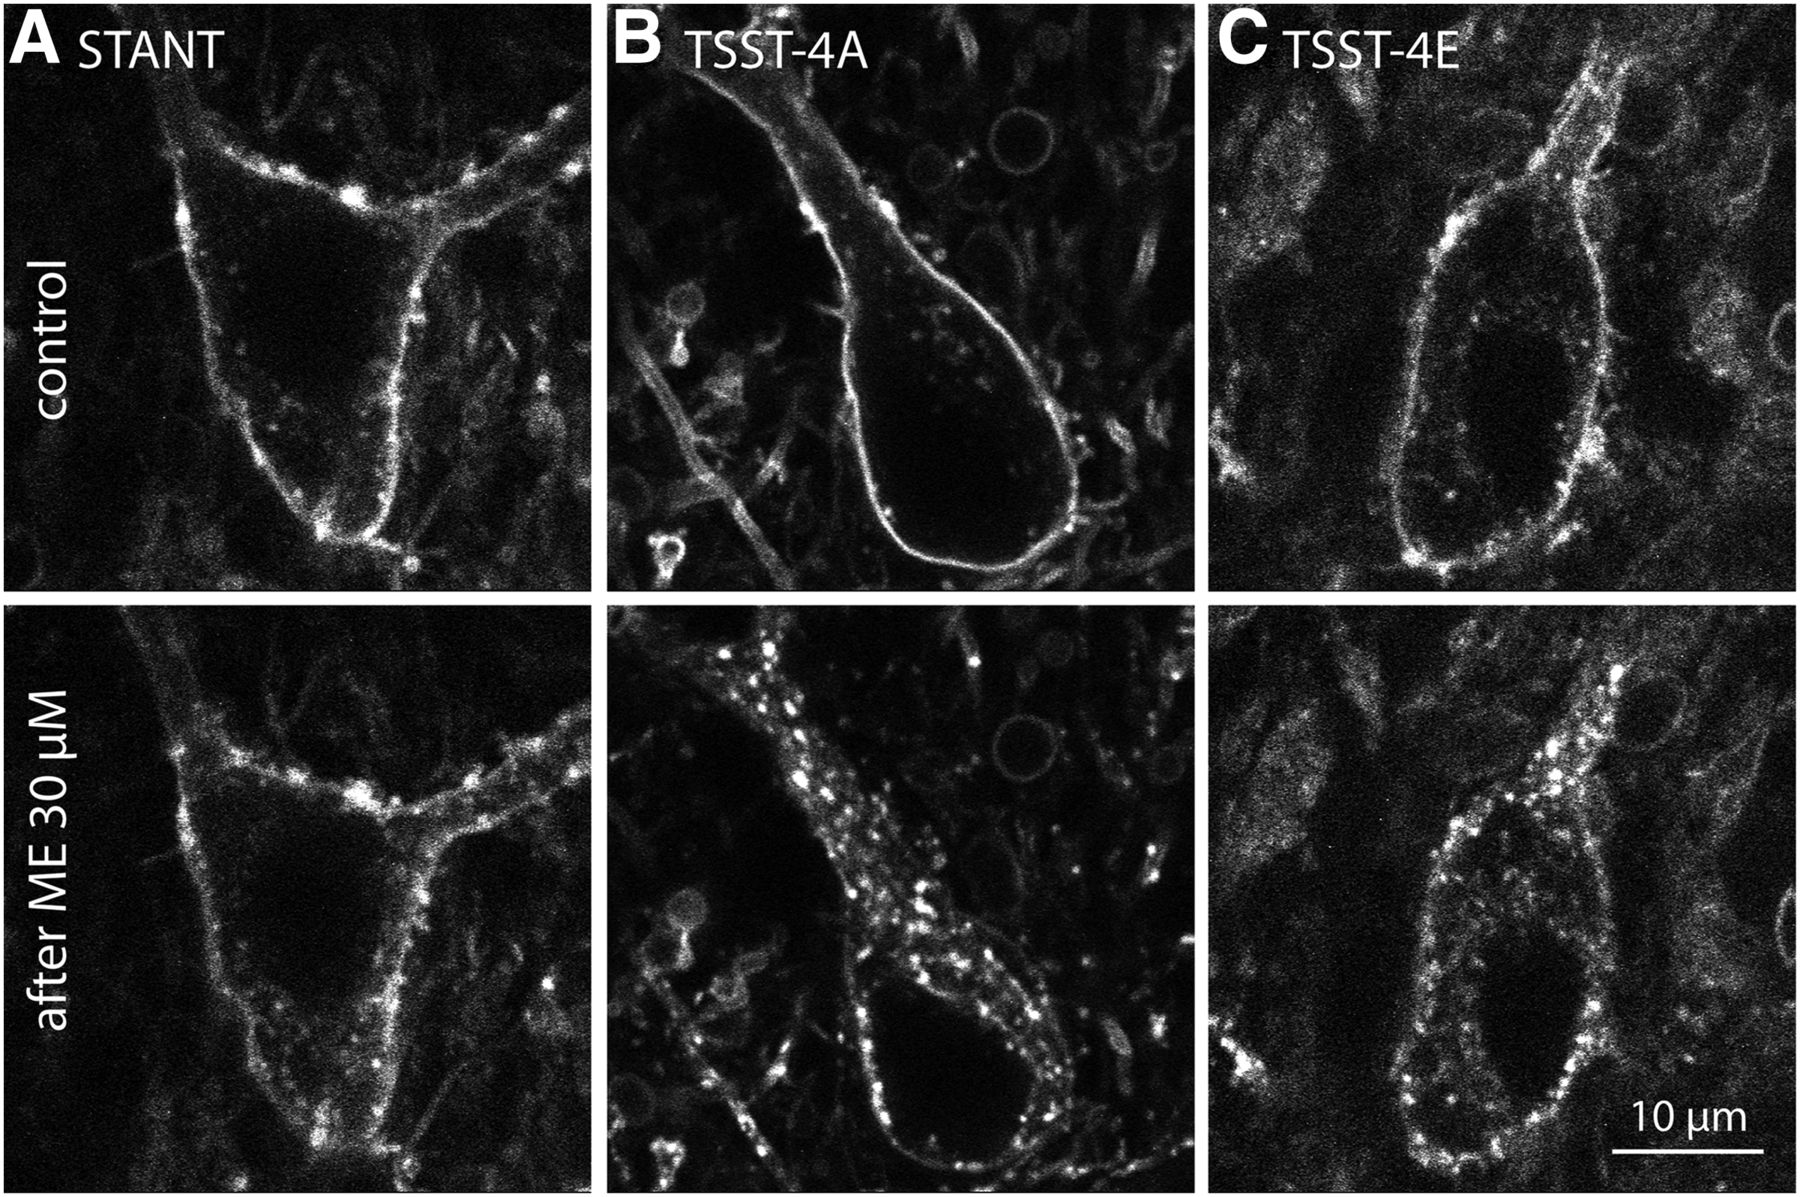
- Fig. 1.
Receptor imaging before and after treatment with ME (30 µM, 10 min). An anti-GFP nanobody conjugated with Alexa594 was used to image the (A) STANT, (B) TSST-4A, and (C) TSST-4E receptors expressed in LC before (top) and after ME (30 µM, 10 min, bottom).
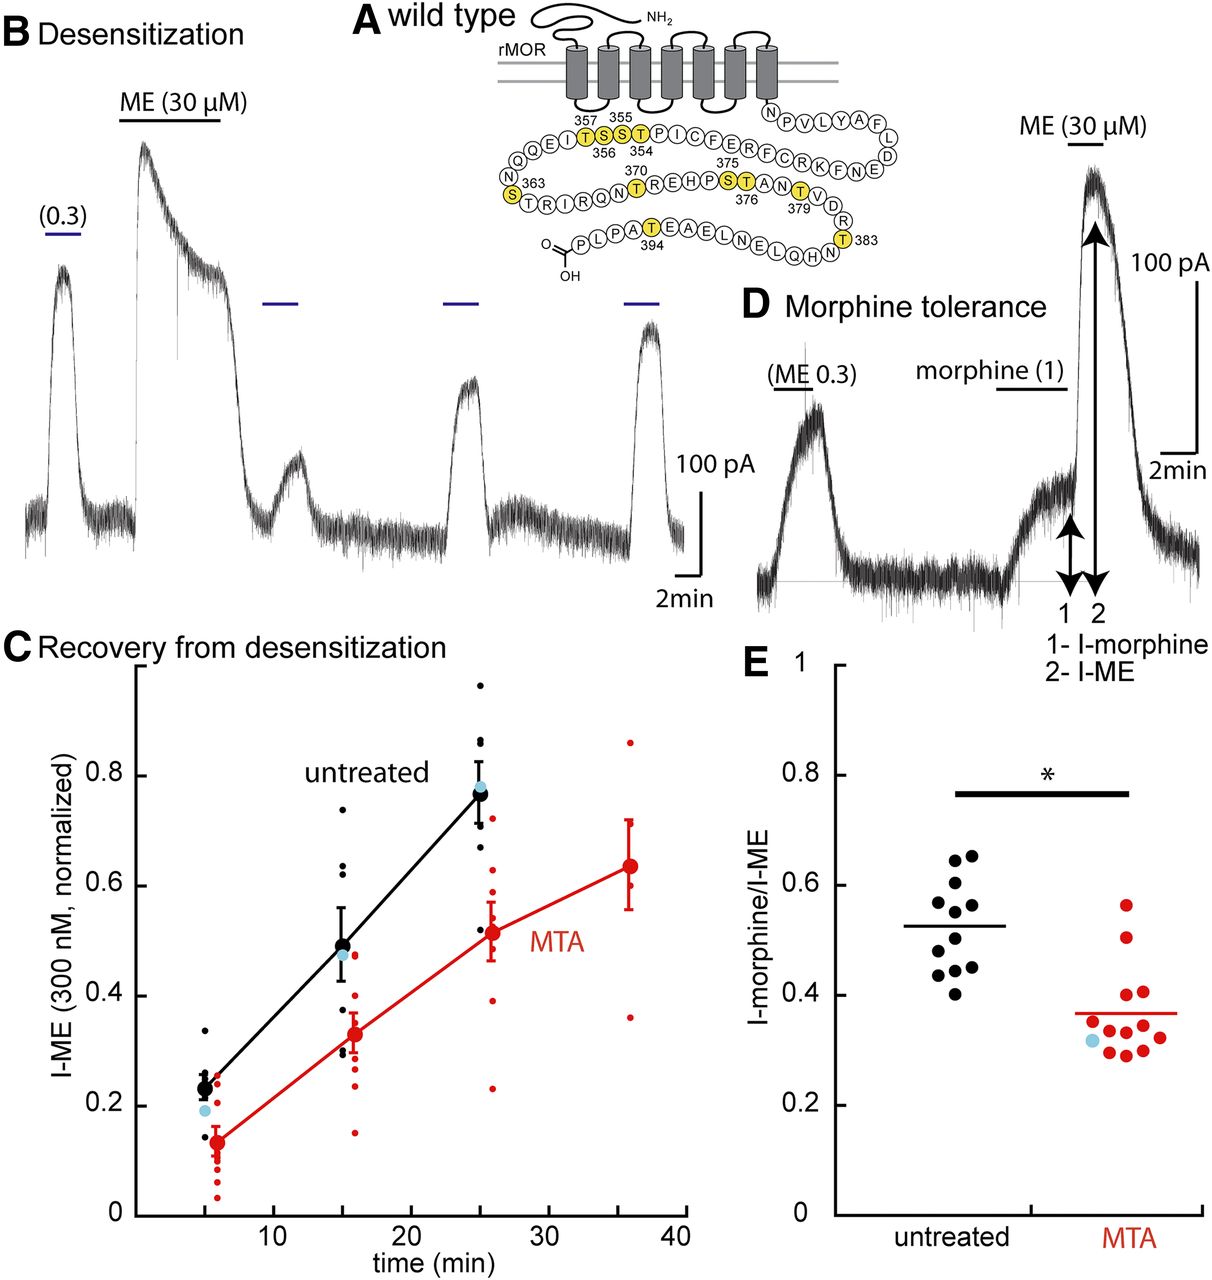
- Fig. 2.
Protocols used to measure two forms of tolerance using experiments carried out in wild-type animals. (A) Snake plot illustrates the phosphorylation sites on the C terminus (yellow: T354, S355, S356, T357, S363, T370, S375, T376, T379, T383, and T394). (B) Protocol used to determine the acute desensitization and the recovery from desensitization. (C) Summary of results showing the time course of recovery from desensitization slices from untreated (black) and MTAs (red); blue dots indicate the results from the trace in (B). (D) Trace shows the current induced by morphine (1 µM, 1) relative to that induced by ME (30 µM, 2). (E) Summary of the results measuring the relative current induced by morphine (½) in slices from untreated animals (95% confidence interval, 0.518 ± 0.047) and MTAs (95% confidence level 0.37 ± 0.045), indicating that the morphine-induced current is smaller in slices from MTAs. Mann-Whitney U test P < 0.001. Blue dot indicates the results from the experiment in (D). *P < 0.05.
- Fig. 3.
Summary of results comparing the current induced by morphine (1 µM) plotted against the current induced by ME (30 µM) in individual cells in slices from untreated (black) and morphine-treated (red) animals. (A) Cells in slices taken from wild-type animals. The current induced by morphine after treatment with morphine is smaller than that in untreated animals. (B) Cells taken from animals after expression of the STANT mutant. (C) Cells taken from animals after expression of the TSST-4A mutant. (D) Cells in slices taken from animals expressing the TSST-4E mutant.
- Fig. 4.
Desensitization is decreased, and tolerance is blocked in cells expressing the STANT mutant receptor. (A) Snake plot illustrates the sites in the STANT mutant having alanine mutations (red, S375. T376, T379). (B) An experiment taken from an MTA illustrating the desensitization and recovery from desensitization of ME (0.3 µM). (C) Summary of results showing the recovery from desensitization in slices from untreated and MTAs. Blue dot indicates the results taken from the trace in (B). (D) Trace illustrating the morphine (1 µM) current relative to the ME (30 µM) current. Blue dot indicates the result from the experiment illustrated in (D). (E) Summary of experiments plotting the current induced by morphine (1 µM) divided by that induced by ME (30 µM, I-morphine/I-ME), indicating that the relative morphine current was unchanged in slices from MTAs. Untreated 0.55 ± 0.23, MTA 0.59 ± 0.12 (95% confidence level).
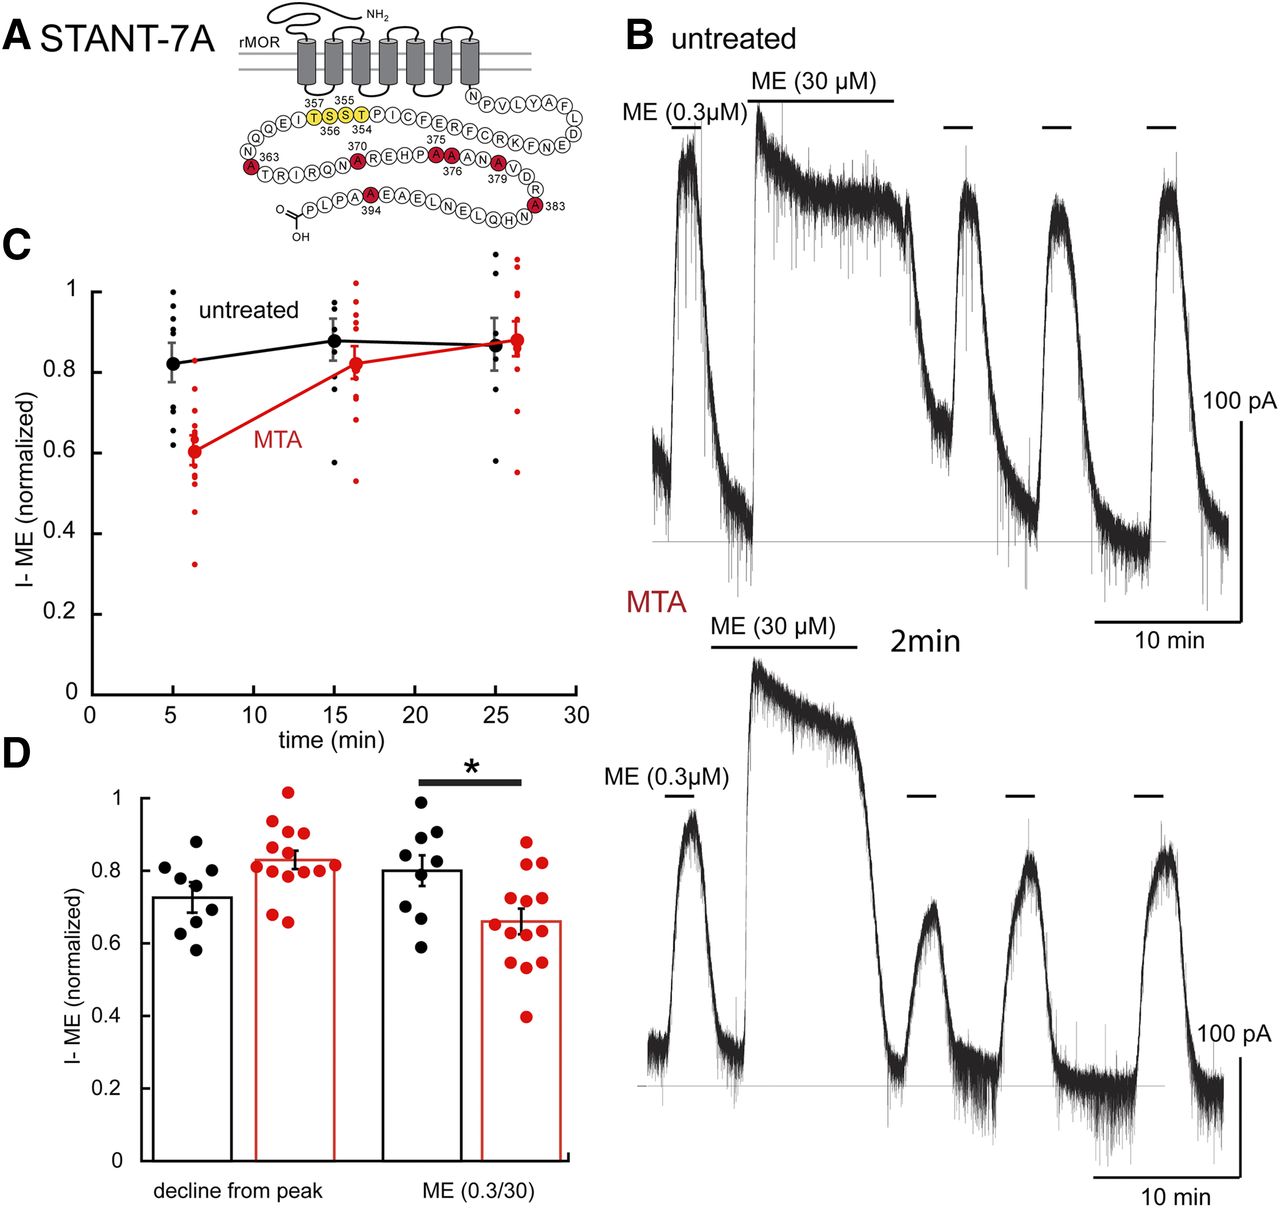
- Fig. 5.
Transient desensitization is induced fafter chronic morphine treatment in the STANT-7A mutant receptors. (A) Snake plot indicates the site (red, S363, T370, S375, T376, T379, T383, and T394) with alanine mutations. (B) Illustrates the lack of ME induced desensitization in a slice from an untreated animal (top) and a morphine-treated (bottom) animal. (C) Summary of results showing the transient desensitization induced by chronic morphine treatment (MTAs, red). (D) Left: Decline from the peak current during ME (30 µM, 10 minutes) in slices from untreated (black) and morphine-treated (red) animals. Right shows the ME (0.3 µM) current relative to the peak ME (30 µM) current in slices from untreated and morphine treated animals. *P < 0.05.
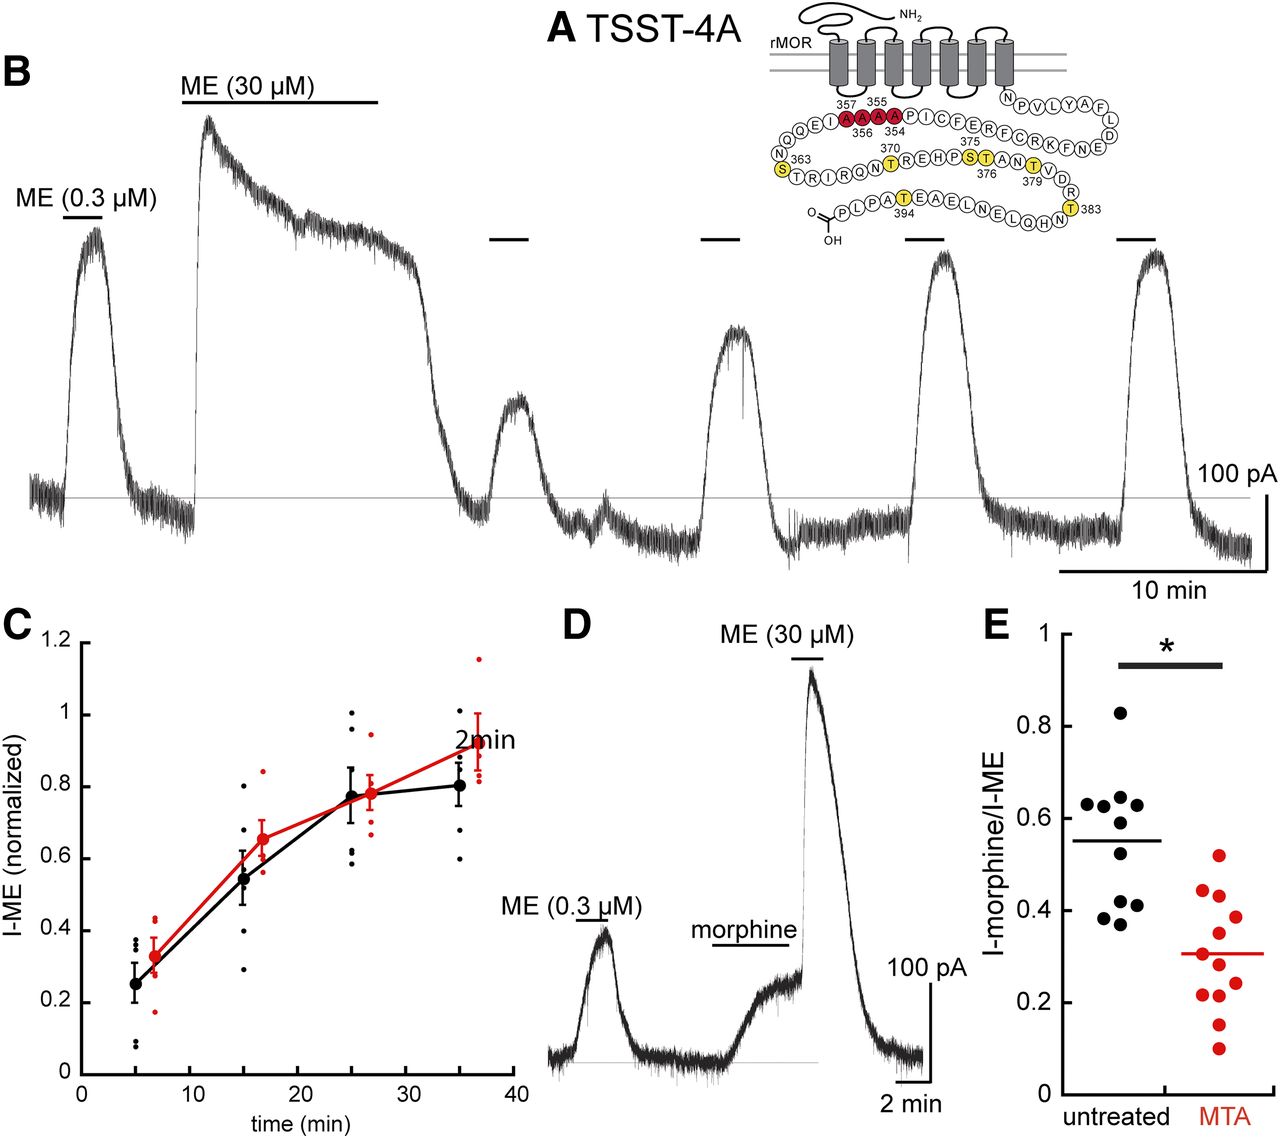
- Fig. 6.
The TSST-4A mutant receptors distinguish tolerance measured by two assays, the increase in acute desensitization (blocked), and the decrease in sensitivity to morphine (present). (A) Snake plot illustrating the sites that were mutated to alanine (red, T354, S355, S356. T357). (B) An experiment illustrating the acute desensitization and recovery from desensitization. (C) Summarized results showing the recovery from desensitization in untreated (black) and MTAs (red). Acute desensitization is insensitive to chronic morphine treatment. (D) An experiment in a slice taken from an MTA illustrating the decreased amplitude of the current induced by morphine. (E) Dot plot shows the relative current induced by morphine (I-morphine/I-ME) in slices from untreated (black) and morphine-treated (red) animals, indicating that the relative morphine current was lower in slices taken from MTAs. Untreated 0.55 ± 0.14, MTAs 0.30 ± 0.13 (95% confidence level). *P < 0.05.
- Fig. 7.
After chronic treatment with morphine, the TSST-4E mutant MOR separates induction of changes in acute desensitization (present) from the decrease in the sensitivity to morphine (blocked). (A) Snake plot shows the sites with glutamate substitutions (blue, T354, S355, S356. T357). (B) An example of acute ME-induced desensitization and recovery from desensitization in a slice from an MTA. (C) Summary of experiments showing recovery from desensitization in slices from untreated (black) and MTAs (red). (D) Summarized results showing the decline from the peak current induced by ME (30 µM, 10 minutes) and the amplitude of the ME (0.3 µM) current relative to the peak current induced by ME (30 µM) in slices from untreated and MTAs. (E) Dot plot of the relative current induced by morphine (1 µM) relative to the peak current induced by ME (30 µM, I-morphine/I-ME) showing that there was no change in the relative morphine current between slices from untreated and MTAs (untreated 0.48 ± 0.18, MTA 0.47 ± 0.16, 95% confidence level). *P < 0.05.


Tables
- TABLE 1
Summary of results
I-ME (pA), The mean amplitude of the currents induced by [Met5]-enkephalin (ME) (0.3 and 30 µM) in slices from wild-type animals (WT) and each of the mutant μ-opioid receptor (MORs). There was no statistical difference from WT (ANOVA, Dunnett’s post hoc), indicating that the sensitivity to ME in slices from WT animals was similar to slices taken from animals expressing each of the mutant receptors. Decline (10 min/peak): Paired comparison between experiments from untreated and morphin-treated animals (MTAs) showing the decrease in current induced by ME (30 µM) during a 10-minute application for each of the mutant receptors. In slices from animals expressing the TSST-4E receptors, the decline was increased in MTAs, P < 0.05, upaired t test). ME (0.3, post/pre): Paired comparison between slices from untreated and MTAs. The ratio of the current induced by ME (0.3 µM) after desensitization normalized to the initial current for each of the mutant receptors. This ratio decreased in WT, STANT-7A, and TSST-4E (P < 0.05, unpaired t test).
I- ME (pA) Decline (10 min/Peak) ME (0.3 µM), Post/Pre 0.3 µM 30 µM Untreated MTA Untreated MTA WT 279 ± 96 (7) 451 ± 95 (7) 0.60 ± 0.16 (7) 0.51 ± 0.07 (9) 0.23 ± 0.06 (7) 0.13 ± 0.08 (9) STANT-3A 259 ± 137 (9) 439 ± 134 (9) 0.79 ± 0.07 (7) 0.78 ± 0.08 (7) 0.62 ± 0.14 (10) 0.56 ± 0.15 (9) STANT-7A 290 ± 138 (8) 435 ± 143 (8) 0.73 ± 0.10 (9) 0.83 ± 0.09 (14) 0.82 ± 0.15 (9) 0.61 ± 0.13 (13) TSST-4A 231 ± 82 (8) 425 ± 123 (8) 0.53 ± 0.13 (7) 0.60 ± 0.05 (10) 0.25 ± 0.14 (6) 0.33 ± 0.11 (5) TSST-4E 286 ± 102 (7) 400 ± 123 (10) 0.65 ± 0.10 (7) 0.49 ± 0.13 (10) 0.41 ± 0.12 (7) 0.18 ± 0.13 (10)
Data Supplement
- Supplemental Figure -
Supplementary Figure 1 - Illustration of the method used to determine the extent of receptor internalization.
- Supplemental Figure -


