


Abstract
Arylamine N-acetyltransferase 1 (NAT1) is a drug-metabolizing enzyme that influences cancer cell proliferation and survival. However, the mechanism for these effects is unknown. Because of previous observations that NAT1 inhibition decreases invasiveness, we investigated the expression of the metalloproteinase matrix metalloproteinase 9 (MMP9) in human breast cancer samples and in cancer cells. We found a negative correlation between the expression of NAT1 and MMP9 in 1904 breast cancer samples. Moreover, when NAT1 was deleted in highly invasive breast cancer cells, MMP9 mRNA and protein significantly increased, both of which were reversed by reintroducing NAT1 into the knockout cells. After NAT1 deletion, there was an increased association of acetylated histone H3 with the SET and MYND-domain containing 3 (SMYD3) element in the MMP9 promoter, consistent with an increase in MMP9 transcription. NAT1 deletion also up-regulated hypoxia-inducible factor 1-α (HIF1-α). Treatment of the NAT1 knockout cells with small interfering RNA directed toward HIF1-α mRNA inhibited the increased expression of MMP9. Taken together, these results show a direct inverse relationship between NAT1 and MMP9 and suggest that HIF1-α may be essential for the regulation of MMP9 expression by NAT1.
SIGNIFICANCE STATEMENT The expression of the enzyme NAT1 was found to be negatively correlated with MMP9 expression in tumor tissue from breast cancer patients. In cells, NAT1 regulated MMP9 expression at a transcriptional level via HIF1-α. This finding is important as it may explain some of the pathological features associated with changes in NAT1 expression in cancer.
Introduction
Arylamine N-acetyltransferase 1 (NAT1) is a xenobiotic-metabolizing enzyme that catalyses the biotransformation of various carcinogens and drugs containing aromatic and heterocyclic amines (Hein, 2002). Although its role in metabolism has been widely reported, recent studies have suggested that it may be important in cancer cell survival and metastasis (Butcher et al., 2008; Butcher and Minchin, 2012; Rodrigues-Lima et al., 2012). Gene deletion studies in human cancer cells have shown that NAT1 promotes invasion both in vitro and in vivo (Tiang et al., 2015). Moreover, in the absence of NAT1, cancer cells grow poorly in soft agar (Stepp et al., 2018) and can exhibit markers of mesenchymal-to-epithelial transition (Tiang et al., 2011). NAT1 has also been associated with a number of metabolic pathways, including folate metabolism (Minchin, 1995), fatty acid metabolism (Carlisle et al., 2016), and the methionine salvage pathway (Witham et al., 2017). In breast cancer patients, overall survival is associated with high tumor NAT1 levels compared with low tumor NAT1 levels (Johansson et al., 2012; Endo et al., 2014; Minchin and Butcher, 2018). Moreover, there is evidence in patients that NAT1 may regulate drug resistance (Minchin and Butcher, 2018).
The family of matrix metalloproteinases (MMPs) are central to the invasive nature of many cancers. These proteases are responsible for degradation of the extracellular matrix within the vicinity of the proliferating tumor cells. This action promotes cell invasion and metastasis (Clark et al., 2008). The MMPs are secreted as latent proenzymes requiring activation by other proteinases (Davis et al., 2001). In breast cancer, especially triple negative breast cancer, specific MMPs have been reported to be involved in cell invasion. Of these, MMP9 has received considerable attention. MMP9 is found in more than 97% of invasive ductal carcinomas, and its expression increases with histologic grade (Merdad et al., 2014). Increased MMP9 expression is negatively associated with overall survival and relapse-free survival in breast cancers (Ren et al., 2015).
MMP9 is a gelatinase that is secreted by both cancer cells and surrounding stromal cells (Noël et al., 2008). After activation, it is involved in extracellular remodeling by degrading matrix proteins such as collagens, laminin, and fibrillin. Expression of MMP9 is regulated by transcriptional and posttranscriptional processes. Recruitment of transcription factors and suppressors to the MMP9 promoter can both activate and inhibit transcription in a cell-dependent manner (Clark et al., 2008; Fanjul-Fernandez et al., 2010). Because NAT1 inhibition has been observed to decrease invasiveness, we investigated the expression of MMP9 in human breast cancer samples and in cancer cells. We found that the protease was up-regulated in highly invasive cancer cells but not in poorly invasive cells. Moreover, deletion of NAT1 gave rise to increased MMP9 expression. As this seems contrary to our previous work, we further investigated MMP9 expression to better understand the role of NAT1 in breast cancer invasion.
Materials and Methods
Materials.
DMSO, puromycin, and plasminogen were obtained from Sigma-Aldrich (Australia). Lomastat (GM6001) was obtained from Selleck Chemicals (Houston, TX), and gelatin fluorescein conjugate and Alexa Fluor 647 phalloidin were obtained from Thermo Fisher Scientific (Australia). Anti-MMP9 (ab76003) was from Abcam (Canada), and anti-α-tubulin (#3873), anti-HIF1-α (#14179), anti-acetyl-histone H4K12 (#13944), and rabbit IgG (#2729) were purchased from Cell Signaling Technologies. Anti-acetyl-histone H3 (#17-615) was obtained from Merck (Sydney, Australia), and scrambled and HIF1- α small interfering RNA (siRNA, #SR320469) were from OriGene (Rockville, MA).
Patient Microarray Data.
Gene expression data were obtained through cBioPortal for Cancer Genomics (http://www.cbioportal.org). The study was also approved by the institutional human ethics committee (Approval 2017001552). All RNA levels were normalized by log(2) transformation before analysis.
Cell Culture.
Human breast cancer cell lines (MDA-MB-231 and T47D), human cervical cancer cell line (HeLa), human prostate cancer cell line (22Rv1), and human colon cancer cell line (HT29) were obtained from the American Type Culture Collection (Manassas, VA). Cancer cells were maintained in RPMI-1640 medium (Thermo Fisher Scientific) supplemented with 10% fetal calf serum (FCS; GE Healthcare, Australia), 2 mM l-glutamine, and 100 U/ml penicillin-streptomycin (Thermo Fisher Scientific). The cells were cultured in a humidified incubator at 37°C with 5% CO2 and passaged when they reached 80%–90% confluence.
Generation of NAT1 CRISPR/Cas9 Knockout Cell Lines.
The NAT1 gene was disrupted using a CRISPR/Cas9 system as previously described elsewhere (Wang et al., 2018). After selection with puromycin (5 µM), single colonies were selected and expanded, and NAT1 activities measured by a high-performance liquid chromatography assay to screen for the NAT1 knockout (KO) cell lines (Butcher et al., 2000). NAT1 KO cells were further verified by Western blot using a NAT1-specific antibody (Abcam) and polymerase chain reaction (PCR) of genomic DNA showing NAT1 gene disruption (Wang et al., 2018).
Quantitative Real-Time PCR.
Cells were seeded in six-well plates at 5 × 10⁵ cells/well and cultured for 24 hours. RNA was then extracted from the cells using an RNeasy Mini Kit (Invitrogen) according to the manufacturer’s instructions. The RNA concentration and purity were measured using a NanoDrop Spectrophotometer ND-1000 (Thermo Fisher Scientific). The cDNA synthesis was performed using 1.5 µg of RNA and a SuperScript III Reverse Transcriptase kit (Invitrogen). Each cDNA reaction was diluted 1:5 with nuclease-free water.
Quantitative real-time PCR was performed using a QuantStudio6 96-Well RT PCR system with SensiFAST SYBR Lo ROX kit (Bioline, Australia) with the following conditions: enzyme activation at 95°C for 10 minutes; denaturation at 95°C for 10 seconds, annealing at optimized temperature for 10 seconds, and extension at 72°C for 20 seconds for 40 cycles. Target genes were amplified using specific primers (Table 1). The specificity of amplified genes was confirmed by running the PCR products on 2% agarose gels.
List of oligonucleotides used for real-time PCR and ChIP assays
Gelatin Degradation Assay.
Fluorescein-conjugated gelatin-coated coverslips were generated as described in Martin et al. (2012). The coated coverslips were pre-equilibrated with complete medium overnight at 37°C before seeding cells. The cells were starved for 24 hours in medium containing 1% FCS before cell dissociation using 0.5 mM EDTA in PBS. The cells were resuspended in medium containing 10% FCS, seeded at 5 × 10⁴ cells/well, and cultured for 5.5 hours in the dark. The cells were then fixed with 4% paraformaldehyde in cytoskeletal buffer (100 mM KCl, 300 mM sucrose, 2 mM EGTA, 2 mM MgCl2, 10 mM 1,4-piperazinediethanesulfonic acid [PIPES], pH 7.4) for 20 minutes and then washed 3 times with PBS.
The coverslips were incubated with 0.05% Triton X-100 in PBS for 5 minutes, washed with PBS, and then blocked with 3% bovine serum albumin (BSA) in PBS for 1 hour. Phalloidin was added in 3% BSA/PBS and the cells were incubated at 4°C overnight.
The coverslips were mounted with ProLong Diamond Antifade Mountant with 4′,6-diamidino-2-phenylindole (DAPI, P36962; Thermo Fisher Scientific), and the images were acquired with an Olympus FV1000 upright confocal microscope. Ten randomly selected fields were imaged per coverslip. ImageJ software (National Institutes of Health, Bethesda, MD) was used for image analysis. The degradation area and cell number were calculated using the fluorescein-conjugated gelatin images and the phalloidin stained (F-actin) images, respectively. The relative degradation area was defined as area of degradation/cell number.
Immunoblotting.
Parent, NAT1 KO, and NAT1 rescue cells were seeded in six-well plates at 5 × 10⁵ cells/well and cultured for 24 hours. The cells were washed twice with PBS, lysed in Laemmli sample buffer, and boiled at 95°C for 5 minutes. Lysates were then electrophoresed at 200 V on 12% SDS-polyacrylamide gels for 45 minutes, transferred to nitrocellulose membranes for 1 hour at 350 mA, blocked with 5% skim milk in PBS containing 0.05% Tween-20 (PBST) for 1 hour, and incubated with primary antibodies overnight at 4°C. After three washes with PBST, membranes were incubated with horseradish peroxidase-conjugated secondary antibodies in PBST for 1 hour at room temperature. After final washes with PBST, proteins were detected using Westar ETA C 2.0 (Cyanagen). Imaging was performed using a Kodak image station 4000s pro. Protein expression was quantified by densitometry using ImageJ software and normalized to α-tubulin.
Chromatin Immunoprecipitation.
Chromatin immunoprecipitation (ChIP) assays were performed using the SimpleChIP Plus Enzymatic Chromatin IP Kit (Cell Signaling Technologies) according to the manufacturer’s protocol. Briefly, cells (6 × 10⁶) were seeded in 15-cm petri dishes and cultured for 24 hours in 20 ml of medium. DNA-protein crosslinking was carried out using 1% paraformaldehyde and then micrococcal nuclease was used to digest DNA to approximately 100–1000 base pairs. Crosslinked protein-DNA complexes were then immunoprecipitated with acetyl-histone H4K12 antibody, acetyl-histone H3 antibody, or IgG (negative control). Samples (10 µl) removed before immunoprecipitation served as input controls.
After reversal of cross-links and DNA purification, immunoprecipitated DNA was amplified by quantitative real-time PCR. PCRs contained 2 µl each of 0.25 µM forward and reverse primers (Table 1), 10 µl of 2× SensiFAST SYBR Lo ROX mix (Bioline), and 2 µl of DNA in a final volume of 20 µl. PCR was initiated by 5 minutes at 95°C, followed by 34 cycles of 95°C for 30 seconds, 62°C for 30 seconds, and 72°C for 30 seconds. The final extension at 72°C was for 5 minutes.
HIF1-α siRNA Studies.
Cells were seeded at 3 × 10⁵ cells/well in 12-well plates and cultured overnight. RNA-lipid complexes were prepared using Lipofectamine RNAiMAX Transfection Reagent (Thermo Fisher Scientific) according to the manufacturer’s instructions. Transfected cells were cultured for 48 hours, followed by RNA extraction for real-time PCR or sample denaturation for Western blot analysis.
Statistical Analysis.
Statistical analysis was performed using GraphPad Prism 7 software. Correlations of mRNA levels in breast cancer samples were determined using Spearman’s correlation coefficient. Data are presented as mean ± S.D. Differences in mean values between multiple groups were analyzed using one-way ANOVA. Multiple comparisons were performed using Turkey’s multiple comparisons test. P < 0.05 was considered statistically significant.
Results
Correlation between NAT1 and MMP9 Expression in Human Cancers.
To determine whether any significant correlation between NAT1 expression and MMP9 expression exists, we initially examined the mRNA levels in 1904 breast cancer samples using the METABRIC data set (Curtis et al., 2012). Figure 1A shows a negative correlation between these two parameters (Spearman’s correlation coefficient = 0.35, P = 5.85 × 10−56). We had previously interrogated NAT1 expression with these data, and had shown the presence of three genetically distinct subpopulations (Minchin and Butcher, 2018). When the expression of MMP9 was assessed in each of these subpopulations (Fig. 1B), there was a clear regression with a negative slope (slope = −0.26, 95% confidence interval, −0.29 to −0.22). This correlation was also seen in some other cancers, but not all (Table 2). There was a highly significant negative correlation also in bladder, head and neck, and colorectal carcinomas whereas glioma showed the only positive correlation (P values provided in Table 2). Taken together, these results show a negative correlation between NAT1 and MMP9 expression in at least four different cancers.
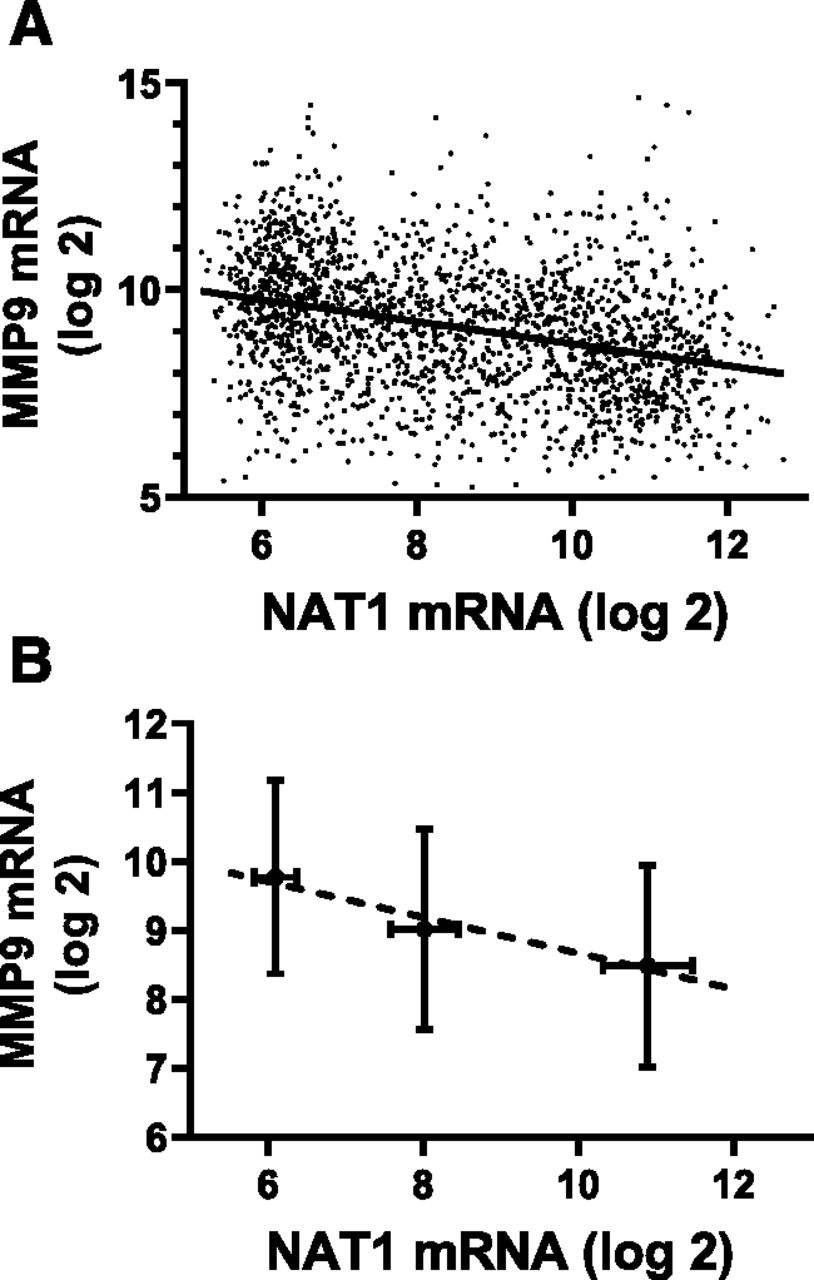
Correlation between NAT1 and MMP9 mRNA levels in breast tumors. (A) The mRNA levels in 1904 patient samples were plotted, and correlation was estimated using Spearman’s correlation coefficient (rho = 0.35, P = 5.85 × 10−56). The solid line is the estimated regression. (B) The regression of NAT1 and MMP9 was determined in three genetically distinct NAT1 subpopulations (Minchin and Butcher, 2018). For the lowest NAT1 population (n = 447), NAT1 mRNA varied from 5 to 6.5 (log2 scale) whereas for the intermediate population (n = 382), it varied from 7.25 to 8.5. In those patients with highest NAT1 (n = 558), mRNA varied from 10 to 13. Data are mean ± S.D.
Correlation between NAT1 and MMP9 expression in human cancers
Data extracted from cBioPortal and analyzed using online tools available at the database site (http://www.cbioportal.org).
MMP9 Expression in Cancer Cells after NAT1 Deletion.
NAT1 was deleted from five different cell lines using CRISPR/Cas9 technology; MDA-MB-231, T47D (breast), HT29 (colon), HeLa (cervical), and 22Rv1 (prostate). The two breast lines are highly invasive compared with the other lines. MMP9 expression was then quantified by qPCR (Fig. 2A). Both breast lines showed a significant increase (P < 0.05) in MMP9 expression, including two independent clones of the MDA-MB-231 cells. By contrast, there was no change in MMP9 mRNA in the three lines with low invasion.

Expression of MMP9 in cancer cells after NAT1 deletion. (A) MMP9 mRNA was quantified by quantitative PCR in high invasive [MDA-MB-231 (231) clone A and B, T47D] and low invasive (HT29, HeLa, 22Rv1) cells. Solid bars = parental cells; open bars = NAT1 deleted cells. Data are normalized to actin and expressed relative to the parental cells as mean ± S.D., n = 3. *P < 0.05. (B) Restoration of MMP9 expression in MDA-MB-231 NAT1 rescued (RE) cells compared with parental (P) and NAT1 deleted (KO) cells. (C) Expression of pro-MMP9 and MMP9 protein in the parental, NAT1 KO, and NAT1 rescue MDA-MB-231 cells.
To determine that the increase in MMP9 was NAT1 dependent, the MDA-MB-231 clone A was stably transfected with a NAT1 expression vector. The resulting line (rescue) had a NAT1 activity of 119.0 ± 8 nmol/min per milligram protein compared with the parental line with 11.0 ± 0.2 nmol/min per milligram protein. There was no detectable activity in the knockout cells. MMP9 in the rescue line was significantly less (P = 0.001) than that in the NAT1 knockout line (Fig. 2B).
Finally, to demonstrate that the increase in MMP9 mRNA resulted in an increase in MMP9 protein, parental, KO, and rescued cells were collected and analyzed by Western blot (Fig. 2C). Both pro-MMP9 and activated MMP9 were present in the NAT1 knockout cells but not in the parental or rescue lines. These results show that NAT1 deletion causes an increase in MMP9 mRNA and protein expression that is reversed by the reintroduction of the NAT1 gene into the KO cells.
MMP9 Promoter Activity after NAT1 Deletion.
To quantify changes in the MMP9 promoter activity after NAT1 deletion, a ChIP assay was performed to analyze histone modifications at the three major promoter elements of the MMP9 gene (Fig. 3A). Changes in histone acetylation have previously been shown to be associated with chromatin remodeling around the MMP9 promoter (Zhao and Benveniste, 2008; Zhong and Kowluru, 2013). There was a significant increase (P = 0.02) in acetylated histone H3 associated with the SMYD3 (SET and MYND-domain containing 3) site after NAT1 deletion but not at the proximal or distal activator protein 1 (AP-1) sites (Fig. 3B). We also examined acetylated histone H4 at each of the three sites, but there were no differences seen between the parental and NAT1 KO cells (Fig. 3C).

Chromatin immunoprecipitation (ChIP) assay for acetylated histone associated with the MMP9 promoter. (A) Schematic of the MMP9 promoter highlighting the three major transcription factor binding sites. Adapted from Mittelstadt and Patel (2012). The PCR fragments for the proximal AP-1, distal AP-1, and SMYD3 sites are shown by arrows. (B) Fold enrichment of each site in the ChIP assay relative to parental MDA-MB-231 cells using anti-acetylated histone H3 antibody for immunoprecipitation. (C) Fold enrichment of each site in the ChIP assay relative to parental (P) cells using anti-acetylated histone H4K12 antibody for immunoprecipitation. (D) ChIP assay using IgGisotype control demonstrating minimal nonspecific effects. (E) Global acetylated histone H3 (H3) and histone H4K12 (H4K12) in MDA-MB-231 parental and NAT1 KO cells. All results are mean ± S.D., n = 3. *P < 0.05.
IgG isotype controls (Fig. 3D) verified the specificity of the antibodies used. When global histone acetylation was determined, there was no significant difference between parental and KO cells (Fig. 3E). These results suggest that a localized increase in acetylated histones at the MMP9 promoter is responsible for the increase in transcription.
MMP9 Up-Regulation after NAT1 Deletion Is HIF1-α Dependent.
Expression of the MMPs increases under hypoxic conditions through activation of HIF1-α (Mahara et al., 2016). To assess the possible involvement of HIF1-α, we quantified its expression by Western blot analysis in parental, NAT1 KO, and NAT1 rescue MDA-MB-231 cells. NAT1 deletion increased HIF1-α protein by 3-fold, and this was restored in the rescued cells (Fig. 4A). Increased HIF1-α was not due to a change in transcription as there was no difference in mRNA levels between all three cell lines (Fig. 4B). Next, HIF1-α was knocked down with siRNA in the NAT1 deleted cells to investigate its involvement in MMP9 expression. Figure 4C shows the successful down-regulation of HIF1-α. Moreover, loss of HIF1-α was associated with a decrease in MMP9 mRNA (Fig. 4D), which also resulted in a decrease in pro-MMP9 and MMP9 protein (Fig. 4E). These experiments suggest up-regulation of MMP9 after NAT1 knockdown was due to elevated HIF1-α.

Effect of NAT1 deletion on HIF1-α and MMP9 expression. (A) HIF1-α protein in MDA-MB-231 parental (P), NAT1 KO, and NAT1 rescue (RE) cells. (B) Effect of NAT1 deletion on HIF1-α mRNA. (C) siRNA knockdown of HIF1-α in NAT1 deleted cells. Scr, scrambled siRNA; siHIF, HIF1-α targeted siRNA. (D) Effect of HIF1-α knockdown with siRNA on MMP9 mRNA in NAT1 deleted cells. (E) Effect of HIF1-α knockdown with siRNA on MMP9 protein in NAT1 deleted cells. All results are mean ± S.D., n = 3. *P < 0.05.
Up-Regulation of MMP9 Results in Increased Gelatinase Activity.
To examine whether the increase in MMP9 was functionally important, we assessed the ability of cells to degrade extracellular matrix proteins by culturing each cell line on fluorescently labeled gelatin. Degradation activity was determined by the increase in nonfluorescent regions beneath the attached cells (Fig. 5A). In line with the increase in MMP9, there was a significant increase (P < 0.0001) in gelatinase activity in the NAT1 KO cells. Moreover, that increase was attenuated in the NAT1 rescue cells. To demonstrate that the degradation was indeed MMP-dependent, we treated the cells with the MMP inhibitor GM6001. Activity in both the parental and NAT1 deleted cells was attenuated by the inhibitor (Fig. 5C). Finally, when HIF1-α was knocked down with siRNA, gelatinase activity in the NAT1 deleted cells was also attenuated (Fig. 5D), which is consistent with its role in the NAT1-dependent MMP9 expression.

Gelatin degradation assay after NAT1 deletion. (A) Representative confocal images of parental (P), NAT1 KO, and NAT1 rescue (RE) MDA-MB-231 cells grown on fluorescein conjugated gelatin coated coverslips (green) after 5.5 hours of incubation. Cells were also stained with phalloidin (F-actin, red). White arrows indicate regions of gelatin degradation. (B) Quantification of gelatin degradation capacity for MDA-MB-231 cells. (C) Effect of 20 µM GM6001 on gelatin degradation. (D) Effect of HIF1-α knockdown with siRNA on the gelatin degradation by parental (P) and NAT1 KO cells. Scr, scrambled siRNA; siHif, HIF1-α targeted siRNA. Data are mean ± S.D., N ≥ 18. *P < 0.05.
Discussion
In a cohort of more than 1900 patients, there was a highly statistically significant inverse correlation between the expression of NAT1 and MMP9 in breast tumors. Breast cancer patients can be divided into three distinct, genetically different subpopulations according to their NAT1 mRNA levels (Minchin and Butcher, 2018). These three populations showed a clear difference in MMP9 expression. The negative correlation between NAT1 and MMP9 was also seen in some other cancers including bladder carcinoma and colorectal carcinoma.
To investigate whether NAT1 might directly regulate MMP9 expression, several human cancer cell lines were modified using CRISPR/Cas9 to disrupt the NAT1 gene. The origin of the cells used was breast, cervical, colorectal, and prostate. With the exception of the colorectal line (HT29), each cell line showed a similar effect of NAT1 on MMP9 expression to that seen in patient tumor samples (Table 2). NAT1 deletion up-regulated MMP9 transcription by more than 10-fold in the MDA-MB-231 line, and this was reversed when the NAT1 gene was reintroduced into the KO cells.
The results from the present study suggest a mechanism by which NAT1 deletion increases MMP9 expression. Low NAT1 leads to elevated HIF1-α levels, possibly through stabilizing the protein because the transcriptional changes appeared to be minimal (Fig. 4B). HIF1-α is stabilized by a number of mechanisms including acetylation at lysine 709 by p300 (Geng et al., 2012). This enzyme uses acetyl-coenzyme A, which is rate-limiting in many acetylation reactions (Pietrocola et al., 2015). Stepp et al. (2018) reported that NAT1 deletion in human cells increases intracellular acetyl-coenzyme A levels, possibly increasing HIF1-α acetylation. However, HIF1-α is also stabilized by various metabolites, including pyruvate and lactate (Lu et al., 2002; De Saedeleer et al., 2012). Because NAT1 deletion inhibits mitochondrial pyruvate dehydrogenase (Wang et al., 2019), an increase in either or both of these metabolites might explain the elevated stability of HIF1-α. More work is needed to identify the exact mechanism.
In breast cancer, MMP9 is secreted by tumor cells as well as the surrounding stromal cells. MMP9 expression is associated with worse relapse-fee survival in breast (Ren et al., 2015) as well as other cancers (Huang, 2018). As a type IV collagenase, it is capable of degrading specific proteins in the extracellular matrix. However, the role of MMP9 in cancers may not solely be related to remodeling of the tumor environment (Egeblad and Werb, 2002). For example, MMP9 can recruit inflammatory cells that enhance tumor progression (Vandooren et al., 2013). The protease also has a role in tumor angiogenesis (Vu et al., 1998) and tumor differentiation (Egeblad and Werb, 2002), both of which are associated with poor survival outcomes.
In a number of studies, NAT1 inhibition by small molecule inhibitors, by short hairpin RNA (shRNA), or after gene deletion has been shown to induce slower cell growth (Tiang et al., 2010; Stepp et al., 2018) and decreased invasion in vitro (Tiang et al., 2011, 2015). Moreover, NAT1 inhibition in MDA-MB-231 cells with shRNA decreased colony formation in the lungs of mice after intravenous administration. These results appear to be inconsistent with the current study where the proinvasive MMP9 is up-regulated after NAT1 deletion. This may, in part, be related to the diverse actions of MMP9. Moreover, NAT1 can also influence epithelial-to-mesenchymal transition in cells (Tiang et al., 2011) and in patient tumor samples (Savci-Heijink et al., 2019). Thus, MMP9 expression alone does not predict increased invasiveness, at least not in the context of NAT1 expression.
In summary, NAT1 deletion in several cell-types results in an increase in MMP9 expression. These changes were found to be a result of higher HIF1-α levels, suggesting that NAT1 may have a role in the HIF1-α pathway. Additional studies are needed to identify the exact mechanism linking these proteins in cancer as well as other pathologic conditions.
Acknowledgments
The authors acknowledge the contributions made by the organizers of the databases and donors of samples used in the present study.
Authorship Contributions
Participated in research design: Li, Butcher, Minchin.
Conducted experiments: Li, Butcher.
Performed data analysis: Minchin, Li, Butcher.
Wrote or contributed to the writing of the manuscript: Li, Butcher, Minchin.
Footnotes
- Received June 3, 2019.
- Accepted August 20, 2019.
This work was funded by the National Health and Medical Research Council of Australia [Grant 1083036]. P.L. was supported by the CSC-UQ Ph.D. Scholarship program. Results published here are based upon data generated by the METABRIC consortium (http://molonc.bccrc.ca/aparicio-lab/research/metabric/).
Abbreviations
- AP-1
- activator protein 1
- BSA
- bovine serum albumin
- ChIP
- chromatin immunoprecipitation
- FCS
- fetal calf serum
- GM6001
- Lomastat
- HIF1-α
- hypoxia-inducible factor 1-α
- KO
- knockout
- MMP
- matrix metalloproteinase
- NAT1
- arylamine N-acetyltransferase 1
- PBST
- phosphate-buffered saline containing 0.05% Tween-20
- PCR
- polymerase chain reaction
- PIPES
- 1,4-piperazinediethanesulfonic acid
- shRNA
- short hairpin RNA
- siRNA
- small interfering RNA
- SMYD3
- SET and MYND-domain containing 3
- Copyright © 2019 by The American Society for Pharmacology and Experimental Therapeutics


