


Abstract
Farnesoid X receptor (FXR), or NR1H4, protects the liver from insults of various etiologies. A role of FXR in drug-induced liver injury has also been hypothesized yet only marginally investigated. The aim of this study was to assess the effect of FXR activation on gene expression and phenotype of the liver of mice treated with valproic acid (VPA), or 2-propylpentanoic acid, a prototypical hepatotoxic drug. Obeticholic acid (OCA) was used to activate FXR both in mice and in human hepatocellular carcinoma (Huh-7) cells. Next-generation sequencing of mouse liver tissues was performed from control, VPA, and VPA + OCA–treated mice. Pathway analysis validation was performed using real-time reverse-transcription polymerase chain reaction, Western blotting, immunohistochemistry, and fluorometric assays. FXR activation induced antioxidative pathways, which was confirmed by a marked reduction in VPA-induced lipid peroxidation and endoplasmic reticulum stress. In vitro, VPA-induced oxidative stress was independent of lipid accumulation, stemmed from the cytoplasm, and was mitigated by OCA. In the liver of the mice treated with OCA, the levels of cytochrome P450 potentially involved in VPA metabolism were increased. The hepatic lipid–lowering effect observed in animals cotreated with VPA and OCA in comparison with that of animals treated with VPA was associated with regulation of the genes involved in the steatogenic nuclear receptor peroxisome proliferator-activated γ (PPARγ) pathway. In conclusion, pronounced antioxidant activity, repression of the PPARγ pathway, and higher expression of P450 enzymes involved in VPA metabolism may underlie the hepatoprotective of FXR activation during VPA treatment.
SIGNIFICANCE STATEMENT Valproic acid–induced oxidative stress occurs in absence of lipid accumulation and is not of mitochondrial origin. Valproic acid exposure induces the expression of the steatogenic nuclear receptor peroxisome proliferator-activated γ (PPARγ) and its downstream target genes. Constitutive activation of the farnesoid X receptor (FXR) reduces PPARγ hepatic expression and induces hepatic antioxidant activity. The variability in FXR expression level/activity, for instance in individuals carrying loss-of-function genetic variants of the FXR gene, could contribute to valproic acid pharmacokinetic and toxicokinetic profile.
Introduction
The farnesoid X receptor (FXR), or NR1H4, is a well-established key player in bile acid, glucose, and lipid metabolism (Molinaro et al., 2018). Moreover, extensive genetic and pharmacological evidence indicates that FXR has a protective effect against liver disease of various etiologies by exerting anticholestatic, antisteatogenic, antioxidant, anti-inflammatory, and antifibrotic effects. In animals, FXR deficiency causes hepatic inflammation, fibrosis, and malignant transformation (Sinal et al., 2000; Kim et al., 2007; Yang et al., 2007; Liu et al., 2012), whereas constitutive activation of FXR reduces steatosis, hepatic inflammation, and fibrosis in animals with nonalcoholic fatty liver disease (Pellicciari et al., 2002; Fiorucci et al., 2005; Zhang et al., 2009; Lívero et al., 2014; Gai et al., 2018) and prevents carcinogenesis in ATP-binding cassette b4 knockout mice, a model of inflammation-associated hepatocellular carcinoma (Cariello et al., 2017). In human, individuals carrying a single nucleotide polymorphism at the methionine start codon or its proximity (−1g>t, M1V, M173T) of the FXR gene, which results in decreased protein synthesis, are predisposed to gallstones and intrahepatic cholestasis during pregnancy (Marzolini et al., 2007; Van Mil et al., 2007; Kovacs et al., 2008), and low FXR levels seem to be associated with more aggressive hepatocellular carcinoma (Su et al., 2012). Thus far, one semisynthetic FXR ligand, obeticholic acid, has been approved for the treatment of patients with primary biliary cholangitis, and others are in clinical trials for various indications (Ali et al., 2015; Hirschfield et al., 2015; Kowdley et al., 2018).
Cholestasis, oxidative stress, and inflammation are also hallmarks of drug-induced liver injury (DILI), yet studies on the role of FXR in DILI are sparse, primarily because DILI is rare and mostly unpredictable and because in vitro and in vivo experimental models to study the molecular mechanisms underlying DILI are suboptimal (Kullak-Ublick et al., 2017; Visentin et al., 2018). Only recently, a possible protective role of FXR in liver damage induced by widely prescribed drugs, such as acetaminophen and nonsteroidal anti-inflammatory drugs, has been described in animals (Lu et al., 2015; Sepe et al., 2018). Another widely used hepatotoxic drug is valproic acid (VPA), 2-propylpentanoic acid, a synthetic short-chain fatty acid prescribed against epilepsy, bipolar disorder, neuropathic pain, migraine headaches, and schizophrenia. VPA is associated with various degrees of hepatotoxicity, from steatosis, which occurs in more than 40% of patients who received valproic acid (Luef et al., 2004; Verrotti et al., 2009), to acute liver failure (Ware and Millward-Sadler, 1980; Zimmerman and Ishak, 1982). All forms of valproate hepatotoxicity have features of mitochondrial injury, oxidative stress, and microvesicular steatosis with variable amounts of inflammation and cholestasis, although whether the mitochondrial injury and the oxidative stress are secondary to the lipid accumulation or primary events in the onset of the damage is not clear.
In consideration of the multiple commonalities between the pathophysiology of valproic acid–induced hepatotoxicity and FXR hepatoprotective duty, we hypothesized that the activation state of FXR could protect liver from valproic acid–induced damage. In the current study, we used obeticholic acid to constitutively activate FXR and assess the impact of FXR-mediated changes on the gene expression pattern and phenotypic features of the liver of mice chronically treated with valproic acid.
Materials and Methods
Animals.
All animal experiments conformed to the Swiss animal protection laws and were approved by the Cantonal Veterinary Office (ZH222/16). Mice were housed in individually ventilated cages with access to food and water ad libitum. Female C57/BJ mice (Charles River Laboratories), 12 weeks of age, were randomly assigned to a chow (D12329; Provimi Kliba, Kaiseraugst, Switzerland) or a chow diet mixed with obeticholic acid (OCA) (25 mg/kg; MedKoo Biosciences, Research Triangle Park, NC) for 4 weeks. Afterward, mice were divided into four groups: control, VPA, VPA + OCA, and OCA. Mice were given VPA (100 mg/kg body weight) or the same volume of PBS by gavage for 4 additional weeks. The dose of VPA was selected based on previous dose-range–finding data in mouse models of DILI adjusted for the treatment duration used in this study (Vitins et al., 2014). The amount of OCA supplementation in food that is effective in activating FXR was determined in a previous study (Gai et al., 2018). Liver samples from each animal were used for RNA and protein extraction as well as histologic examination. Serum was collected to assess alanine aminotransferase (ALT) and aspartate transaminase (AST) activity. Two separate experiments were completed with three mice per treatment, resulting in a total of six mice per treatment group.
ALT and AST Test.
Mouse serum levels of AST and ALT were measured with an AST assay kit (ab105135; Abcam) and an ALT assay kit (ab105134; Abcam), respectively.
Liver Pathologic Assessments and Immunostaining.
Livers were fixed in formalin and embedded in paraffin. Four-micrometer sections were stained with hematoxylin and eosin. Immunostaining was performed on paraffin sections using a microwave-based antigen-retrieval technique. The antibodies used in this study were against the macrophage marker MAC387 (ab22506; Abcam), 4-hydroxynonenal (4-HNE) (ab46545; Abcam), and the endoplasmic reticulum chaperone protein Grp78 (ab21685; Abcam). Sections were treated with the Envision+ DAB kit (Dako, Basel, Switzerland) according to the manufacturer’s instructions. The lipid droplet analysis was done by BODIPY 493/503 (D-3922; Invitrogen) staining on liver cryosections and analyzed by digital images.
Isolation of RNA from Liver Tissue and Cells and Quantification of Transcript Levels.
Total RNA was extracted with Trizol (Invitrogen, Waltham, MA). Two micrograms of total RNA were reverse transcribed using random primers and the Superscript II reverse transcriptase (Invitrogen, Carlsbad, CA). First-strand cDNA was used as the template for real-time polymerase chain reaction analysis with TaqMan master mix and primers (Applied Biosystems, Foster City, CA). A list of the TaqMan probes (Thermo Fischer Scientific, Waltham, MA) used in this study can be found in the Supplemental Data File (Supplemental Table 1). Data were calculated and expressed relative to levels of RNA for the housekeeping gene hypoxanthine phosphoribosyltransferase in the case of Huh7 cells or β-actin in the case of mouse liver samples.
Microarray and Gene Expression Analysis.
Total RNA was prepared using the standard Trizol extraction method (Invitrogen). RNA samples from six mice per group (three from each experiment) were sequenced using the Illumina NovaSeq platform. Details on the analysis methods can be found at http://fgcz-bfabric.uzh.ch/wiki/tiki-index.php?page=app.two_groups. In brief, preprocessing included background subtraction and normalization before using only reads fulfilling the perquisites of a valid false discovery rate and presence in at least 50% of samples of a given subset. A generalized linearized regression two-factorial model was used with a trimmed mean of M-values normalization and quasi-likelihood test for differential expression analysis, performed using EdgeR Bioconductor. A threshold of 1.4-fold change, P value <0.1, was set to identify relevant key targets, wherein the absolute log2 ratio was >0.5, and the P value was <0.01 in the two-group comparisons (Supplemental R Script). Gene ontology analysis, network analysis, and Kyoto Encyclopedia of Genes and Genomes pathway analysis of the microarray data were completed using the MetaCore online service (Thomson Reuters, Winter Park, FL; https://portal.genego.com/), and DAVID Bioinformatics Resources 6.8 (National Institute of Allergy and Infectious Diseases, National Institutes of Health; https://david.ncifcrf.gov/).
Western Blotting.
Liver tissues from five mice from one experiment were homogenized with a Polytron in 1 ml of lysis buffer (0.1% SDS, 1% Triton X-100, 1 mM EDTA, 150 mM NaCl, and 20 mM Tris, pH 7.4) supplemented with protease inhibitors (Roche Diagnostics, Indianapolis, IN), incubated in rotation overnight, and then spun down at 16,000g. One hundred micrograms of protein samples was resolved on a 10% (w/v) polyacrylamide gel and electroblotted onto nitrocellulose membranes (GE HealthCare, Piscataway, NJ). The membranes were blocked with 5% nonfat dry milk in PBS supplemented with 0.1% (v/v) Tween 20 and incubated overnight at 4°C with anti-Cyp2C antibody (sc-23436, lot K2404; Santa Cruz, Dallas, TX), which was followed by probing with horseradish peroxidase–conjugated anti-goat IgG antibody. Blots were developed with SuperSignal West Femto Maximum Sensitivity Substrate (Thermo Scientific). The images were acquired and analyzed with the Fusion FX7 (Vilber Lourmat, Eberhardzell, Germany). As a loading control, the sample blots were stripped and reprobed with anti-actin followed by horseradish peroxidase–conjugated anti-mouse IgG antibody.
Cell Line.
Huh7 cells were maintained in RPMI 1640 medium supplemented with 10% fetal calf serum, 100 U/ml penicillin, and 100 μg/ml streptomycin at 37°C in a humidified atmosphere of 5% CO2. Doses of 2 mM VPA and 2 µM OCA were used in all cell culture experiments. The VPA and OCA extracellular concentrations were selected based on cell viability and maximal induction of FXR target genes, respectively (unpublished data).
Assessment of Oxidative Stress In Vitro.
For intracellular reactive oxygen species (ROS) detection, 80%–90% confluent cells were treated for 24 hours with or without OCA, then exposed to VPA for another 24 hours, and finally processed according to the manufacturer’s methods (CellROX; Life Technologies). For ROS subcellular localization, plasmids encoding redox-sensitive GFP (roGFP) localized to the cytoplasm (Cyto-roGFP) and mitochondrial matrix (Mito-roGFP) from AddGene (plasmid 49435 and 49437, respectively) were used (Waypa et al., 2010). Chimeric inserts were subcloned into the pcDNA3.1 (+) expression vector (Invitrogen) by restriction-ligation cloning using KpnI and NotI cut sites. Sensors were transiently transfected into Huh7 cells using LipofectAMINE 2000 (Thermo Fischer Scientific), Twenty-four hours later, cells were pretreated with or without OCA for 24 hours and then treated with VPA for another 24 hours. Fluorescent signals were analyzed either by confocal microscopy by imaging fluorescence emitted at 525 nm after excitation with 405 and 488 nm separately or in a plate reader (GloMax Discover; Promega, Madison, WI) by sequential excitation with 405 and 475 nm and measurement of fluorescence with a 500–550 nm filter. All measurements were conducted in PBS or serum and phenol red–free medium. Ratios of fluorescence after 405 and 488 nm excitation of confocal images were calculated using Image J. Data are presented as the ratio of fluorescence after excitation with 405–488 nm, in which a high ratio denotes sensor oxidation, and a low ratio denotes sensor reduction (Waypa et al., 2010). All cell culture experiments were performed three independent times, each with three technical replicates per measurement and treatment.
Statistical Analysis.
For microarray data, comparison was assessed by student’s t test with R/Bioconductor 3.6 (http://www.bioconductor.org/) to generate differentially expressed genes. For other data relating to baseline characteristic analysis and histologic analysis, comparisons between groups were assessed by one-way ANOVA followed by Tukey’s multiple comparisons test. To maintain experiment-wise type1 error rate at 0.05, each ANOVA was run at a partial lower threshold using a modification of the Bonferroni’s method. These thresholds are shown in each figure legend. Statistical analyses were performed using GraphPad Prism (version 8.0 for Windows; GraphPad Software, San Diego, CA).
Results
Effect of FXR Activation on the Hepatic Transcriptome.
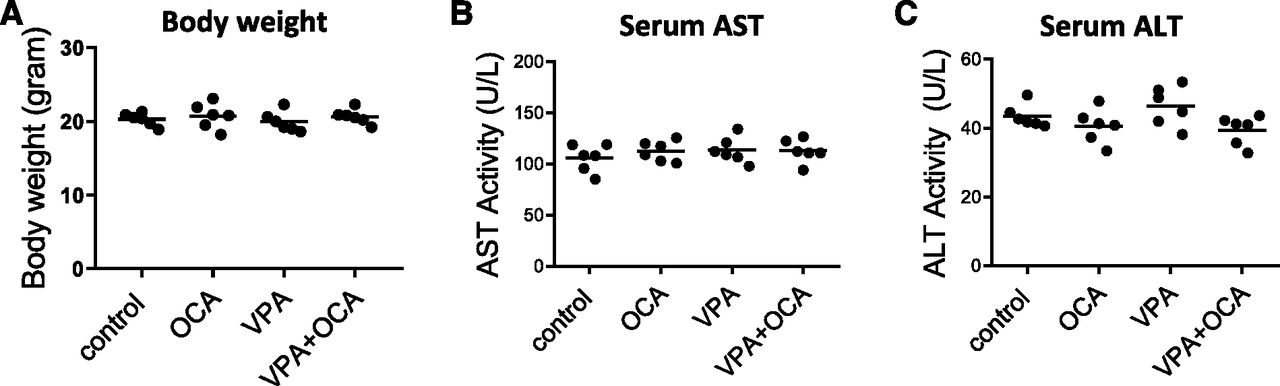
Neither OCA treatment nor VPA treatment affected the body weight (Fig. 1A) or the serum levels of ALT and AST in mice from different treatment groups, indicating preserved liver function (Fig. 1, B and C). The gene expression patterns in mouse liver samples from VPA and VPA + OCA groups were compared by setting a ≥1.4-fold change cutoff to identify key differences. Raw data have been in the Gene Expression Omnibus data base (https://www.ncbi.nlm.nih.gov/geo/query/acc.cgi?acc=GSE138810). The effect of FXR activation on the hepatic gene expression pattern of mice under chronic treatment with VPA revealed that, besides bile secretion, antioxidant activity, P450, and fatty acid metabolism were the top networks altered by OCA (Fig. 2, A and B). Next-generation sequencing (NGS) results were validated by real-time RT-PCR of known genuine targets of FXR: the genes encoding for the small heterodimer partner (Shp), or mShp, and for the organic solute transporter β (Fig. 2, C and D).

Body weight and liver function. For each experimental group, body weight (A), serum AST (B), and ALT (C) activity were assessed at the end of the experiment. One-way ANOVA, alpha = 0.001. n = 6 mice/group. ctrl, control.

Differential mRNA expression pattern. Volcano plot (A) and pathway enrichment analysis (B) comparing liver transcriptomes of VPA and VPA + OCA groups. n = 6 mice/group. Real-time RT-PCR of the genuine FXR target genes Shp (C) and for the organic solute transporter β (Ostbeta) (D). One-way ANOVA, alpha = 0.001, followed by Tukey’s post hoc analysis. n = 6 mice/group. ctrl, control.
Antioxidant Effect of FXR Activation In Vivo.
Oxidative stress is a feature of valproic acid–induced hepatotoxicity (Chang and Abbott, 2006). Based on the NGS data and real-time RT-PCR data, the mRNA levels of enzymes involved in glutathione conjugation (glutathione S-transferases), radical reduction [glutathione peroxidases (Gpxs)] and 4-HNE detoxification (alcohol dehydrogenase 4 and aldo-keto reductase 1b7) were increased in the liver of the animals treated with OCA (Fig. 3, A–E) (Alary et al., 2003). Lipid peroxidation and ER stress were further assessed by immunostaining of liver sections for 4-HNE and Grp78, markers for lipid peroxidation and ER stress, respectively. Mice livers after VPA treatment showed increased levels of 4-HNE and Grp78, and the degree of positive staining for 4-HNE and Grp78 was reduced in VPA + OCA–treated mice (Fig. 3, F and G). Figure 3H demonstrates that 4-HNE and Grp78 staining overlapped with that of glutamine synthetase, which is a marker of the pericentral area, the most hypoxic zone of the acinus, and thus the prone to ROS production (Jungermann, 1986).

Hepatic oxidative stress in vivo. NGS-derived heat-map, n = 6 mice/group (A). Real-time RT-PCR of Gpx1, Gpx2, and Gpx6 and the glutathione transferase (Gst) a2. One-way ANOVA, alpha = 0.001, followed by Tukey’s post hoc analysis. n = 6 mice/group. (B–E) Representative staining of 4-HNE, Grp78, and glutamine synthetase staining (F). Scale bar, 100 µm. Adh4, alcohol dehydrogenase 4; Akr1b7, aldo-keto reductase 1b7; Cont, control; Gclm, glutamylcysteine synthetase; GS, glutamine synthetase; Nqo1, NAD(P)H quinone dehydrogenase 1.
Subcellular Localization of VPA-Induced ROS In Vitro.
To confirm the in vivo result, Huh-7 cells were treated with VPA with or without pretreatment of OCA. Twenty-four hours preincubation with OCA at the extracellular concentration of 2 μM induced the expression of several antioxidant-related genes, including those encoding for GPX1, gamma-glutamylcysteine synthetase, and NAD(P)H quinone dehydrogenase 1 and superoxide dismutase 2 (Fig. 4, A–D). To assess the origin of VPA-induced oxidative stress, we developed an in vitro model of VPA-induced oxidative stress. Treatment of Huh7 cells for 24 hours with VPA at the extracellular concentration of 2 mM was sufficient to induce oxidative stress, as denoted by use of an ROS probe, which showed significantly higher levels of intracellular ROS (Fig. 4, E and F). OCA preincubation protected the cells from VPA-induced ROS formation (Fig. 4, E and F). Vectors encoding roGFPs were employed to detect ROS at different locations within the cell (Waypa et al., 2010). Two different roGFP sensors were separately transiently transfected into cells: Cyto-roGFP or Mito-roGFP. Redox changes in cellular subcompartments induced by VPA were assessed with these sensors as a reflection of changes in the ratio of fluorescence at 525 nm when excited with 405 nm versus 488 nm (405/488). After VPA treatment, Cyto-roGFP detected significant ROS generation with an increased 405/488 ratio (Fig. 4, F and H). Unlike the Cyto-roGFP, Mito-roGFP fluorescence remained unchanged after VPA treatment (Fig. 4G), indicating that VPA-induced oxidative stress was restricted to the cytoplasm. Again, pretreatment with OCA inhibited VPA-induced cytoplasmic ROS elevation (Fig. 4, F and H). H2O2 treatment was used as a positive control.

Oxidative stress in vitro. Cells were incubated for 24 hours with OCA (2 µM) followed by 24 hours with VPA (2 mM). Real-time RT-PCR of the human oxidative stress-related genes GPX1, glutamate-cysteine ligase regulatory subunit, NAD(P)H quinone dehydrogenase 1 (NQO1), and superoxide dismutase 2 (SOD2). Data are expressed as fold change to the housekeeping gene hypoxanthine phosphoribosyltransferase. One-way ANOVA, alpha = 0.005, followed by Tukey’s post hoc analysis. n = 3 independent experiments. (A–D) Total intracellular ROS level. Data are expressed as percentage of the untreated control. One-way ANOVA, alpha = 0.005, followed by Tukey’s post hoc analysis. n = 3 independent experiments (E). Cytosolic (F) and mitochondrial (G) ROS levels. Cells were exposed to H2O2 as positive control. Data are expressed as ratio between the fluorescent signals at the indicated excitation wavelengths. One-way ANOVA, alpha = 0.005, followed by Tukey’s post hoc analysis. n = 3 independent experiments. Representative cytosolic ROS staining. Scale bar, 50 µm (H). Cont, control; GCLM, glutamylcysteine synthetase.
Effect of FXR Activation on mCyp2c Enzymes.
The P450 pathway is another one of the top pathways affected by FXR activation. In humans, valproic acid phase I metabolism is primarily mediated by CYP2C9 and CYP2A6 (Pan et al., 2016). The mouse orthologs mCyp2c39, mCyp2c44, mCyp2c70, and mCyp2c55 were all upregulated by treatment with OCA (Fig. 5, A–C). By using a pan-cyp2c antibody, we confirmed a higher expression of mCyp2c in the liver of animals that were treated with OCA by Western blotting (Fig. 5D) and immunofluorescence (Fig. 5E).

Hepatic Cyp450 expression in vivo. NGS-derived heat-map, n = 6 mice/group (A). Real-time RT-PCR of Cyp2c39 and Cyp2c44. One-way ANOVA, alpha = 0.001, followed by Tukey’s post hoc analysis. n = 6 mice/group (B and C). Representative Western blotting of Cyp2cs (D), n = 5 mice/group from the same experiment. Representative staining of Cyp2cs. Scale bar, 100 µm (E).
Antisteatogenic Effect of OCA In Vivo.
In the animals treated only with VPA but not in those treated with VPA + OCA, the hepatic expression of the steatogenic nuclear receptor peroxisome proliferator-activated receptor γ (PPARγ) and some of its target genes, such as acyl-CoA thioesterase 1, were higher in comparison with that in the control animals (Fig. 6, A–C) (Gavrilova et al., 2003; Strand et al., 2012). PPARγ and several of its target genes were found reduced by OCA. Histologic analysis showed that hepatic lipid droplet accumulation was markedly increased in the liver of animals under VPA treatment as compared with those of the control group; with OCA pretreatment, lipid droplets were reduced (Fig. 6, D and E). Hepatic inflammation was absent in all groups (Fig. 6F), which is in line with previous studies (Szalowska et al., 2014; Zhang et al., 2014). Although VPA-induced oxidative stress could be reproduced in vitro, Huh7 cells appeared resistant to VPA-induced lipid accumulation (Supplemental Fig. 1), suggesting that, at least in vitro, oxidative stress is a primary event in VPA-induced toxicity.

Lipid accumulation in vivo. NGS-derived heat-map of PPARγ-related genes, n = 6 mice/group (A). Real-time RT-PCR of the acyl-CoA thioesterase 1 (Acot1) and the PPARγ. One-way ANOVA, alpha = 0.001, followed by Tukey’s post hoc analysis. n = 6 mice/group (B and C). Representative hematoxylin and eosin (D), BODIPY 493/503 (E), and macrophage marker MAC387 (F) staining, n = 6 mice/group. ctrl, control. Dgat, Diglyceride acyltransferase; Fabp, fatty-acid-binding protein; Slc, solute carrier; Srebf, sterol regulatory element-binding protein gene.
Discussion
VPA seems to have a pleiotropic effect on fatty acid β-oxidation. It has been shown that VPA competitively inhibits key enzymes involved in fatty acid β-oxidation, including the carnitine palmitoyltransferase 1, which mediates the first step of the translocation of medium- and long-chain fatty acid from the cytoplasm into the mitochondrial matrix, where the β-oxidation takes place (Aires et al., 2010). VPA exposure has been also associated with carnitine deprivation, which also, in turn, reduces the translocation of fatty acid from the cytosol into the mitochondrial matrix (Knapp et al., 2008). Finally, VPA has been found to promote CD36-mediated lipid hepatic uptake and triacylglycerol biosynthesis by inducing PPARγ nuclear translocation (Chang et al., 2016; Xu et al., 2019). The present work demonstrates that chronic exposure to VPA induced hepatic expression of PPARγ and its target genes. PPARγ is considered particularly important in adipocytes’ metabolic activity, yet its relevance in hepatic steatosis is underscored in several diet-induced steatosis animal models (Vidal-Puig et al., 1996; Burant et al., 1997; Chao et al., 2000; Memon et al., 2000) and by the steatosis-resistant phenotype described in mice that do not express PPARγ in the liver (Gavrilova et al., 2003; Matsusue et al., 2003; Zhang et al., 2016).
In the present study, in line with previous works, the liver of mice treated with VPA displayed extensive lipid peroxidation and ER stress, especially in the periportal areas where the oxygen tension is lower (Tong et al., 2003, 2005a). Deficiency as well as enhanced generation of ROS have been suggested to be pivotal in VPA-induced hepatotoxicity (Chang and Abbott, 2006). In vitro studies demonstrated that VPA-induced oxidative stress was enhanced by pretreatment with GSH-depleting agents, such as buthionine, sulfoximine, and diethylmaleate (Tong et al., 2005b). Patients and animals treated with VPA were characterized by decreased activities of antioxidant enzymes (e.g., glutathione peroxidase) and reduced plasma levels of antioxidant enzyme cofactors, selenium, zinc, and copper (Hurd et al., 1984; Cotariu et al., 1990). VPA-treated human lymphocytes showed microsomal metabolism-dependent generation of hydrogen peroxide and highly reactive hydroxyl radicals (OH•) (Tabatabaei et al., 1999). Finally, VPA could deplete hepatic GSH levels (Cotariu et al., 1990; Tang et al., 1995; Seçkin et al., 1999). Although vast oxidative stress induced by VPA is indisputable, the subcellular site(s) where ROSs originate is unclear, especially because many studies on VPA-induced oxidative stress are confined to in vivo models. The assessment of VPA-induced ROS production in Huh7 cells using chimeric proteins with different subcellular localization provides evidence that VPA-induced oxidative stress stems from the cytoplasm, suggesting that, although considered primarily mitochondrial-toxic, VPA can accumulate and damage other subcellular compartments, such as the plasma membrane, ER, and peroxisomes, the other major sources of cellular ROS (Kaludercic et al., 2014).
The animal model used in this study supported the general concept that lipid accumulation and oxidative stress are early events in VPA hepatotoxicity, well-visible despite the absence of obvious hepatolysis, as reflected by common liver tests (ALT and AST). However, it is unclear whether there is a causative link between lipid accumulation and oxidative stress in the onset of VPA hepatotoxicity. VPA is predicated to become hepatotoxic after conversion by the cytochrome P450 enzymes 2A6, 2B6, and 2C9 into the monounsaturated metabolite, 4-en-VPA (Kesterson et al., 1984). Based on its chemical structure being similar to methylenecyclopropylacetic acid and 4-pentenoic acid, two compounds causing Reye-like syndrome (Cotariu and Zaidman, 1988), 4-en-VPA is considered the most likely hepatotoxic metabolite, which indeed could induce steatosis in some studies in rats (Kesterson et al., 1984). However, other studies using rats observed no association between microvesicular steatosis and plasma levels of 4-en-VPA in rats (Löscher et al., 1993; Tong et al., 2005a). In a study on the VPA metabolite profiles of plasma from 470 epileptic patients under treatment with VPA, the authors even concluded that “the most toxic compound could be VPA itself” (Siemes et al., 1993). In our work, in line with these reports, oxidative stress was evident in Huh7 cells, which practically do not express VPA-metabolizing P450 (Choi et al., 2009). Although 4-en-VPA levels in Huh7 cells were not assessed, our data support the suspicion that 4-en-VPA may not be the “perpetrator,” or at least not the only “perpetrator,” in VPA-induced liver injury. It is also interesting to point out that VPA-induced oxidative stress and VPA-induced steatosis are uncoupled in Huh7 cells, with ROS levels rising in the absence of any increased lipid accumulation. We offer three possible interpretations: 1) oxidative stress and lipid accumulation are induced by different VPA metabolites, 2) oxidative stress and lipid accumulation are two independent events that concur to initiate the damage upon VPA exposure, and 3) steatosis occurs only at a later stage in the progression of the damage, as previously suggested (Tong et al., 2005a).
The sum of the effects of FXR activation and protection against VPA-induced steatosis and liver damage are seemingly complex and multifaceted. In animals in which FXR was constitutively activated, no signs of oxidative stress or steatosis were noticed. The antioxidant effect of FXR was also confirmed in Huh7 cells. FXR-binding domains have been previously identified in the promoter region of several genes involved in glutathione conjugation (glutathione S-transferases) and H2O2 reduction (Lee et al., 2010). Consistently, the mRNA levels of various glutathione transferases and peroxidases were induced by OCA treatment. A similar pattern was found also using GW4064 and 6-ethyl-chenodeoxycholic acid to activate FXR (Gui and Gai, 2015; Gai et al., 2017). Enhanced detoxification would increase: 1) rate of conjugation of 4-en-VPA to GSH (Tang et al., 1996), 2) ROS scavenging activity, and 3) 4-HNE degradation (Alary et al., 2003). Moreover, the treatment with OCA abolished the induction of PPARγ expression and PPARγ target genes involved in lipid metabolism. It has been previously shown that FXR binds to an inverted repeat-1 sequence on the PPARγ promoter (Renga et al., 2011). Another study showed that FXR regulates PPARγ via SHP (Jadhav et al., 2018). Notably, FXR was found to promote PPARγ transcription in rat hepatic stellate cells and to repress PPARγ transcription in hepatocytes, suggesting a cell-specific effect (Abdelkarim et al., 2010; Renga et al., 2011).
The effect of FXR at the level of VPA metabolism also should not be excluded. Indeed, we observed that constitutive activation of FXR induced hepatic expression of several Cyp2c genes potentially involved in 4-en-VPA production. Some murine Cyp2c family members are considered orthologs of the human CYP2C9 and CYP2A6, which convert VPA into 4-en-VPA and into the inactive 3-hydroxy-VPA and 5-hydroxy-VPA (Sadeque et al., 1997). Genetic-based evidence highlights the central role of CYP2C9 and CYP2A6 in VPA metabolism: individuals with nonfunctional CYP2C9 or CYP2A6 alleles have higher plasma VPA concentrations as compared with wild-type individuals, although no correlation was found with the levels of 4-en-VPA (Amini-Shirazi et al., 2010). Nonetheless, in the same study, patients treated with VPA and a CYP2C9 inducer had markedly elevated 4-en-VPA levels as compared with the control group (Amini-Shirazi et al., 2010). Although it is preliminary and necessitates a rigorous pharmacokinetics study, this observation suggests that variability in FXR expression level, for instance in individuals carrying genetic variants at the methionine start codon or its proximity (−1g>t, M1V, M173T) of the FXR gene (Marzolini et al., 2007; Van Mil et al., 2007; Kovacs et al., 2008), could contribute to VPA metabolism variability and perhaps to the overall pharmacokinetic/pharmacodynamic VPA profile.
Authorship Contributions
Participated in research design: Gai, Krajnc, Visentin, Kullak-Ublick.
Conducted experiments: Gai, Krajnc, Samodelov, Visentin.
Performed data analysis: Gai, Krajnc, Samodelov, Visentin.
Wrote or contributed to the writing of the manuscript: Gai, Krajnc, Samodelov, Visentin, Kullak-Ublick.
Footnotes
- Received October 21, 2019.
- Accepted February 5, 2020.
↵1 Z.G and E.K. contributed equally to this work.
This work was supported by the Swiss National Science Foundation to G.A.K.-U. [Grant 310030_175639].
↵
 This article has supplemental material available at molpharm.aspetjournals.org.

Abbreviations
- 4-HNE
- 4-hydroxynonenal
- ALT
- alanine aminotransferase
- AST
- aspartate aminotransferase
- Cyto-roGFP
- roGFP localized to the cytoplasm
- DILI
- drug-induced liver injury
- ER
- endoplasmic reticulum
- FXR
- farnesoid X receptor
- Gpx
- glutathione peroxidase
- Grp78
- 78-kDa glucose-regulated protein
- GSH
- glutathione
- Mito-roGFP
- roGFP localized to the mitochondrial matrix
- NGS
- next-generation sequencing
- OCA
- obeticholic acid
- P450
- cytochrome P450
- PPARγ
- peroxisome proliferator-activated γ
- roGFP
- redox-sensitive GFP
- ROS
- reactive oxygen species
- RT-PCR
- reverse-transcription polymerase chain reaction
- Shp
- small heterodimer partner
- VPA
- valproic acid
- Copyright © 2020 by The American Society for Pharmacology and Experimental Therapeutics


