


Abstract
Radiolabeled meta-iodobenzylguanidine (mIBG) is an important radiopharmaceutical used in the diagnosis and treatment of neuroendocrine cancers. mIBG is known to enter tumor cells through the norepinephrine transporter. Whole-body scintigraphy has shown rapid mIBG elimination through the kidney and high accumulation in several normal tissues, but the underlying molecular mechanisms are unclear. Using transporter-expressing cell lines, we show that mIBG is an excellent substrate for human organic cation transporters 1–3 (hOCT1–3) and the multidrug and toxin extrusion proteins 1 and 2-K (hMATE1/2-K), but not for the renal organic anion transporter 1 and 3 (hOAT1/3). Kinetic analysis revealed that hOCT1, hOCT2, hOCT3, hMATE1, and hMATE2-K transport mIBG with similar apparent affinities (Km of 19.5 ± 6.9, 17.2 ± 2.8, 14.5 ± 7.1, 17.7 ± 10.9, 12.6 ± 5.6 µM, respectively). Transwell studies in hOCT2/hMATE1 double-transfected Madin-Darby canine kidney cells showed that mIBG transport in the basal (B)-to-apical (A) direction is much greater than in the A-to-B direction. Compared with control cells, the B-to-A permeability of mIBG increased by 20-fold in hOCT2/hMATE1 double-transfected cells. Screening of 23 drugs used in the treatment of neuroblastoma identified several drugs with the potential to inhibit hOCT- or hMATE-mediated mIBG uptake. Interestingly, irinotecan selectively inhibited hOCT1, whereas crizotinib potently inhibited hOCT3-mediated mIBG uptake. Our results suggest that mIBG undergoes renal tubular secretion mediated by hOCT2 and hMATE1/2-K, and hOCT1 and hOCT3 may play important roles in mIBG uptake into normal tissues.
SIGNIFICANCE STATEMENT mIBG is eliminated by the kidney and extensively accumulates in several tissues known to express hOCT1 and hOCT3. Our results suggest that hOCT2 and human multidrug and toxin extrusion proteins 1 and 2-K are involved in mIBG renal elimination, whereas hOCT1 and hOCT3 may play important roles in mIBG uptake into normal tissues. These findings may help to predict and prevent adverse drug interaction with therapeutic [131I]mIBG and develop clinical strategies to reduce [131I]mIBG accumulation and toxicity in normal tissues and organs.
Introduction
Neuroblastoma is a neuroendocrine cancer derived from the neural crest cells of the sympathetic nervous system. It is the most common extracranial solid tumor in children and accounts for over 15% of all pediatric cancer mortalities in the United States (Maris et al., 2007). Prognosis and treatment strategies for neuroblastoma are stratified to low, intermediate, or high risk based on age, tumor stage, and biologic factors (Park et al., 2010). Although low- and intermediate-risk patients often have great treatment outcomes, many high-risk patients with neuroblastoma are metastatic at time of diagnosis and undergo aggressive multimodal therapy with overall survival rates still less than 50% (Matthay et al., 1999; Parisi et al., 2016). Therefore, there is an urgent need for new therapeutic agents and strategies for high-risk patients with neuroblastoma.
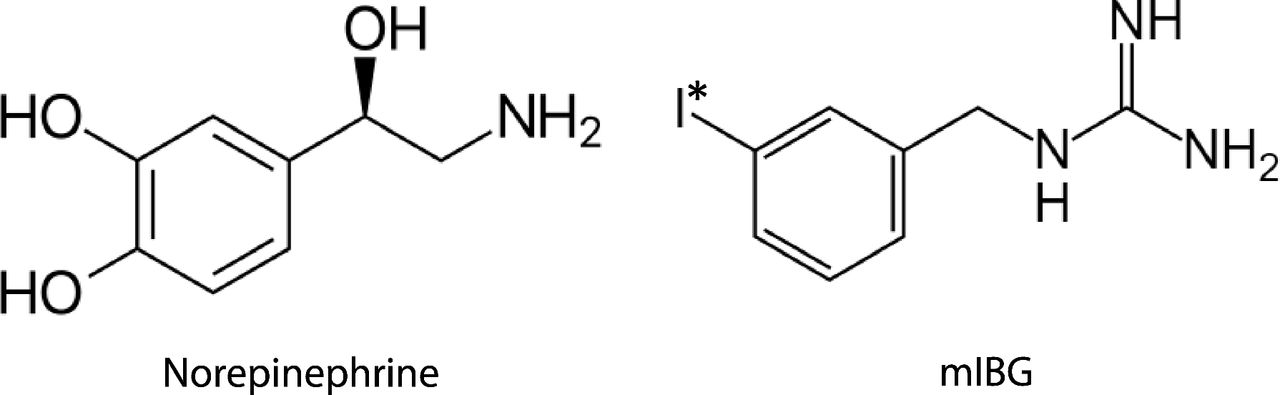
Radioiodine-labeled meta-iodobenzylguanidine (mIBG) is a targeted radiopharmaceutical used in both the diagnosis and treatment of neuroblastoma and other neuroendocrine tumors (e.g., pheochromocytoma, paraganglioma). Originally developed as a structural analog of norepinephrine (Fig. 1) for adrenal cortex imaging, mIBG is taken up into tumor cells by the norepinephrine transporter (NET, SLC6A2), which is highly expressed in neuroendocrine tumors (Streby et al., 2015). 123I-labeled mIBG (iobenguane I-123 or AdreView) was approved by the US Food and Drug Administration (FDA) in 2008 for γ detection of primary or metastatic neuroblastoma and pheochromocytoma. When mIBG is labeled with iodine 131, the β emission penetrates tumor cells, resulting in DNA damage and cell death. In 2018, [131I]mIBG (iobenguane I-131 or Azedra) was FDA-approved for treatment of advanced or metastatic pheochromocytoma and paraganglioma in adults. Currently, high-dose [131I]mIBG is under clinical investigation as a frontline therapy for high-risk neuroblastoma, either as monotherapy or in combination with other agents with improved clinical response (Parisi et al., 2016).

Structure of norepinephrine and meta-iodobenzylguanidine (mIBG). I* represents the isotope of iodine commonly used for diagnosis (123I) or targeted radiotherapy (131I).
Clinically, mIBG is given to patients by intravenous injection. The drug does not undergo hepatic metabolism, and the majority of the administered dose is rapidly excreted into the urine unchanged (Blake et al., 1989; Parisi et al., 2016). Besides glomerular filtration, evidence suggest that mIBG may also undergo active secretion in the kidney (Ehninger et al., 1987). Whole-body scintigraphy shows that besides NET-mediated uptake into tumor lesions, mIBG also has extensive uptake and accumulation in several normal tissues, including the liver, salivary glands, heart, intestines, and adrenal glands (Coleman et al., 2009; Chin et al., 2014). The high accumulation of radioactive mIBG in the normal tissues presents several challenges. First, uptake into normal tissues may interfere with [123I]mIBG tumor imaging, leading to an increased rate of false negatives (Parisi et al., 2016). Furthermore, uptake of [131I]mIBG into normal tissues can compete with tumor uptake, leading to reduced antitumor efficacy. Lastly, the high uptake and accumulation in normal tissues is associated with several radiation-induced toxicities (Bleeker et al., 2013). Therefore, an understanding of how mIBG is transported in normal tissues is essential for developing strategies to enhance mIBG efficacy while minimizing toxicity.
The organic cation transporters (OCTs) are a group of solute carrier transporters expressed in various tissues that mediate cellular transport of a wide array of endogenous and exogenous organic cations (Giacomini et al., 2010; Wagner et al., 2016). This group includes the membrane potential–driven OCT1 (SLC22A1), OCT2 (SLC22A2), and OCT3 (SLC22A3) and the electroneutral multidrug and toxin extrusion proteins 1 (MATE1, SLC47A1) and 2-K (MATE2-K, SLC47A2). In humans, OCT1 is the major isoform expressed in the liver, and it mediates organic cation uptake into the hepatocytes. In the kidney, OCT2 and MATE1/2-K are respectively expressed at the basolateral and apical membranes of renal proximal tubule cells and work cooperatively to mediate tubular secretion of organic cations (Giacomini et al., 2010; Wagner et al., 2016). OCT3 is broadly expressed in many tissues, including salivary glands, heart, and placenta, and we previously demonstrated an important role of OCT3 in drug uptake and transport in these tissues (Lee et al., 2014, 2018; Wagner et al., 2018).
Previous data have implicated OCTs and MATEs in the transport of mIBG (Bayer et al., 2009; Ito et al., 2012). However, the transport kinetics of mIBG have not been determined for these transporters. It is not known whether mIBG can be actively secreted by the renal OCT2/MATEs pathway. In this study, we characterized the detailed interactions of mIBG with hOCT1–3 and hMATE1/2-K in comparison with the classic mIBG transporter hNET. The possibility of hOCT2/hMATE-mediated renal secretion of mIBG was investigated by using an in vitro model of renal transepithelial transport. Lastly, the potential of mIBG interaction with other FDA-approved oncology drugs at the sites of OCTs and MATEs was evaluated.
Materials and Methods
Materials.
Meta-iodobenzylguanidine, glyburide, and pyrimethamine were purchased from Sigma-Aldrich (St. Louis, MO). [3H]methyl-4-phenylpyridinium (1-methyl-4-phenylpyridinium, 80 Ci/mmol), [14C]para-aminohippuric acid, 55 mCi/mmol, [3H]estrone sulfate (50 Ci/mmol), and [3H]mannitol (20 Ci/mmol) were purchased from American Radiolabeled Chemicals, Inc. (St. Louis, MO). [14C]metformin (112 mCi/mmol) was purchased from Moravek Biochemicals, Inc. (Brea, CA). Optima grade of acetonitrile and formic acid were obtained from Thermo Fisher (Rockford, IL). Cell culture media and reagents were purchased from Invitrogen (Carlsbad, CA).
Cell Culture.
Flp-In human embryonic kidney (HEK) 293 cells stably transfected with human OCT1 (hOCT1), hOCT2, hOCT3, human organic anion transporter 1 (hOAT1, SLC22A6), hOAT3 (SLC22A8), hMATE1, and hMATE2-K and the empty pcDNA5/FRT vector (control) were previously generated in our laboratory (Duan and Wang, 2010; Yin et al., 2015). The cells were maintained in Dulbecco’s modified Eagle’s medium supplemented with 10% fetal bovine serum, 2 mM l-glutamine, 100 U/ml penicillin, 100 µg/ml streptomycin, and 150 µg/ml hygromycin B. The surface of the flasks was coated with 0.01% poly-d-lysine in phosphate-buffered saline to promote HEK293 cell attachment. The Madin-Darby canine kidney (MDCK) cells double-transfected with hOCT2 and hMATE1 or empty vector were previously generated in our laboratory (Yin et al., 2015). The MDCK cells were maintained in minimum essential medium supplemented with 10% fetal bovine serum, 500 µg/ml G418, and 200 µg/ml hygromycin B. Cells were cultured in a 37°C incubator with 5% CO2.
Uptake and Inhibition Assays in HEK293 Cells.
Uptake and inhibition assays were conducted as previously described with slight modifications to analyze mIBG by liquid chromatography–tandem mass spectrometry (LC-MS/MS) (Duan and Wang, 2010; Wagner et al., 2017). The cells were seeded on 96-well plates and grown to greater than 90% confluency. Cells were washed with warm Hank’s balanced salt solution (HBSS) buffer (1.3 mM CaCl2, 0.4 mM KH2PO4, 0.8 mM MgSO4, 0.3 mM Na2HPO4, 5.4 mM KCl, 137 mM NaCl, 4.2 mM NaHCO3, and 5.6 mM d-glucose) three times. Experiments were initiated by addition of 100 µl of HBSS containing mIBG with or without an inhibitor. Uptake was quenched by removing the warm HBSS with mIBG and subsequently washing the cells three times with 200 µl ice-cold HBSS. For hMATE1/2-K uptake assays, the pH in the HBSS was adjusted to pH 8.0 to create an outwardly directed proton gradient. After washing, cells were lysed with 200 µl acetonitrile containing glyburide as an internal standard. Twenty microliters of lysate were diluted in water to 10% acetonitrile for mIBG quantification. In all mIBG uptake experiments, the activities of the expressed transporters were verified with a 3H- or 14C-labeled probe substrate (1-methyl-4-phenylpyridinium and metformin for hOCT1–3 and hMATE1/2-K, para-aminohippuric acid for hOAT1, estrone sulfate for hOAT3) (data not shown). In these reference experiments using probe substrates, cells were lysed with 100 µl 1 M NaOH and neutralized with 100 µl 1 M HCl after 1 hour. At the end of the uptake experiment, 150 µl of the lysates was taken from the cell lysate for analysis of the total radioactivity by using a Tri-Carb Liquid Scintillation Counter (Perkin Elmer, Waltham, MA). Twenty microliters of the lysate was taken from the reference cell lysates to estimate the total protein amount by using the BCA method. Variation in total protein amount was less than 10% coefficient of variation.
Transwell Studies in hOCT2/hMATE1 Double-Transfected MDCK Cells.
mIBG transepithelial transport in control and hOCT2/hMATE1 double-transfected MDCK cells was conducted as previously described with slight modifications (Yin et al., 2015). MDCK cells were seeded at a density of 1 × 10⁵ cells/ml on Falcon inserts (12-well, translucent, high-density positron emission tomography membrane, 0.4-µm pore size) in 12-well plates and grown for 5 days. The inserts and wells were washed three times with warm HBSS. The transepithelial electrical resistance was then measured, and monolayers with transepithelial electrical resistance values greater than 180 Ω*cm2 were used for the study. Apical-to-basal (A-to-B) transport of mIBG was initiated by adding 800 µl of HBSS (pH = 6.0) containing 1 µM mIBG to the A chamber. For B-to-A transport, 2 ml of HBSS (pH = 7.4) containing 1 µM mIBG was added to the B chamber. At each time point, 50 µl of sample from the opposite chamber was collected for mIBG quantification and replaced with an equal volume of the appropriate HBSS buffer. At the end of the experiment, transport was terminated by removing the buffers from A and B chambers, and the inserts were washed three times with ice-cold HBSS. To quantify mIBG by LC-MS/MS, 20 µl of the collected samples were diluted in water to a final concentration of 10% HBSS and 10% acetonitrile with 50 nM glyburide. Cells on the inserts were lysed by adding 1 ml of 10% acetonitrile containing 50 nM glyburide. The lysates were centrifuged, and 100 µl of the lysate was analyzed for LC-MS/MS quantification of mIBG. Twenty microliters of the lysates was used for total protein quantification by BCA method.
Inhibition Screen of mIBG Uptake by FDA-Approved Oncology Drugs.
The FDA-approved oncology drugs were obtained from the Developmental Therapeutics Program at the National Cancer Institute (NCI). The 96-well plates provided from NCI had 20 µl of 10 mM of each drug in DMSO. The drugs selected to be screened are drugs used as part of the standard treatment of high-risk neuroblastoma or used in clinical trials in combination with [131I]mIBG targeted radiotherapy. These drugs were diluted to 20 µM for the experiments. The uptake was initiated by addition of 1 µM mIBG to uptake buffer with or without the inhibitors. At the end of uptake, cells were lysed by adding 200 µl of 10% acetonitrile containing 50 nM glyburide and were analyzed for LC-MS/MS quantification of mIBG.
Quantification of mIBG by LC-MS/MS.
Because of concerns of radiation and rapid isotope decay (t1/2 ∼13 hours for 123I and 8 days for 131I), nonradioactive mIBG was used and quantified by LC-MS/MS. An AB Sciex API 4000 QTrap mass spectrometer (Foster City, CA) coupled with an Acquity ultra-performance liquid chromatography system (Waters Corporation, Milford, MA) operated in the positive electrospray ionization mode was used to quantify mIBG. The cell lysates or transwell samples diluted to 10% acetonitrile and containing 50 nM glyburide as an internal standard were injected (10 µl) onto the column (Zorbax Eclipse Plus C18, 2.1 × 50 mm, 1.8 µm; Agilent Technologies, Santa Clara, CA). The mobile phase consisted of 0.1% (v/v) formic acid in water (A) and 0.1% (v/v) formic acid in acetonitrile (B) with gradient elution at 0.4 ml/min flow as follows: 3% B until 0.1 minutes, increased to 90% B by 2 minutes, then returned to 3% B over 0.1 minutes, and holding with a total run time of 4 minutes. The mass-to-charge transitions used for quantification of mIBG and glyburide were 276.1 → 216.97 and 494.1C → 369, respectively. The quantification limit of mIBG was 0.1 nM, and the method was linear up to 8 µM. Instrument control and data processing were performed by using Analyst software 1.6 (AB Sciex). Accuracy was within 20% for each batch.
Data Analysis.
The uptake and inhibition studies were performed in triplicate and repeated three times independently. The data were fitted by nonlinear regression by using GraphPad Prism 7.0 (GraphPad Software Inc., La Jolla, CA) to obtain graphs and kinetic parameters. The uptake kinetics data were fitted to the Michaelis-Menten equation: (1)where v is the uptake velocity, Vmax is the maximum uptake velocity of the system, Km is the Michaelis-Menten constant, and [S] is the substrate concentration. For the transwell experiments, the apparent permeability (Papp) of mIBG was calculated by using the following equation:
 (2)where Q is the amount of compound transporter over time, t is time, A is the insert membrane surface area, and Co is the initial compound concentration in the donor chamber. For the dose-dependent inhibition of transporter-mediated uptake of mIBG, the IC50 was calculated by using the following equation:
 (3)where v is the rate of uptake in the presence of the inhibitor, Bottom is the noninhibitable baseline value, Top is the rate of uptake in the absence of the inhibitor, [I] is the concentration of the inhibitor, IC50 is the concentration to inhibit 50% of the transporter activity, and H is the Hill coefficient. Statistical significance was determined by using a one-way ANOVA followed by Dunnett’s test or an unpaired Student’s t test by using the Bonferroni method as specified in the figure legends. A P value less than 0.05 was considered statistically significant.
Results
Uptake of mIBG by Organic Cation and Anion Transporters.
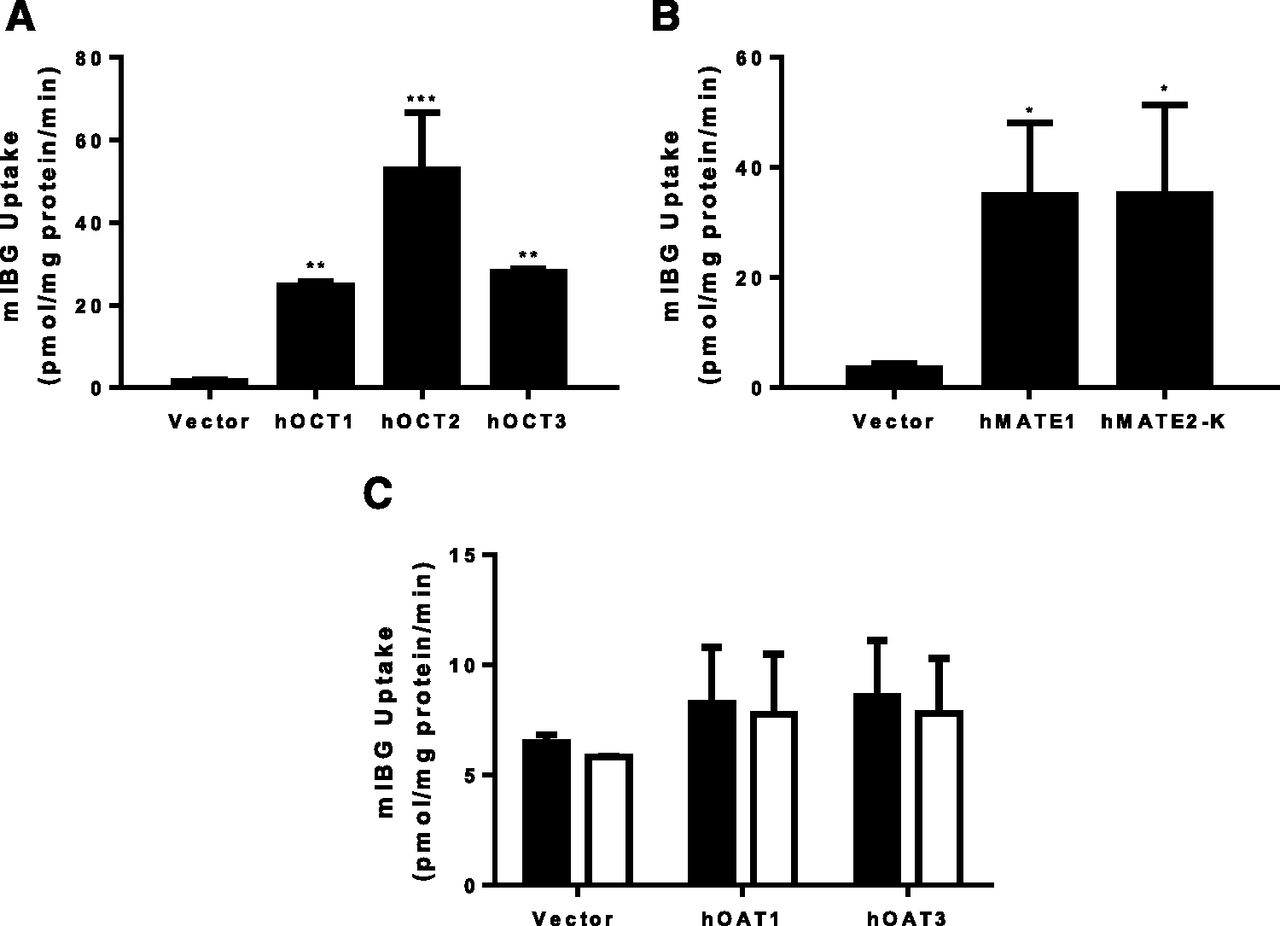
Uptake of mIBG was measured in vector-transfected HEK293 cells and in cells stably expressing hOCT1, hOCT2, hOCT3, hMATE1, or hMATE2-K. We also tested hOAT1 and hOAT3, as some drugs can be transported by both renal organic cation and anion transporters (Yin et al., 2019). Compared with the vector control, mIBG (1 µM) uptake was substantially increased in cells expressing hOCT1, hOCT2, hOCT3, hMATE1, and hMATE2-K after a 30-minute incubation (Fig. 2, A and B). Cells expressing the renal organic anion transporters hOAT1 or hOAT3 showed a negligible increase in mIBG uptake (Fig. 2C). The classic OAT inhibitor probenecid had no effect in mIBG uptake in these cells. These data demonstrated that mIBG is a substrate of hOCT1–3 and hMATE1/2-K but not hOAT1/3.

Uptake of mIBG by selected drug transporters. Uptake of 1 µM mIBG by hOCT1–3 (A), hMATE1/2-K (B), and hOAT1/3 (C) was measured in both transporter-expressing and control HEK293 cells. For hOAT1/3, the uptake of mIBG was measured in the absence (filled bars) and in the presence of 100 µM probenecid (empty bars). The uptake was measured after a 30-minute incubation at 37°C. Data are presented as the means ± S.D. from three independent experiments. The uptake of mIBG in transporter-expressing HEK293 cells was compared with control HEK293 cells (*P < 0.05; **P < 0.01; ***P < 0.001). Statistical significance was determined by using a one-way ANOVA followed by Dunnett’s test.
Time-Dependent mIBG Uptake by hNET, hOCT1, hOCT2, and hOCT3.
Selection of time points in the initial linear phase (i.e., initial uptake rates) is critical for accurate determination of transporter kinetic parameters (Brouwer et al., 2013). To define the initial rate range of mIBG uptake by hNET, hOCT1, hOCT2, and hOCT3, time-dependent uptake of mIBG (1 μM) was examined. As shown in Fig. 3, mIBG uptake in hNET-expressing cells increased linearly in the early time points and reached plateau around 20 minutes. Similarly, mIBG uptake in cells expressing hOCT1, hOCT2, and hOCT3 also increased linearly within the first 2–5 minutes and reached a plateau around 20 minutes. In contrast, mIBG uptake in vector-transfected HEK293 cells was much lower at all tested time points. At 45 minutes, mIBG concentrations in cells expressing hNET and hOCT1/2/3 were about 9- to 62-fold higher than that in control cells.

Time-dependent uptake of mIBG by hNET and hOCT1–3. Uptake of 1 µM mIBG was measured in control and hNET- (A), hOCT1- (B), hOCT2- (C), and hOCT3- (D) expressing HEK293 cells at specified time points at 37°C. Time courses were performed independently for three times, and results from one representative experiment were shown. Data points represent the means ± S.D. in triplicate.
Concentration-Dependent mIBG Uptake by hNET, hOCT1, hOCT2, and hOCT3.
mIBG time course in cells expressing hNET and hOCT1–3 showed that the initial linear phase lasted up to 5–10 minutes (Fig. 3). Hence, kinetic studies were performed by using 2 minutes as the incubation time. Transporter-specific uptake was obtained by subtracting uptake in the control cells from that in transporter-expressing cells. As shown in Fig. 4, hNET-, hOCT1-, hOCT2-, and hOCT3-mediated uptake of mIBG displays typical Michaelis-Menten saturation curves. The corresponding Km and Vmax values for each transporter were derived from nonlinear regression fitting to eq. 1 and are summarized in Table 1. Interestingly, hOCT1–3 displayed similar apparent affinities for mIBG in the low micromolar range (Km values of 19.5 ± 6.9, 17.2 ± 2.8, and 14.5 ± 7.1 µM for hOCT1, hOCT2, and hOCT3, respectively). The Km values for hOCT1–3 were about 2-fold higher than that of hNET (8.7 ± 1.4 µM) determined under the same experimental condition (Table 1).
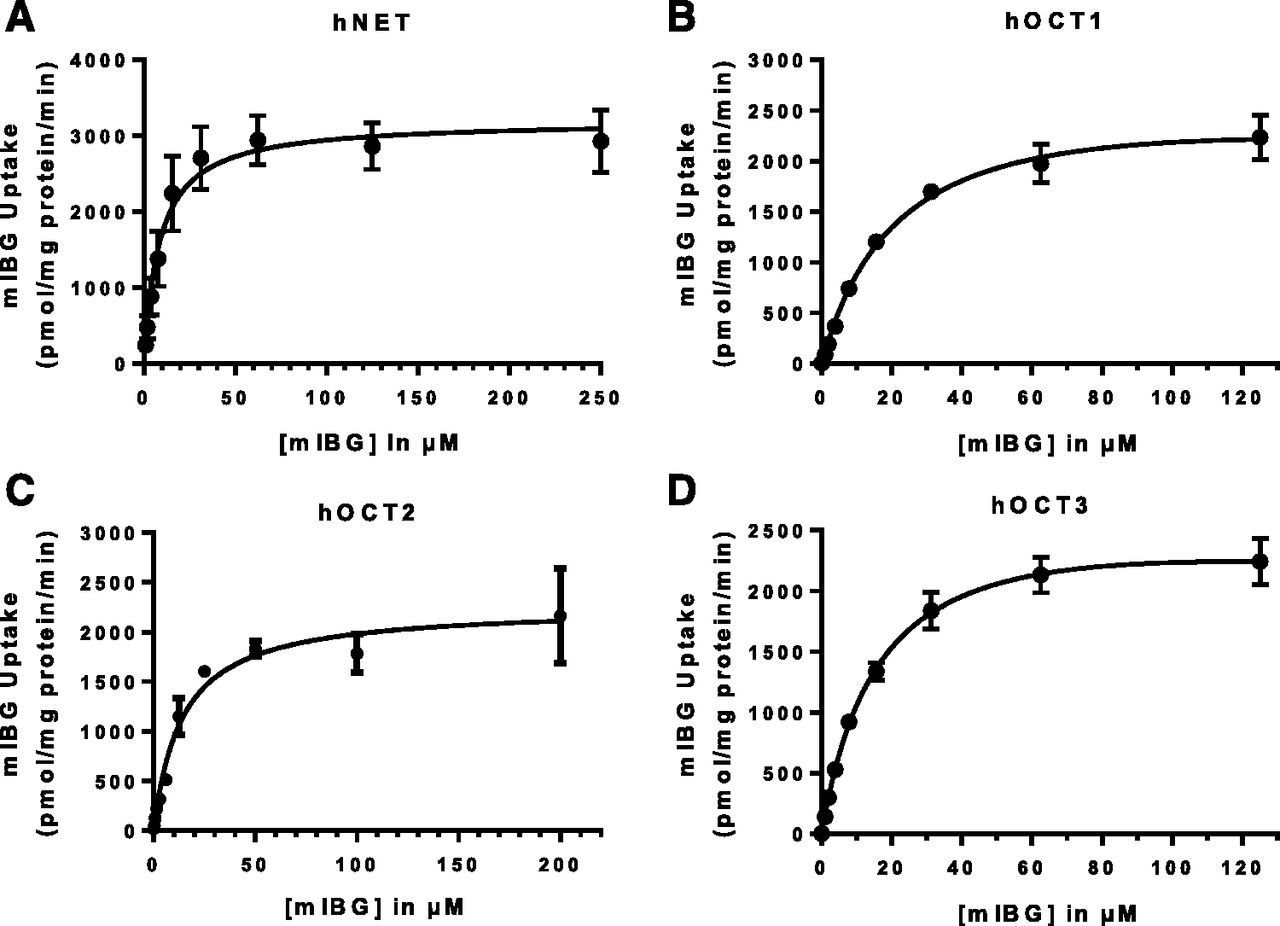
Concentration-dependent uptake of mIBG by hNET and hOCT1–3. Concentration-dependent uptake of mIBG was measured in control and hNET- (A), hOCT1- (B), hOCT2- (C), hOCT3- (D) expressing HEK293 cells after a 2-minute incubation. Transporter-specific uptake was obtained by subtracting the activity in control cells from the activity in transporter-expressing cells. The data were fitted by nonlinear regression to eq. 1. Concentration-dependent uptake was performed independently for three times for each transporter, and results from one representative experiment were shown. Data points represent the means ± S.D. in triplicate.
Kinetic parameters of mIBG uptake by hNET, hOCT1–3, and hMATE1/2-K
Concentration-dependent uptake was performed in three independent experiments. The Km and Vmax values for each experiment were obtained by fitting the data to eq. 1 by nonlinear regression. The mean values (means ± S.D.) of the Km or Vmax from the three independent experiments are shown in the table.
mIBG Uptake Kinetics by hMATE1 and hMATE2-K.
hMATE1 and hMATE2-K function as proton/organic cation exchangers and require a proton gradient to drive substrate transport (Otsuka et al., 2005). The transport kinetics of mIBG for hMATE1 and hMATE2-K were determined in uptake studies with the buffer pH adjusted to 8.0. Similar to hOCT1–3, hMATE1/2-K exhibited linear uptake in the first 5 minutes (Fig. 5, A and B), and kinetic measurement was conducted with a 2-minute incubation time. hMATE1- and hMATE2-K-mediated uptake of mIBG was saturable, with Km values of 17.7 ± 10.9 and 12.6 ± 5.6 µM, respectively (Fig. 5, C and D; Table 1). These Km values are comparable to those of hOCT1–3, suggesting that mIBG interacts with hMATEs and hOCTs with similar apparent affinities.

mIBG uptake kinetics by hMATE1/2-K. The time-dependent uptake of 1 µM mIBG was measured in control and hMATE1- (A) and hMATE2-K- (B) expressing HEK293 cells at specified time points at 37°C in HBSS buffer with pH adjusted to 8.0. Concentration-dependent uptake of mIBG was measured in control and hMATE1- (C) and hMATE2-K- (D) expressing HEK293 cells after a 2-minute incubation. Transporter-specific uptake was obtained by subtracting the activity in control cells from the activity in transporter-expressing cells. The data were fitted by nonlinear regression to eq. 1. Uptake was performed independently for three times, and results from one representative experiment were shown. Data points represent the means ± S.D. in triplicate.
Transcellular Transport of mIBG in hOCT2/hMATE1-Transfected MDCK Cells.
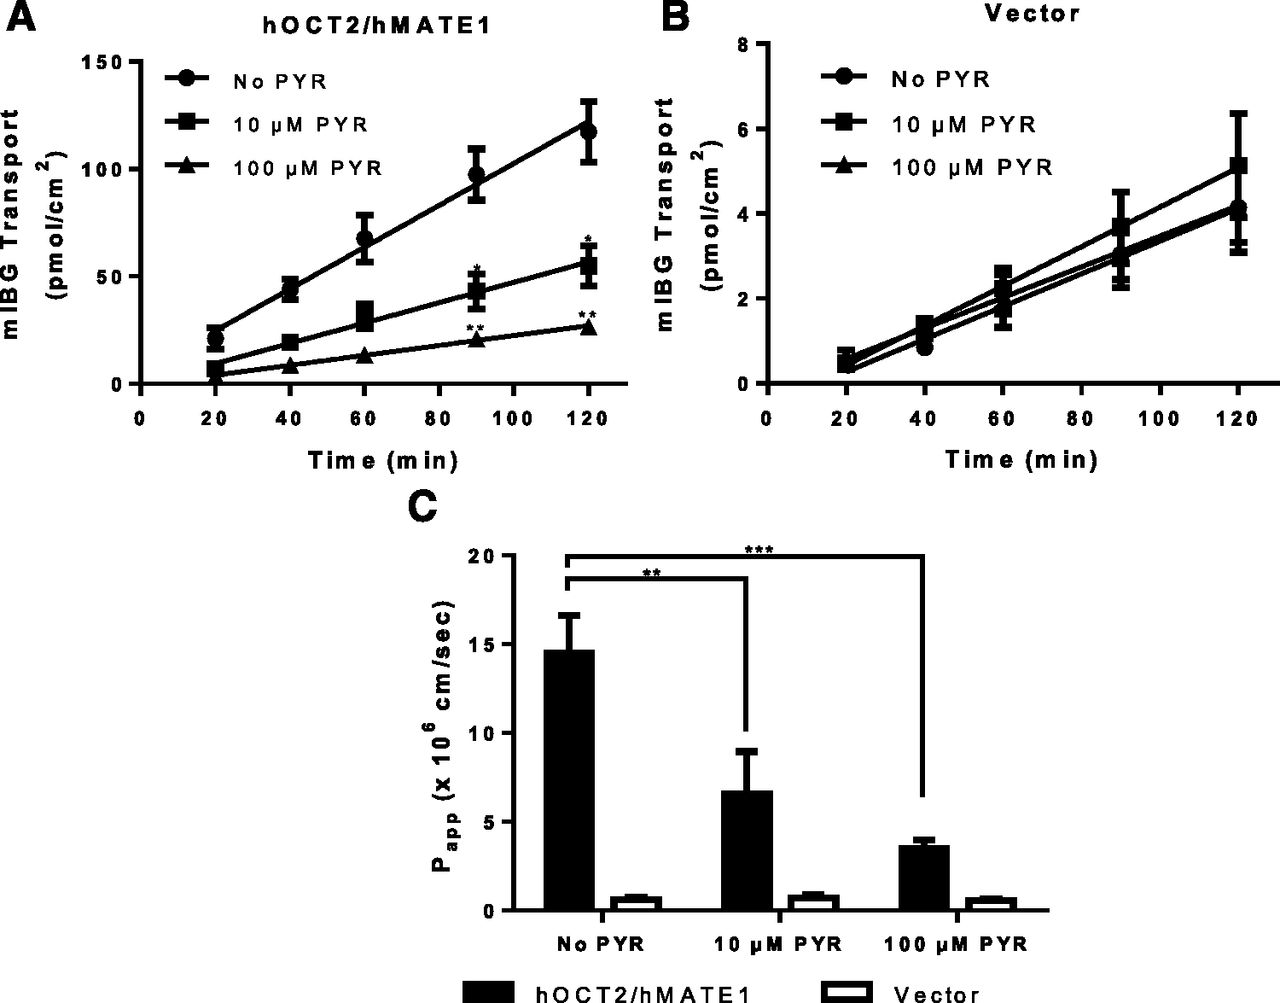
In renal proximal tubule cells, hOCT2 and hMATE1/2-K cooperatively mediate transepithelial secretion of organic cations from the blood side to the urine side. To determine whether mIBG can be secreted by this pathway, transepithelial flux of mIBG was measured in MDCK cells stably expressing hOCT2 and hMATE1. Transport studies were performed under a pH gradient (apical pH 6.0 and basal pH 7.4) to simulate the physiologic condition. [14C]metformin and [3H]mannitol transport in this system were run in parallel to ensure monolayer integrity and transporter activity (data not shown). The mIBG flux rate was constant for 120 minutes in both control and hOCT2/hMATE1 cells. In the hOCT2/hMATE1 double-transfected cells, flux of mIBG in the B-to-A direction was much greater than in the A-to-B direction (Fig. 6A). In contrast, mIBG flux in the control cells in B-to-A and A-to-B directions was substantially lower. The calculated B-to-A permeability of mIBG in hOCT2/hMATE1-transfected cells was 12.6 ± 2.7 × 10⁻⁶ cm/s, which is 20-fold higher than control cells (Fig. 6B), suggesting that the presence of hOCT2/hMATE1 in proximal tubule cells greatly facilitates secretory transport of mIBG from the blood side to the lumen side. Interestingly, despite a 20-fold increase in mIBG B-to-A permeability, intracellular mIBG accumulation in hOCT2/hMATE1 cells was marginally increased when compared with control cells (Fig. 6C). Pyrimethamine, a known inhibitor of hMATE1/2-K and hOCT2, dose-dependently inhibited the B-to-A flux and permeability of mIBG in hOCT2/hMATE1 double-transfected cells but had no effect in vector-transfected control cells (Fig. 7), confirming that the observed vectorial transport of mIBG is mediated by hOCT2/hMATE1. These proof-of-concept studies suggest that mIBG undergoes hOCT2/hMATE1-mediated secretion in the kidney. Given that mIBG is also transported by hMATE2-K with similar apparent affinities, we expect that hMATE2-K contributes to mIBG efflux alongside hMATE1 at the apical membrane of renal proximal tubule cells.

Transcellular flux, permeability, and intracellular accumulation of mIBG in vector-transfected (control) and hOCT2/hMATE1 double-transfected MDCK cells. (A) mIBG transport in control and hOCT2/hMATE1 MDCK monolayers. The MDCK cells were grown for 5 days to form a monolayer on the Falcon insert. On the 5th day, the cells were washed and incubated in HBSS buffer containing 1 µM mIBG in either the apical or basal chamber to initiate transport. An aliquot of buffer (50 µl) was taken periodically from the receiving chamber and replenished with an equal volume of HBSS buffer. mIBG in the aliquot was subsequently measured by LC-MS/MS. The pH of apical and basal chamber was 6.0 and 7.4, respectively. A-to-B, apical to basal; B-to-A, basal to apical. (B) Permeability of mIBG was calculated by using eq. 2. (C) Intracellular accumulation of mIBG was measured at the end of the 120-minute incubation. Transport, permeability, and accumulation in the B-to-A direction were compared with those in the A-to-B direction (*P < 0.05; **P < 0.01). Permeability and accumulation in hOCT2/hMATE1 MDCK cells were also compared with those in the control cells (##P < 0.01). Statistical significance was determined by using an unpaired Student’s t test with the Bonferroni method to correct for multiple comparisons. Each data point represents the means ± S.D. from three independent experiments.

Effect of pyrimethamine on B-to-A flux of mIBG in hOCT2/hMATE1 double-transfected and control MDCK cells. mIBG transport in hOCT2/hMATE1 (A) and vector control (B) MDCK monolayers. Cells were incubated in HBSS buffer containing 1 µM mIBG in the basal chamber. B-to-A flux of mIBG was measured in the absence or presence of 10 or 100 µM pyrimethamine (PYR) added to both chamber A and B. At various time points, 50 µl from chamber A was taken and replenished with an equal volume of HBSS buffer with the corresponding concentration of pyrimethamine. The pH of chamber A and B was maintained at 6.0 and 7.4, respectively. (C) Permeability of mIBG was calculated by using eq. 2. The time course data were fitted with linear regression. B-to-A transport and permeability of mIBG in the presence of 10 or 100 µM pyrimethamine in hOCT2/hMATE1 MDCK cells were compared with those in the absence of pyrimethamine (*P < 0.05; **P < 0.01; ***P < 0.001). The statistical significance was determined by using an unpaired Student’s t test with the Bonferroni method to correct for multiple comparisons. Each data point represents the means ± S.D. from three independent experiments.
Inhibitory Effect of Selected FDA-Approved Oncology Drugs on mIBG Uptake by hOCT1–3 and hMATE1/2-K.
The uptake and transwell studies strongly suggest that mIBG can be taken up into normal tissues by hOCTs and secreted by the renal hOCT2/hMATEs transporters. As mIBG is frequently used with other anticancer drugs, this raises a concern of potential drug-drug interaction (DDI) at the site of these transporters. We therefore screened 23 FDA-approved oncology drugs obtained from NCI. The drugs are either used in standard treatment regimen of high-risk neuroblastoma or in clinical trials for combination use with [131I]mIBG therapy. These drugs were screened at a relatively low concentration (20 µM) to identify potential inhibitors of mIBG transport mediated by hOCT1–3 and hMATE1/2-K. At the tested concentration, irinotecan selectively inhibited hOCT1-mediated mIBG uptake by more than 50% (Fig. 8A). Dose-dependent inhibition studies further revealed that irinotecan was at least 17-fold more potent for hOCT1 than for hOCT2 and hOCT3 (Fig. 9A; Table 2). Several tyrosine kinase inhibitors (gefitinib, sunitinib, crizotinib, and vandetanib) inhibited one or more hOCTs by more than 50% (Fig. 8A). Interestingly, crizotinib, a targeted tyrosine kinase inhibitor (TKI) used in the treatment of high-risk neuroblastoma, showed potent and preferential inhibition of hOCT3, blocking hOCT3-mediated mIBG uptake by approximately 85%. The IC50 determined from the dose-dependent inhibition studies showed that crizotinib inhibition of hOCT3 was 6.7-fold and 18-fold more potent than for hOCT2 and hOCT1, respectively (Fig. 9B; Table 2). Uptake of mIBG by hMATE1 and 2-K appeared to be less affected by the tested drugs (Fig. 8B). Crizotinib and cis-retinoic acid showed 25%–55% inhibition of hMATE1 and hMATE2-K. No other compounds showed greater than 50% inhibition at the tested concentration.
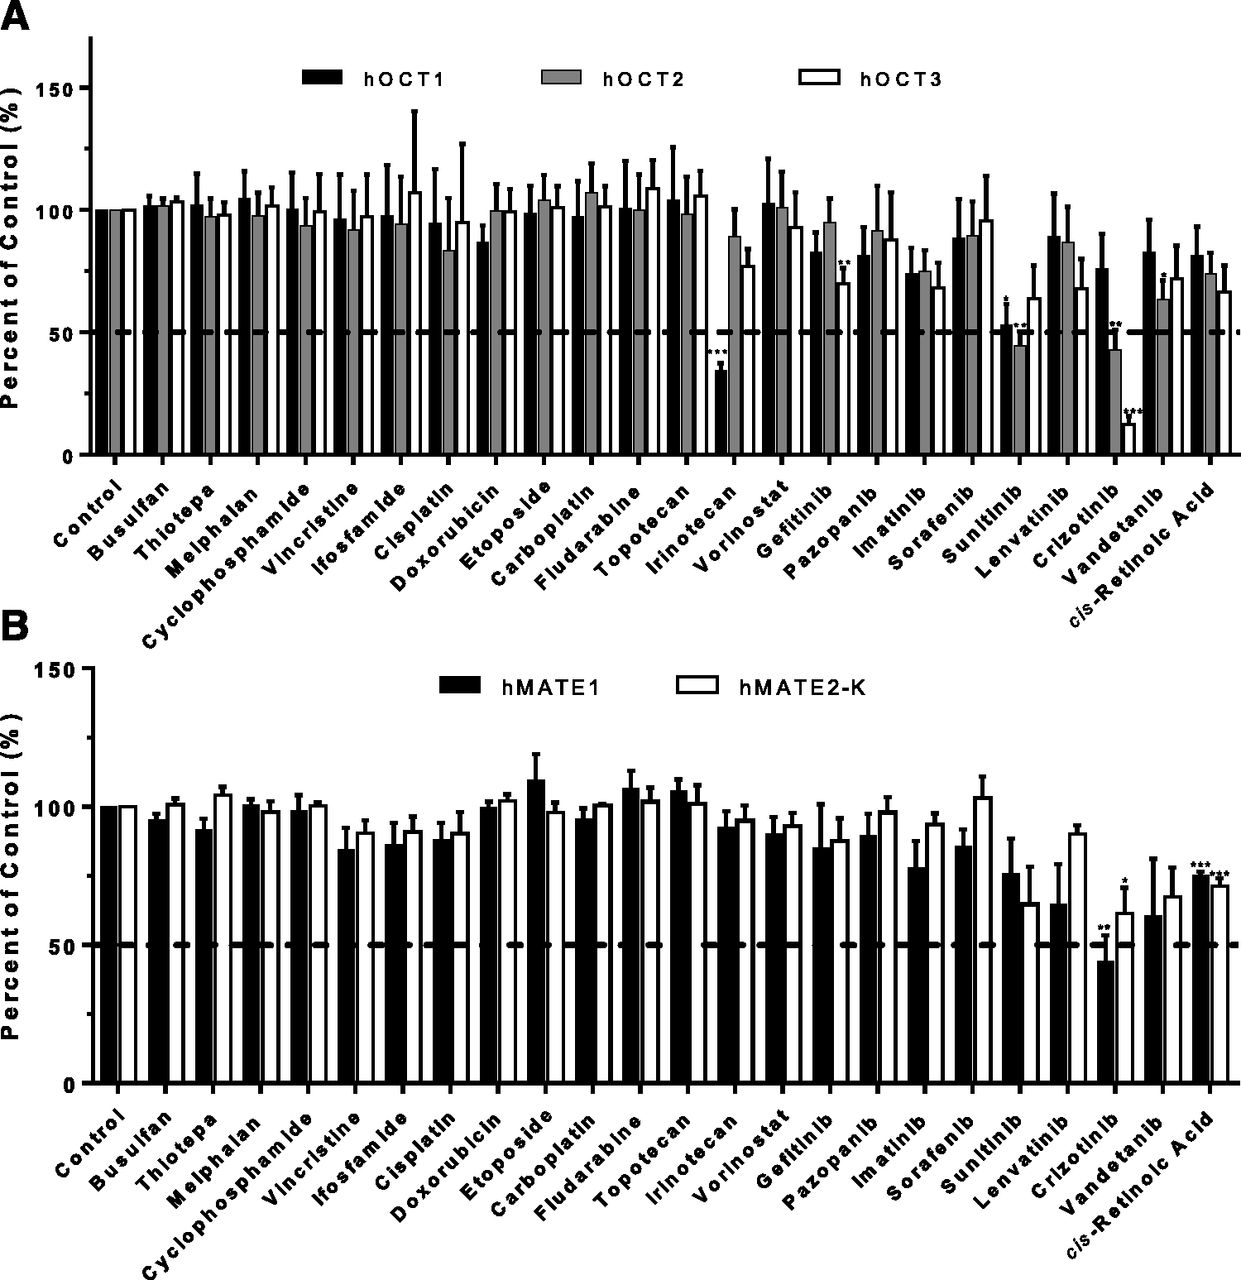
Effect of selected oncology drugs on mIBG uptake mediated by hOCT1–3 (A) and hMATE1/2-K (B). The selected FDA-approved oncology drugs were obtained from the National Cancer Institute. The 2-minute uptake of 1 µM mIBG was measured in the absence and presence of 20 µM of the selected oncology drugs in vector, hOCT1–3-, and hMATE1/2-K-transfected HEK293 cells. Transporter-specific uptake of mIBG was obtained by subtracting the activity in vector-transfected cells from the activity in transporter-expressing cells. The uptake data were expressed as a percentage of mIBG uptake in in the absence of an inhibitor (control). The uptake of mIBG in the presence of an oncology drug was compared with the control (*P < 0.05; **P < 0.01; ***P < 0.001). Statistical significance was determined by using an unpaired Student’s t test with the Bonferroni method to correct for multiple comparisons. Each bar indicates the means ± S.E. from three independent experiments. The horizontal dashed lines indicate 50% inhibition.

Dose-dependent inhibition of hOCT1–3 by irinotecan and crizotinib. Uptake of 1 µM mIBG in the absence and presence of irinotecan (A) and crizotinib (B) was measured in vector, hOCT1-, hOCT2-, and hOCT3-expressing HEK293 cells for 2 minutes at 37°C. Transporter-specific uptake of mIBG was obtained by subtracting the activity in vector-transfected cells from the activity in transporter-expressing cells. The uptake data were expressed as a percentage of mIBG uptake in the absence of irinotecan or crizotinib (control). Each data point represents the means ± S.E. from three independent experiments.
The IC50 values of irinotecan and crizotinib for hOCT1–3-mediated mIBG uptake
Inhibition of mIBG uptake by irinotecan and crizotinib was performed in three independent experiments. The IC50 values for each experiment were determined by fitting the data to eq. 3. The mean values (means ± S.D.) of the IC50 from the three independent experiments are shown in the table.
Discussion
The use of radiolabeled mIBG has been routinely incorporated into the diagnosis of neuroblastoma and other neuroendocrine tumors. With the recent FDA approval of high-dose [131I]mIBG for the treatment of advanced pheochromocytoma and its ongoing clinical trials to treat high-risk neuroblastoma, there is a great need to understand the molecular mechanisms involved in mIBG disposition in normal organs and tissues. Previously, mIBG was reported to be a substrate for OCT1–3 and MATE1/2-K (Bayer et al., 2009; Ito et al., 2012). However, the transport kinetics of mIBG has not been analyzed for any of these transporters. It is also unknown whether renal excretion, the major pathway of mIBG elimination, involves OCT2/MATEs. In addition, the potential of mIBG interaction with other anticancer drugs at the site of OCTs and MATEs has not been characterized. In this study, we comprehensively analyzed the transport kinetics of hOCT1–3 and hMATE1/2-K and demonstrated that renal elimination of mIBG involves the hOCT2 and hMATE1/2-K. By screening 23 oncology drugs, we identified several selective inhibitors for mIBG transport mediated by these transporters. Findings from our study have important implications for using mIBG as a theranostic agent for neuroblastoma and other neuroendocrine cancers.
Our detailed kinetic analysis showed that hOCT1–3 and hMATE1/2-K have similar Km values toward mIBG ranging from 14.5 to 19.5 µM (Figs. 4 and 5; Table 1). These Km values are only slightly higher than that of hNET (∼8.7 µM) determined under the same condition (Fig. 4; Table 1), suggesting that the polyspecific organic cation transporters and NET have comparable affinities for mIBG. Previously, using transfected HeLa cells, Glowniak et al. (1993) reported a much lower Km (264 nM) for NET. The discrepancy may be due to differences in expression systems and uptake conditions, as the Glowniak study did not determine the initial rate range and used a much longer incubation time in the kinetic studies. The total plasma concentrations of mIBG estimated from radioactivity in high-dose [131I]mIBG therapy were typically in the nanomolar range (Ehninger et al., 1987). These concentrations are well below our determined Km values for all tested transporters, suggesting that at clinically used doses, mIBG transport mediated by these transporters is unlikely to be saturated. Our kinetic analyses also revealed that hOCT1–3 and hNET have comparable Km values toward mIBG, suggesting that these transporters are somewhat similarly competitive in binding to extracellular mIBG. Nevertheless, as OCTs are not expressed in neuroblastoma (Dubois et al., 2012), selective inhibition of OCTs may provide a valid approach to enhance tumor-specific uptake of [131I]mIBG.
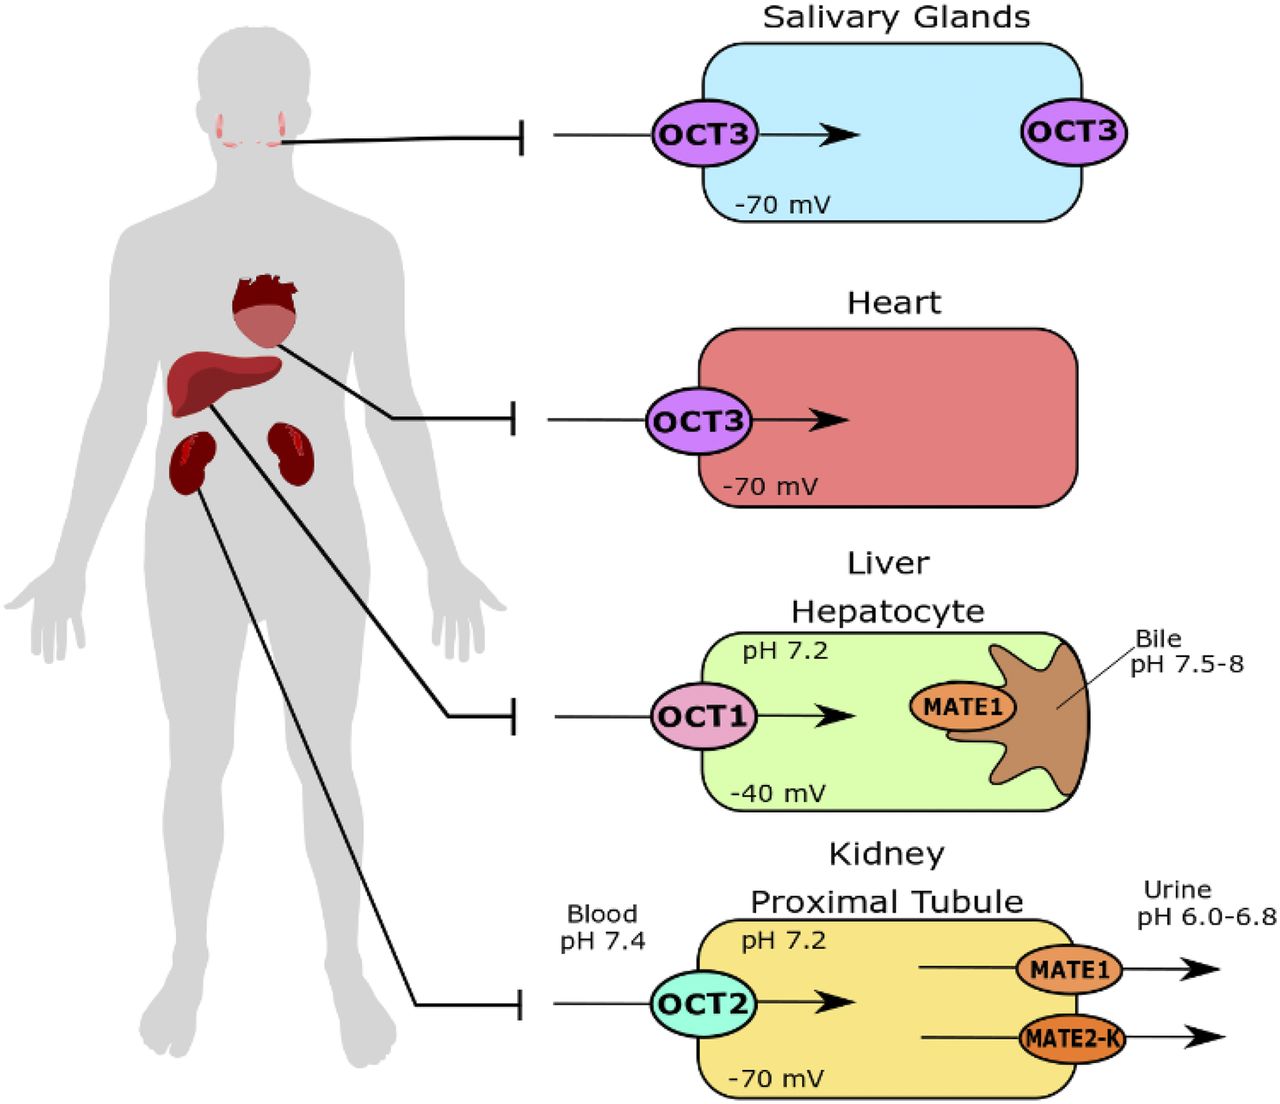
The liver, heart, salivary glands, and intestines are the major physiologic sites of high mIBG accumulation (Coleman et al., 2009; Chin et al., 2014). Consistently, cardiac, hepatic, and salivary gland toxicities have been observed with high-dose [131I]mIBG therapy (Modak et al., 2008; Bleeker et al., 2013; Parisi et al., 2016). Based on in vitro mIBG transport (Figs. 3 and 4; Table 1) and transporter tissue expression, we propose that hOCT1 and hOCT3 are important determinants for mIBG uptake and accumulation in normal tissues, as illustrated in Fig. 10. Although the liver is not a site for mIBG elimination, hepatic accumulation accounts for approximately 30% of the injected dose (Chin et al., 2014; Parisi et al., 2016). A previous study done in Oct1−/− mice observed around a 75% decrease in liver concentrations of mIBG 30 minutes after intravenous injection (Jonker et al., 2001). Using Oct3−/− mice, we previously showed that Oct3 has a major impact on organic cation uptake in salivary glands and heart in vivo (Lee et al., 2014, 2018; Wagner et al., 2018). Accumulation of metformin, a probe substrate of the OCTs, is substantially reduced in salivary glands and heart in Oct3−/− mice (Lee et al., 2014). Previously, Bayer et al. (2016) proposed to improve tumor selective uptake of mIBG by reducing Oct3-mediated tissue uptake. They showed that mIBG uptake was decreased in small intestine and kidney in mice treated with corticosteroids. However, the corticosteroids are not specific, and salivary gland accumulation of mIBG was not analyzed in their study. Characterization of mIBG disposition in Oct3−/− mice should provide more insightful information regarding the in vivo impact of Oct3 on mIBG tissue distribution.

Proposed roles of polyspecific organic cation transporters in mIBG disposition.
mIBG is almost exclusively eliminated by the kidney, with more than 90% of the administered dose excreted unchanged in the urine (Lashford et al., 1988). Although the FDA labels for Azedra and AdreView only state that renal elimination of mIBG occurs by glomerular filtration, several pharmacokinetic studies suggested a net tubular secretion component (Ehninger et al., 1987; Blake et al., 1989). For example, the renal clearance of mIBG was reported to be 226 ml/min in a patient cohort with a mean glomerular filtration rate of 94 ml/min (Blake et al., 1989). Considering the fraction unbound (fu) provided in the Azedra FDA label (fu = 0.39), the estimated glomerular filtration clearance (fu*glomerular filtration rate) is about 37 ml/min, suggesting that about 84% of the dose is eliminated through tubular secretion. Our data strongly support that mIBG undergoes active renal secretion sequentially mediated by hOCT2 and hMATE1/2-K (Figs. 2, 6, 7, and 10). Interestingly, despite a large increase in mIBG B-to-A permeability, intracellular mIBG accumulation in the hOCT2/hMATE1 cells was minimal (Fig. 6C). These observations coincide with [123I]mIBG whole-body imaging results, which revealed rapid and substantial bladder accumulation of [123I]mIBG but only moderate kidney accumulation in both patients with neuroblastoma and healthy adults (Lashford et al., 1988; Chin et al., 2014). These data suggest that hOCT2-mediated uptake, but not hMATE-mediated efflux, is likely the rate-limiting step in the secretion process. Our findings have important implications for mIBG therapy, as changes in hOCT2 and/or hMATE activities could alter the pharmacokinetics and toxicity of radioactive mIBG. For instance, inhibition of the basolateral hOCT2 may reduce mIBG renal clearance, resulting in increased systemic exposure. On the other hand, blockage of hMATE-mediated efflux may increase intracellular accumulation of radioactive mIBG in proximal tubular cells, leading to increased risk of nephrotoxicity.
Transporters are increasingly recognized as targets for clinically relevant DDIs, and assessment of transporter-mediated DDIs is recommended by the 2020 FDA drug interaction guidance for drug development. This raises a concern of potential [131I]mIBG interaction with drugs used either in conventional chemotherapy for neuroblastoma, in combination as radiosensitizers, or in induction chemotherapy. We thus explored the potential of 23 oncology drugs to inhibit mIBG uptake mediated by hOCT1–3 and hMATE1/2-K (Fig. 8). As OCTs and MATEs are known to exhibit substrate-dependent inhibition (Belzer et al., 2013; Martínez-Guerrero and Wright, 2013; Yin et al., 2016), the inhibition screen was carried out using mIBG as the substrate. The majority of the tested drugs showed moderate to no inhibition at a concentration (i.e., 20 µM) much greater than their therapeutic unbound concentrations (Fig. 8). However, irinotecan potently and selectively inhibited hOCT1 (Fig. 8; (Fig. 9A; Table 2). Irinotecan is currently being explored as a radiosensitizer in combination with [131I]mIBG. Considering a typical range of unbound maximum plasma concentrations of 1.2–6.0 µM in patients with cancer (Chabot, 1997), there is a potential for irinotecan to inhibit hOCT1-mediated hepatic uptake of [131I]mIBG (Fig. 10). This may reduce liver accumulation of [131I]mIBG, leading to a potentially beneficial effect in reducing hepatic toxicity.
Several TKIs are in clinical trials as treatments for neuroblastoma and other neuroendocrine tumors (Umapathy et al., 2019). The anaplastic lymphoma kinase (ALK) is found in the majority of neuroblastoma tumors (Trigg and Turner, 2018), and ALK mutation is associated with poor prognosis (Janoueix-Lerosey et al., 2008; Bresler et al., 2014). Crizotinib, an inhibitor of ALK, has shown improvements in the response rates for high-risk neuroblastoma in ALK-positive tumors (Mossé et al., 2013). Crizotinib exhibits potent and preferential inhibition of hOCT3, with a calculated IC50 of 2.14 µM (Fig. 9B; Table 2). The total and unbound maximum plasma concentrations of crizotinib in pediatric patients with cancer are 1.6 and 0.14 µM, respectively (Balis et al., 2017). Although the unbound plasma concentrations of crizotinib may not be sufficient to inhibit hOCT3, TKIs can accumulate in cells and may also exhibit novel protein kinase–dependent inhibition of the OCTs (Sprowl et al., 2016). Thus, further evaluation is necessary to evaluate the potential of crizotinib in inhibiting OCT3-mediated mIBG uptake in vivo in patients with neuroblastoma.
In summary, our study demonstrated that mIBG is efficiently transported by hOCT1–3 and hMATE1/2-K with similar affinities. Our data suggest that hOCT1 and hOCT3 are important determinants for mIBG distribution into normal tissues, whereas hOCT2 and hMATE1/2-K are involved in its renal elimination. mIBG uptake by these transporters can be differentially inhibited by several FDA-approved drugs used in the treatment of neuroblastoma. These findings may help to predict and prevent adverse drug interaction with therapeutic [131I]mIBG and develop clinical strategies to reduce [131I]mIBG accumulation and toxicity in normal tissues and organs. Findings from our study have important implications for using mIBG as a theranostic agent for neuroblastoma and other neuroendocrine cancers.
Acknowledgments
The authors would like to thank the Drug Synthesis and Chemistry Branch, Developmental Therapeutics Program, Division of Cancer Treatment and Diagnosis, National Cancer Institute, for providing the FDA-approved oncology drugs to conduct the inhibition studies. The authors would also like to thank Dale Whittington and Scott Edgar for their help and insights in mass spectrometry.
Authorship Contributions
Participated in research design: López Quiñones, Wang.
Conducted experiments: López Quiñones.
Contributed new reagents or analytic tools: López Quiñones, Wagner.
Performed data analysis: López Quiñones, Wang.
Wrote or contributed to the writing of the manuscript: López Quiñones, Wang.
Footnotes
- Received January 28, 2020.
- Accepted May 27, 2020.
↵1 Current affiliation: DMPK, Oncology, IMED Biotech Unit, AstraZeneca, Boston, Massachusetts.
This work was supported by the National Institutes of Health National Institute of General Medical Sciences [Grants R01-GM066233, T32-GM007750] and National Center for Advancing Translational Sciences [Grant TL1-TR002318].
Abbreviations
- A
- apical
- ALK
- anaplastic lymphoma kinase
- B
- basal
- DDI
- drug-drug interaction
- FDA
- Food and Drug Administration
- fu
- fraction unbound
- HBSS
- Hank’s balanced salt solution
- HEK
- human embryonic kidney
- hMATE
- human MATE
- hNET
- human NET
- hOAT
- human OAT
- hOCT
- human OCT
- LC-MS/MS
- liquid chromatography–tandem mass spectrometry
- MATE
- multidrug and toxin extrusion protein
- MDCK
- Madin-Darby canine kidney
- mIBG
- meta-iodobenzylguanidine
- NCI
- National Cancer Institute
- NET
- norepinephrine transporter
- OAT
- organic anion transporter
- OCT
- organic cation transporter
- Papp
- apparent permeability
- SLC
- solute carrier
- TKI
- tyrosine kinase inhibitor
- Copyright © 2020 by The American Society for Pharmacology and Experimental Therapeutics


