


Article Figures & Data
Figures
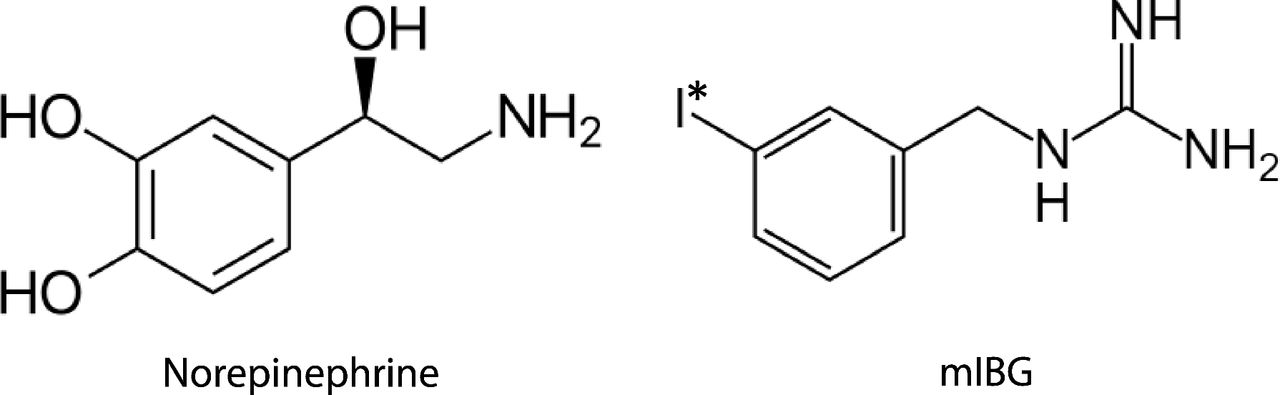
- Fig. 1.
Structure of norepinephrine and meta-iodobenzylguanidine (mIBG). I* represents the isotope of iodine commonly used for diagnosis (123I) or targeted radiotherapy (131I).
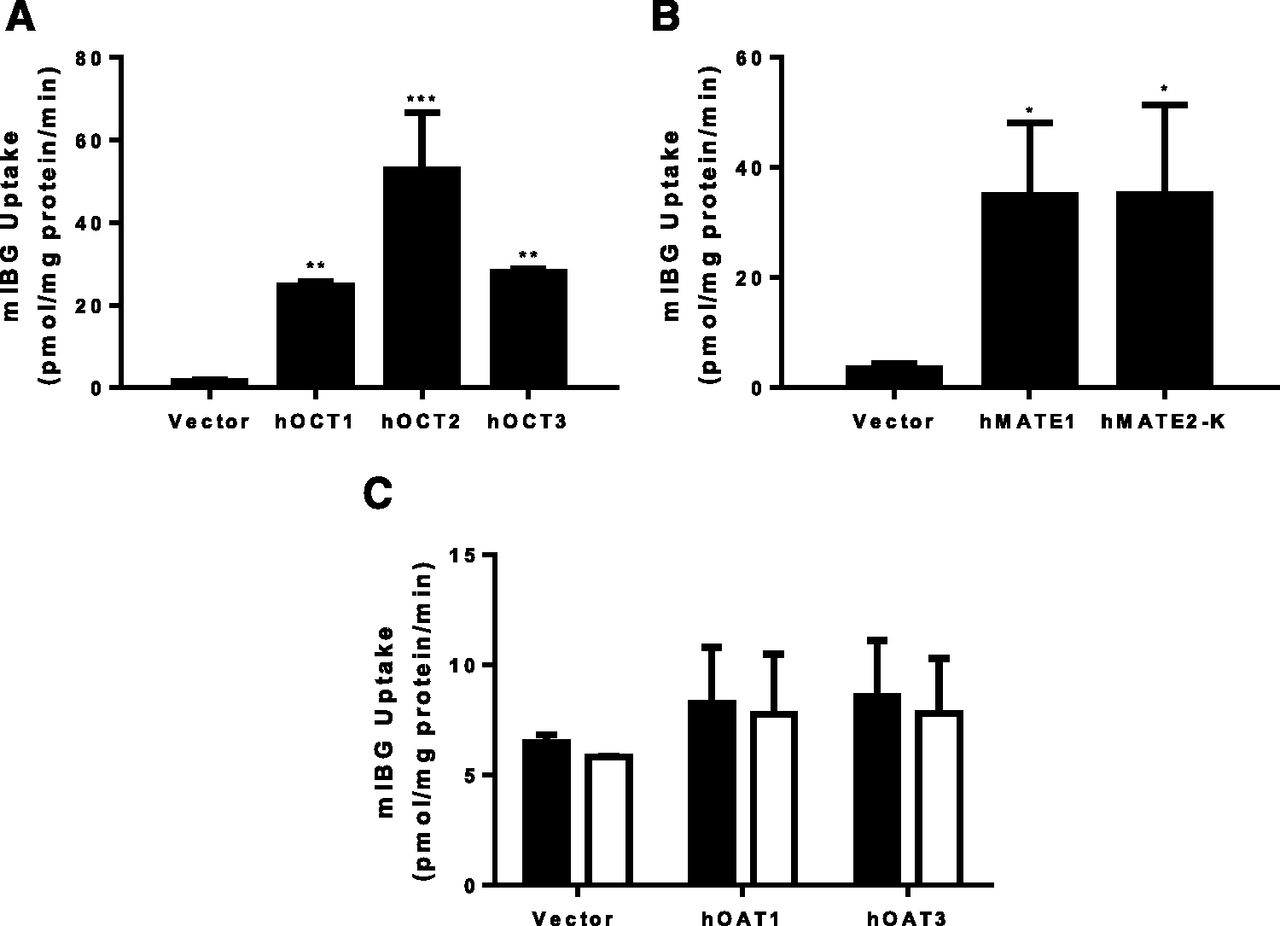
- Fig. 2.
Uptake of mIBG by selected drug transporters. Uptake of 1 µM mIBG by hOCT1–3 (A), hMATE1/2-K (B), and hOAT1/3 (C) was measured in both transporter-expressing and control HEK293 cells. For hOAT1/3, the uptake of mIBG was measured in the absence (filled bars) and in the presence of 100 µM probenecid (empty bars). The uptake was measured after a 30-minute incubation at 37°C. Data are presented as the means ± S.D. from three independent experiments. The uptake of mIBG in transporter-expressing HEK293 cells was compared with control HEK293 cells (*P < 0.05; **P < 0.01; ***P < 0.001). Statistical significance was determined by using a one-way ANOVA followed by Dunnett’s test.
- Fig. 3.
Time-dependent uptake of mIBG by hNET and hOCT1–3. Uptake of 1 µM mIBG was measured in control and hNET- (A), hOCT1- (B), hOCT2- (C), and hOCT3- (D) expressing HEK293 cells at specified time points at 37°C. Time courses were performed independently for three times, and results from one representative experiment were shown. Data points represent the means ± S.D. in triplicate.
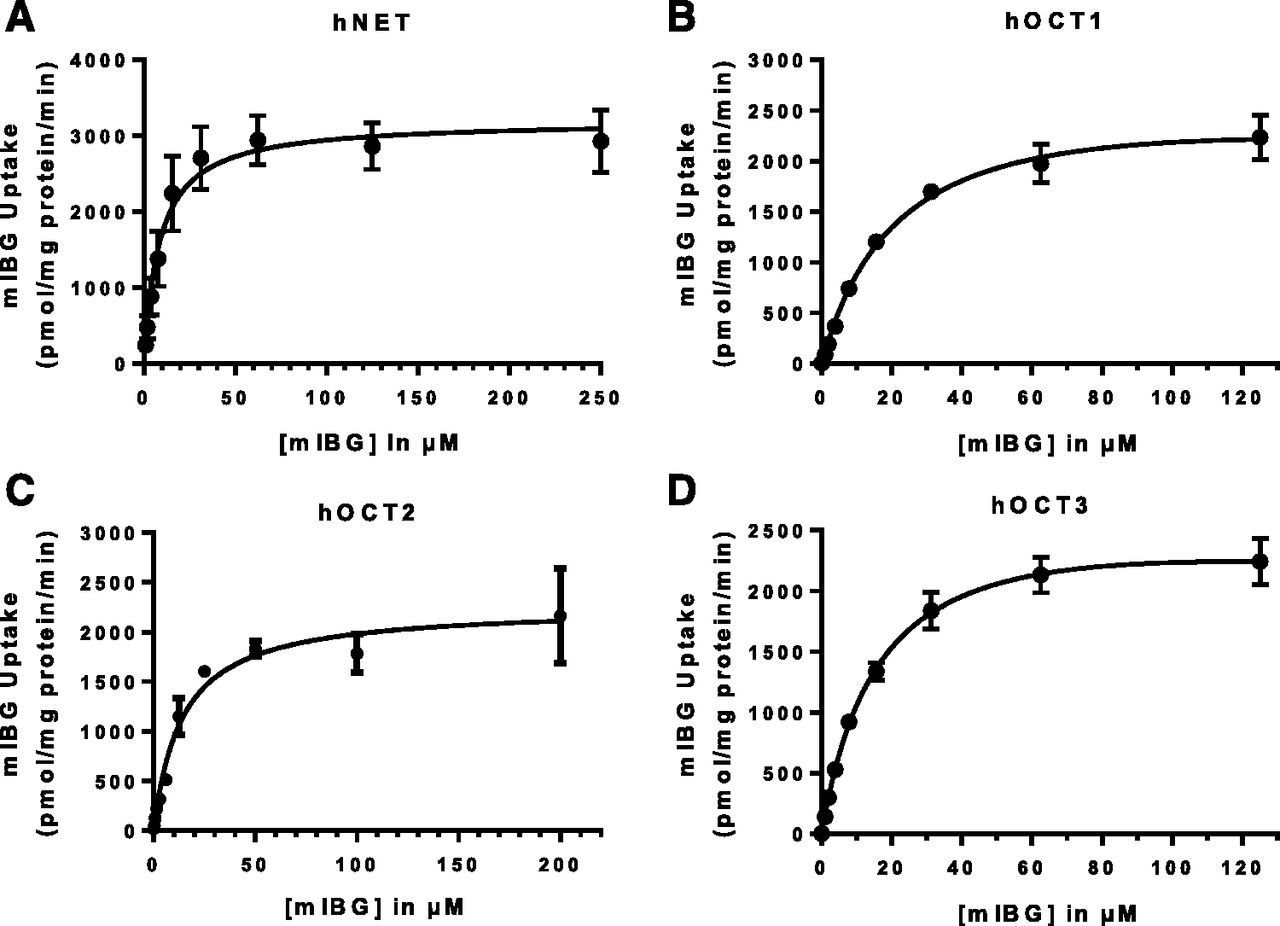
- Fig. 4.
Concentration-dependent uptake of mIBG by hNET and hOCT1–3. Concentration-dependent uptake of mIBG was measured in control and hNET- (A), hOCT1- (B), hOCT2- (C), hOCT3- (D) expressing HEK293 cells after a 2-minute incubation. Transporter-specific uptake was obtained by subtracting the activity in control cells from the activity in transporter-expressing cells. The data were fitted by nonlinear regression to eq. 1. Concentration-dependent uptake was performed independently for three times for each transporter, and results from one representative experiment were shown. Data points represent the means ± S.D. in triplicate.
- Fig. 5.
mIBG uptake kinetics by hMATE1/2-K. The time-dependent uptake of 1 µM mIBG was measured in control and hMATE1- (A) and hMATE2-K- (B) expressing HEK293 cells at specified time points at 37°C in HBSS buffer with pH adjusted to 8.0. Concentration-dependent uptake of mIBG was measured in control and hMATE1- (C) and hMATE2-K- (D) expressing HEK293 cells after a 2-minute incubation. Transporter-specific uptake was obtained by subtracting the activity in control cells from the activity in transporter-expressing cells. The data were fitted by nonlinear regression to eq. 1. Uptake was performed independently for three times, and results from one representative experiment were shown. Data points represent the means ± S.D. in triplicate.
- Fig. 6.
Transcellular flux, permeability, and intracellular accumulation of mIBG in vector-transfected (control) and hOCT2/hMATE1 double-transfected MDCK cells. (A) mIBG transport in control and hOCT2/hMATE1 MDCK monolayers. The MDCK cells were grown for 5 days to form a monolayer on the Falcon insert. On the 5th day, the cells were washed and incubated in HBSS buffer containing 1 µM mIBG in either the apical or basal chamber to initiate transport. An aliquot of buffer (50 µl) was taken periodically from the receiving chamber and replenished with an equal volume of HBSS buffer. mIBG in the aliquot was subsequently measured by LC-MS/MS. The pH of apical and basal chamber was 6.0 and 7.4, respectively. A-to-B, apical to basal; B-to-A, basal to apical. (B) Permeability of mIBG was calculated by using eq. 2. (C) Intracellular accumulation of mIBG was measured at the end of the 120-minute incubation. Transport, permeability, and accumulation in the B-to-A direction were compared with those in the A-to-B direction (*P < 0.05; **P < 0.01). Permeability and accumulation in hOCT2/hMATE1 MDCK cells were also compared with those in the control cells (##P < 0.01). Statistical significance was determined by using an unpaired Student’s t test with the Bonferroni method to correct for multiple comparisons. Each data point represents the means ± S.D. from three independent experiments.
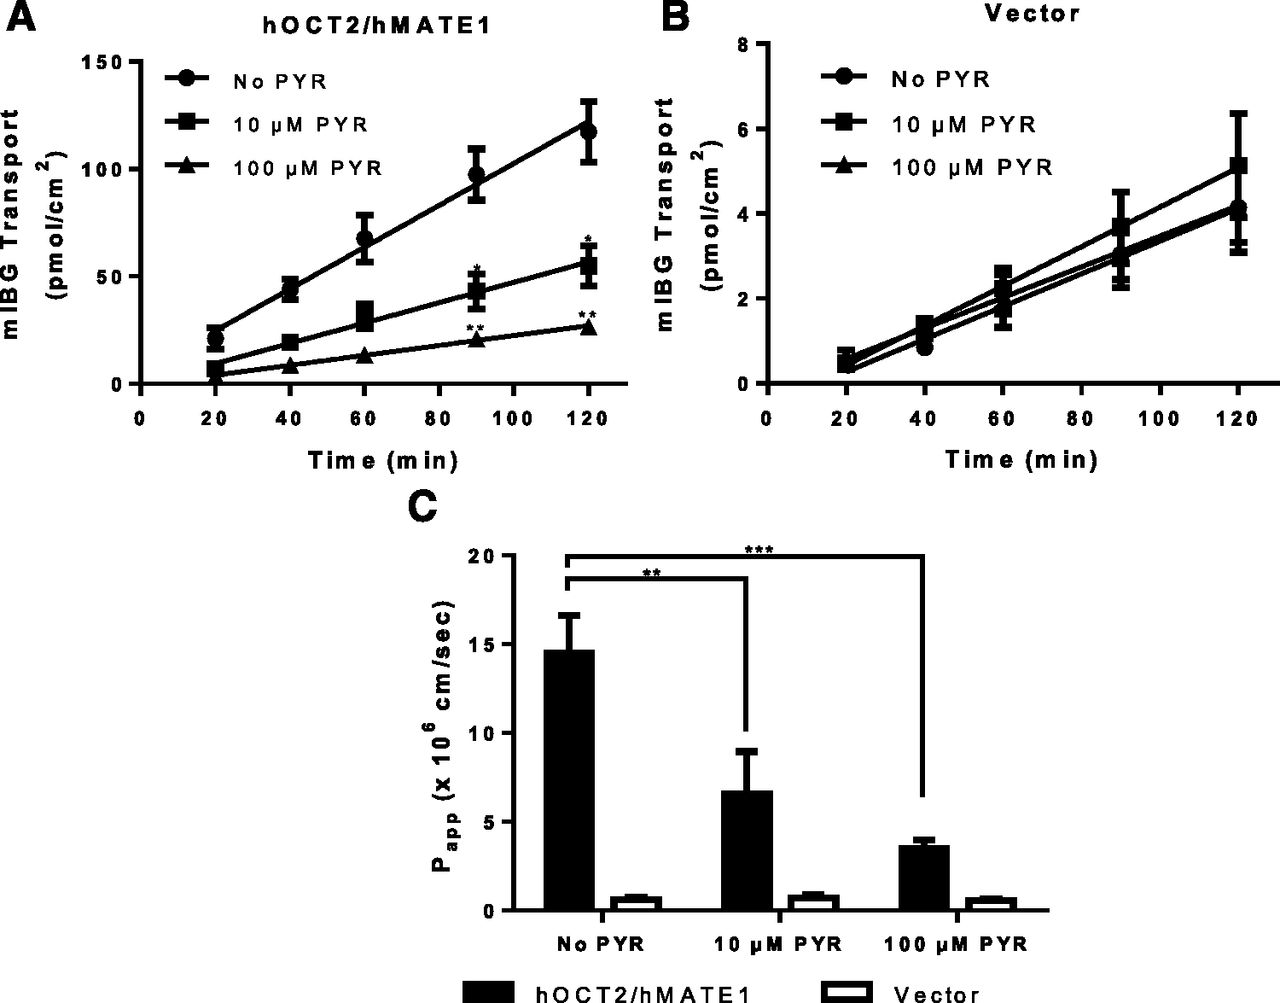
- Fig. 7.
Effect of pyrimethamine on B-to-A flux of mIBG in hOCT2/hMATE1 double-transfected and control MDCK cells. mIBG transport in hOCT2/hMATE1 (A) and vector control (B) MDCK monolayers. Cells were incubated in HBSS buffer containing 1 µM mIBG in the basal chamber. B-to-A flux of mIBG was measured in the absence or presence of 10 or 100 µM pyrimethamine (PYR) added to both chamber A and B. At various time points, 50 µl from chamber A was taken and replenished with an equal volume of HBSS buffer with the corresponding concentration of pyrimethamine. The pH of chamber A and B was maintained at 6.0 and 7.4, respectively. (C) Permeability of mIBG was calculated by using eq. 2. The time course data were fitted with linear regression. B-to-A transport and permeability of mIBG in the presence of 10 or 100 µM pyrimethamine in hOCT2/hMATE1 MDCK cells were compared with those in the absence of pyrimethamine (*P < 0.05; **P < 0.01; ***P < 0.001). The statistical significance was determined by using an unpaired Student’s t test with the Bonferroni method to correct for multiple comparisons. Each data point represents the means ± S.D. from three independent experiments.
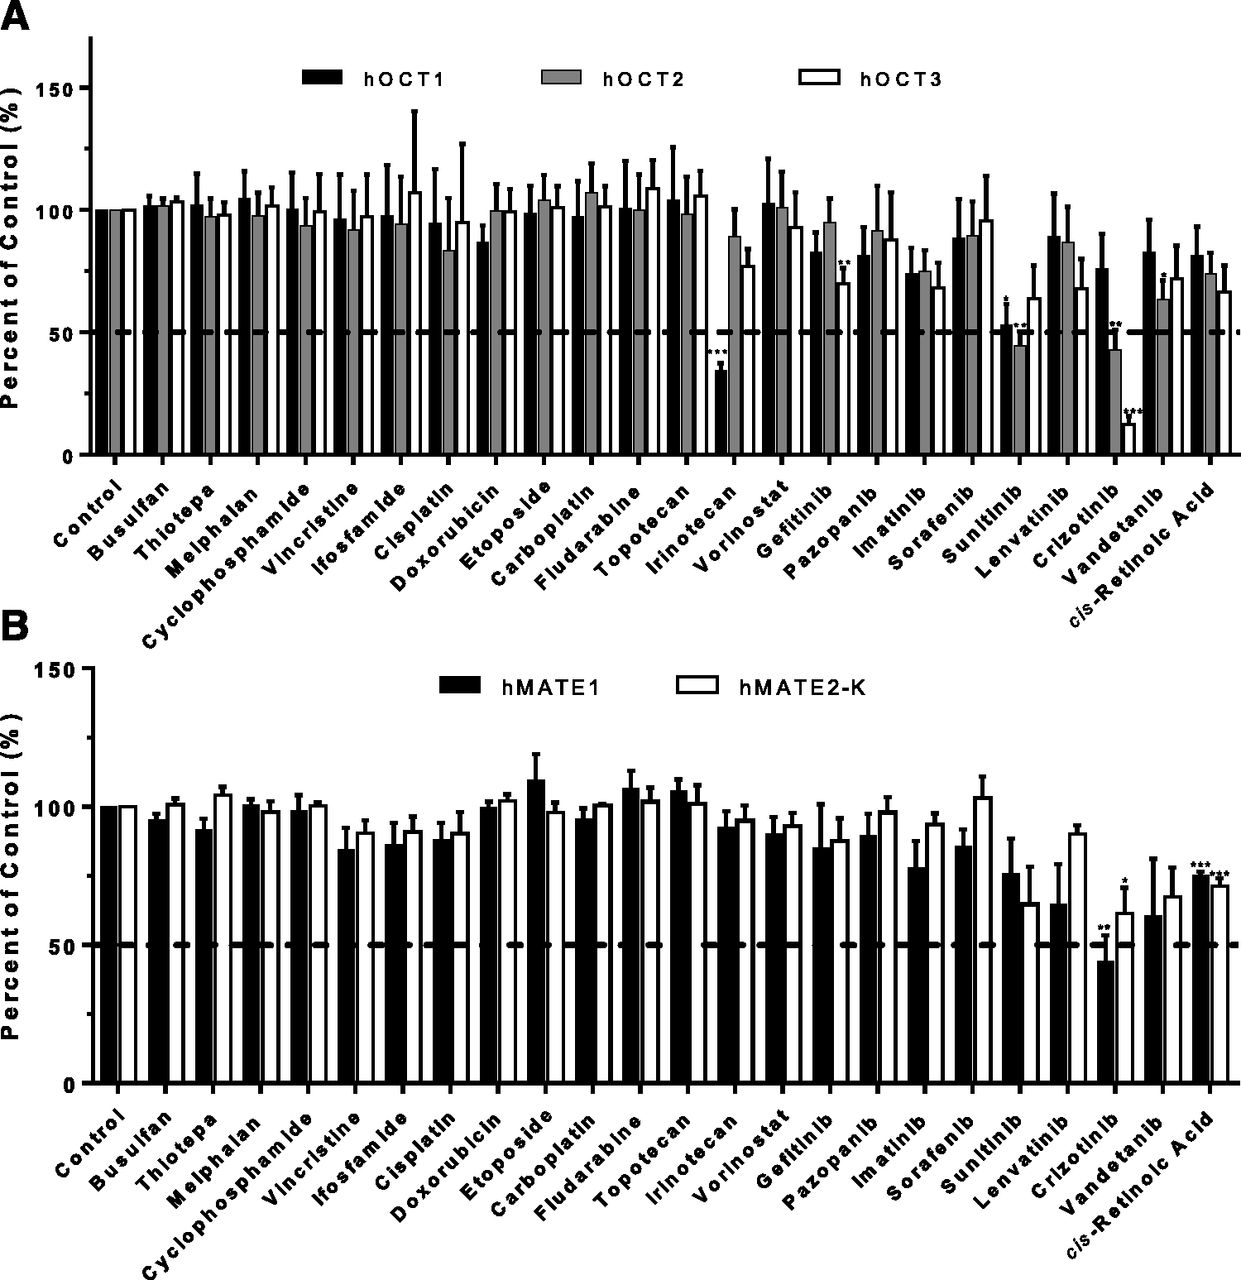
- Fig. 8.
Effect of selected oncology drugs on mIBG uptake mediated by hOCT1–3 (A) and hMATE1/2-K (B). The selected FDA-approved oncology drugs were obtained from the National Cancer Institute. The 2-minute uptake of 1 µM mIBG was measured in the absence and presence of 20 µM of the selected oncology drugs in vector, hOCT1–3-, and hMATE1/2-K-transfected HEK293 cells. Transporter-specific uptake of mIBG was obtained by subtracting the activity in vector-transfected cells from the activity in transporter-expressing cells. The uptake data were expressed as a percentage of mIBG uptake in in the absence of an inhibitor (control). The uptake of mIBG in the presence of an oncology drug was compared with the control (*P < 0.05; **P < 0.01; ***P < 0.001). Statistical significance was determined by using an unpaired Student’s t test with the Bonferroni method to correct for multiple comparisons. Each bar indicates the means ± S.E. from three independent experiments. The horizontal dashed lines indicate 50% inhibition.
- Fig. 9.
Dose-dependent inhibition of hOCT1–3 by irinotecan and crizotinib. Uptake of 1 µM mIBG in the absence and presence of irinotecan (A) and crizotinib (B) was measured in vector, hOCT1-, hOCT2-, and hOCT3-expressing HEK293 cells for 2 minutes at 37°C. Transporter-specific uptake of mIBG was obtained by subtracting the activity in vector-transfected cells from the activity in transporter-expressing cells. The uptake data were expressed as a percentage of mIBG uptake in the absence of irinotecan or crizotinib (control). Each data point represents the means ± S.E. from three independent experiments.
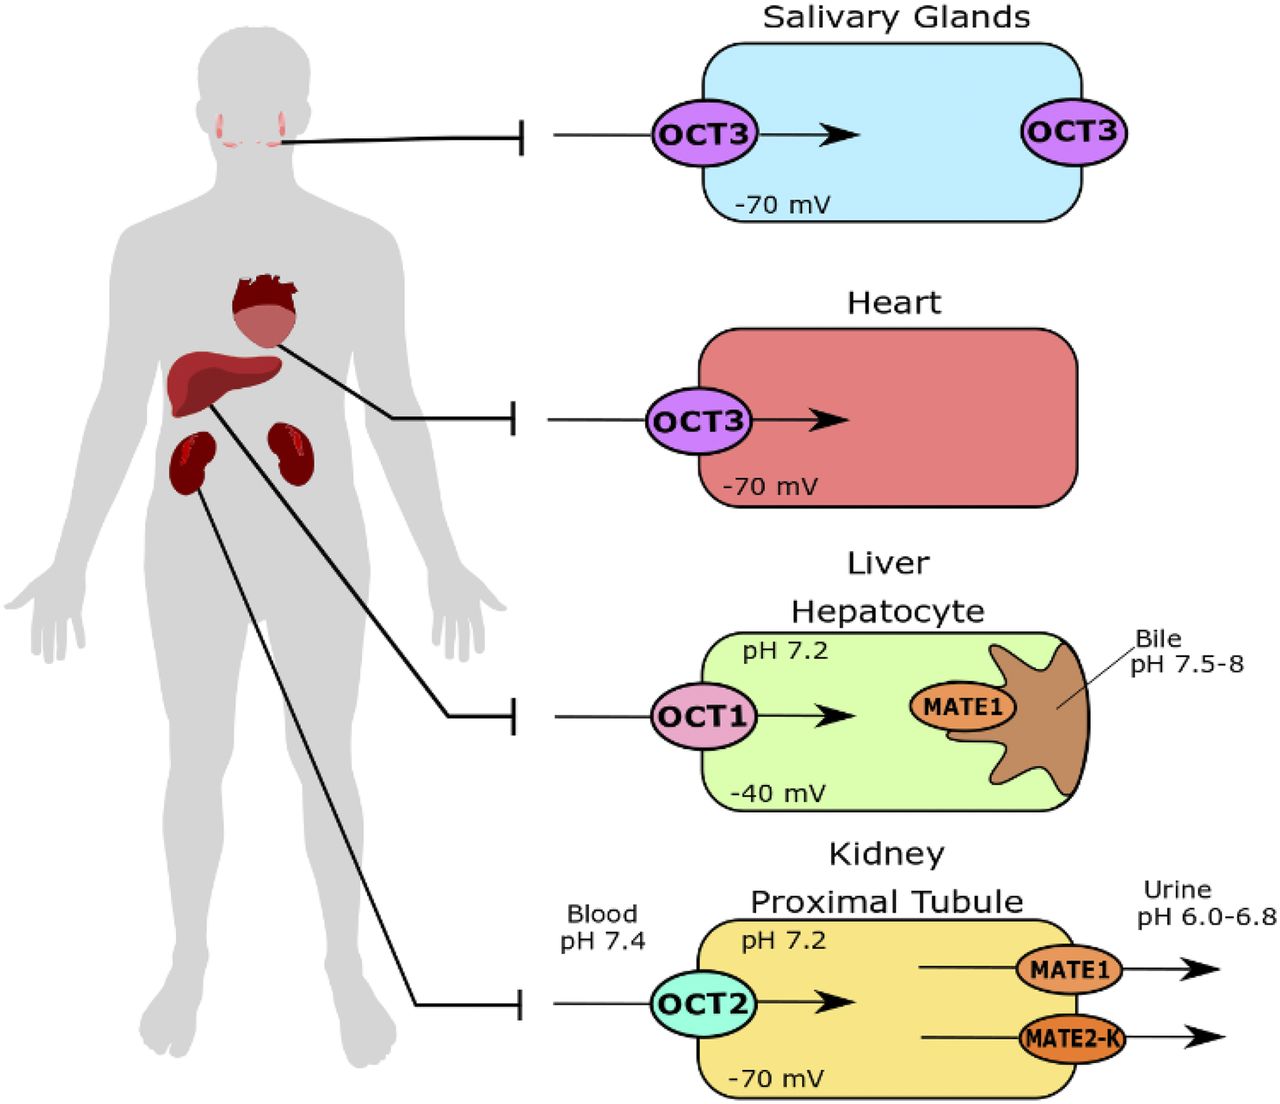
- Fig. 10.
Proposed roles of polyspecific organic cation transporters in mIBG disposition.


Tables
- TABLE 1
Kinetic parameters of mIBG uptake by hNET, hOCT1–3, and hMATE1/2-K
Concentration-dependent uptake was performed in three independent experiments. The Km and Vmax values for each experiment were obtained by fitting the data to eq. 1 by nonlinear regression. The mean values (means ± S.D.) of the Km or Vmax from the three independent experiments are shown in the table.
Km (µM) Vmax (nmol/mg protein per minute) hNET 8.7 ± 1.4 6.40 ± 0.25 hOCT1 19.5 ± 6.9 2.46 ± 0.29 hOCT2 17.2 ± 2.8 2.45 ± 0.10 hOCT3 14.5 ± 7.1 3.14 ± 0.48 hMATE1 17.7 ± 10.9 2.60 ± 0.45 hMATE2-K 12.6 ± 5.6 4.28 ± 0.50 - TABLE 2
The IC50 values of irinotecan and crizotinib for hOCT1–3-mediated mIBG uptake
Inhibition of mIBG uptake by irinotecan and crizotinib was performed in three independent experiments. The IC50 values for each experiment were determined by fitting the data to eq. 3. The mean values (means ± S.D.) of the IC50 from the three independent experiments are shown in the table.
IC50 (µM) Irinotecan Crizotinib hOCT1 5.10 ± 2.70 40.3 ± 5.5 hOCT2 >400 14.3 ± 1.7 hOCT3 88.7 ± 14.6 2.14 ± 0.25


