


Abstract
CYP2A enzymes metabolically inactivate nicotine and activate tobacco-derived procarcinogens [e.g., 4-[methylnitrosamino]-1-(3-pyridyl)-1-butanone]. Smoking decreases nicotine clearance, and chronic nicotine reduces hepatic CYP2A activity. However, little is known about the impact of smoking or nicotine on the expression of CYP2A in the lung. We investigated 1) the levels of human lung CYP2A mRNA in smokers versus nonsmokers and 2) the impact of daily nicotine treatment on lung CYP2A protein levels in African green monkeys (AGMs). Lung CYP2A13, CYP2A6, and CYP2A7 (and CYP1A2) mRNA levels in smokers and nonsmokers were assessed in Gene Expression Omnibus data sets (GSE30063, GSE108134, and GSE11784). The impact of chronic, twice-daily, subcutaneous nicotine at two doses (0.3 and 0.5 mg/kg) versus vehicle on lung CYP2A protein levels was assessed. The impact of ethanol self-administration was also investigated, with and without nicotine treatment. Smokers versus nonsmokers (from GSE30063 and GSE108134) had lower (1.04- to 1.12-fold) levels of lung CYP2A13, CYP2A6, and CYP2A7 (and higher CYP1A2) mRNA. Both doses of nicotine tested decreased AGM lung CYP2A protein (3- to 7-fold). Ethanol self-administration had no effect on AGM lung CYP2A protein, and there was no interaction between ethanol and nicotine. Our results suggest that smoking was associated with a reduction in human lung CYP2A13, CYP2A6, and CYP2A7 mRNA, consistent with the role of nicotine treatment in reducing AGM lung CYP2A protein. This regulation by smoking/nicotine will increase interindividual variation in lung CYP2A levels, which may impact the localized metabolism of inhaled drugs and tobacco smoke procarcinogens.
SIGNIFICANCE STATEMENT CYP2A13 and CYP2A6 are expressed in the lung and may contribute to local procarcinogen activation. Smokers had lower lung CYP2A mRNA levels compared with nonsmokers. Lung CYP2A protein expression was decreased by systemic treatment with nicotine. Decreased lung CYP2A expression may alter smoking-related lung cancer risk and tissue damage from other inhaled toxins. This novel regulatory impact of nicotine, including nicotine found in smoking-cessation nicotine-replacement therapies, may have potential benefits on smoking-related lung cancer risk.
Introduction
The lung is the primary organ exposed to the potentially detrimental effects of inhaled drugs and airborne toxins. These effects include disruption of tissue function through DNA damage by toxic metabolites, which are mediated, at least in part, by cytochrome P450 enzymes (P450s) expressed in the lung (Godschalk et al., 2002). Regulation of P450 in the lungs may be important in altering local P450–mediated metabolism. Although regulation of P450 expression is well documented for some extrahepatic tissues (Pavek and Dvorak, 2008), little is known about the regulation of P450 in the lungs.
Cigarette smoking is a known risk factor for lung cancer (Office of the Surgeon General US, 2004). CYP2A13 and CYP2A6 are human CYP2A isoforms expressed in adult human liver and lung that can metabolically activate procarcinogens found in cigarette smoke, such as the major tobacco-specific nitrosamines 4-[methyl(nitroso)amino]-1-(3-pyridyl)-1-butanone (NNK) and 3-(1-nitrosopyrrolidin-2-yl)-pyridine (Su et al., 2000; Zhang et al., 2007; Rossini et al., 2008). Genetic variation in both CYP2A13 and CYP2A6 is associated with altered risk for smoking-derived lung cancer (Zhang et al., 2007; Rossini et al., 2008; Wassenaar et al., 2011; McKay et al., 2017). For example, smokers with CYP2A13 or CYP2A6 genetic variants (e.g., reduced metabolizers) have a lower incidence of lung cancer compared with those without these variants (e.g., normal metabolizers) (D’Agostino et al., 2008; Wassenaar et al., 2015).
CYP2A enzymes are also the primary enzymes responsible for nicotine metabolism in several species, including humans (Messina et al., 1997), mice (Murphy et al., 2005), and African green monkeys (AGMs) (Schoedel et al., 2003). Cigarette smokers have lower nicotine clearance than nonsmokers, which is thought to be due to downregulation of hepatic CYP2A6 (Zevin and Benowitz, 1999). In mice pretreated with nicotine for 3 days, nicotine metabolism was reduced (Stålhandske and Slanina, 1970). Similarly, nicotine treatment can downregulate its own metabolism in AGMs. This effect was, at least in part, through reduced hepatic CYP2A mRNA, protein, and resulting enzyme activity (Schoedel et al., 2003; Ferguson et al., 2012). As nicotine can decrease hepatic CYP2A mRNA, protein, and activity (Schoedel et al., 2003; Ferguson et al., 2012), we hypothesized that smoking, or nicotine exposure, may also reduce lung CYP2A expression. Such xenobiotic-mediated variation in lung CYP2A levels may act in concert with genetic variation in contributing to the risk of smoking-derived damage to lungs.
Human alcoholics have higher rates of CYP2A6 activity (Chenoweth et al., 2014) and hepatic CYP2A6 levels than nonalcoholics (Niemelä et al., 2000). Ethanol self-administration also increased in vitro hepatic CYP2A activity, whereas nicotine treatment decreased hepatic CYP2A (Ferguson et al., 2011, 2012). As ethanol and nicotine are commonly coconsumed, and both drugs regulate hepatic CYP2A, we sought to also identify the impact of each alone and together on lung CYP2A.
We used human Gene Expression Omnibus (GEO) data sets (Tilley et al., 2011; Wang et al., 2012; O’Beirne et al., 2018) to investigate the association of smoking with human lung CYP2A mRNA levels. We used a nonhuman primate model (i.e., AGM) to investigate the effect of chronic nicotine treatment on lung CYP2A protein levels. AGM CYP2A is expected to have high homology and overlapping regulation with human CYP2A13 and CYP2A6. Although AGM CYP2A has not yet been sequenced, CYP2A24 of cynomolgus monkeys (another old-world monkey) has 94% and 93% amino acid identity with human CYP2A13 and CYP2A6, respectively (Shimada et al., 2016).
Materials and Methods
Materials
Human liver microsomes were prepared in a previous study (Al Koudsi et al., 2010). Microsomes were prepared as a pool of 17 livers from the Biocentre in Basel, Switzerland (Al Koudsi et al., 2010). AGM liver microsomes were prepared in a previous study (Ferguson et al., 2011). Microsomes were prepared as a pool of 10 livers from the control group AGM from study 2.
Human CYP2A13 (catalog number: EZ033) and CYP2D6 (catalog number: EZ013) bactosomes were purchased from SEKISUI XenoTech (Lenexa, KS). Human 2A6 enzyme microsomes (catalog number: 456204) were purchased from CORNING Inc. (Corning, NY). Human CYP2B6 (catalog number: 456255), CYP3A4 (catalog number: 455307), and CYP2E1 (catalog number: 456255) enzyme microsomes were purchased from BD Bioscience Company (Woburn, MA). All other reagents were obtained from standard suppliers. Information about the antibodies used can be found in Supplementary Table 1.
Gene Expression Analyses
RNA-sequence data sets were downloaded from the NCBI GEO data base (https://www.ncbi.nlm.nih.gov/geo/). The data sets were selected based on having data on lung tissue and having sufficient numbers of both healthy smokers and healthy nonsmokers. GSE30063 had n = 60 smokers and n = 73 nonsmokers (Wang et al., 2012), and GSE108134 had n = 129 smokers and n = 29 nonsmokers (O’Beirne et al., 2018). A separate GEO data set, GSE11784, was used to assess the association of smoking exposure and CYP2A13, CYP2A6, and CYP2A7 mRNA levels. GSE11784 had n = 94 smokers with individual data on pack-years of cigarette smoking (Tilley et al., 2011). Pack-years of cigarette smoke were used as a rough estimate of lifelong exposure to smoking (Leffondré et al., 2002). All three studies examined small airway epithelium of the lungs (Wang et al., 2012; O’Beirne et al., 2018). RNA was hybridized using the Affymetrix Human Genome U133 Plus 2.0 Array (HG-U133_Plus_2) (Wang et al., 2012; O’Beirne et al., 2018).
Raw preprocessed Affymetrix CEL files were downloaded using the Bioconductor GEOquery v2.54.1 R-package from GEO (Davis and Meltzer, 2007). Within each data set, raw Affymetrix multiarray data from smokers and nonsmokers were compiled together using Bioconductor Affy v2.3.01 with corresponding hgu133plus2.db and hgu133plus2cdf R-packages (Carvalho et al., 2007). Raw readings were processed with the robust multiarray averaging pipeline to correct for probe background, to quantile normalize data, to median polish data, and to calculate mRNA probe intensity (Irizarry et al., 2003). The generated mRNA probe intensities for each individual were exported into a comma-separated values (CSV) file (Davis and Meltzer, 2007). The corresponding gene probe identifiers—208327_at (CYP2A13; NM_000766), 207244_x_at (CYP2A6; NM_000762), 1549_at (CYP2A7; NM_000764), and 207608_x_at (CYP1A2; NM_000761)—were used to extract the relative levels of P450 gene probe intensities in individual smokers and nonsmokers from the CSV file.
Animals
All experimental procedures and animal care were reviewed and approved by the Institutional Review Board of the Behavioral Sciences Foundation and the University of Toronto Animal Care Committee and were conducted in accordance with the guidelines of the Canadian Council of Animal Care. All studies involving animals are reported in accordance with the National Institutes of Health Principles and Guidelines for Reporting Preclinical Research for experiments involving animals and with journal recommendations.
Male adult (6–8 years old, weight range 5–6 kg) AGMs (Chlorocebus aethiops) were housed outdoors in social groups at the Behavioral Sciences Foundation (St. Kitts) (Palmour et al., 1997). AGMs were obtained from a nonendangered, large, and isolated population in the Caribbean. Their diet comprised monkey chow supplemented with fresh fruits and vegetables and drinking water ad libitum.
Animal Treatments
AGM Study 1: Control and Nicotine Treatments.
The study paradigm is outlined in Fig. 1 and has been previously described in detail (Schoedel et al., 2003). During phase I (day 0), AGMs (n = 12) were randomized by weight into two treatment groups: control (n = 6) and nicotine (n = 6). During phase II (days 1–22), AGMs in the nicotine group received nicotine bitartrate (microgram nicotine base in saline, pH 7.4) subcutaneous injections twice daily at 0.05 mg/kg for 2 days, then 0.15 mg/kg for 2 days, and then 0.30 mg/kg for 18 days. During the last 18 days, the total daily dose of nicotine administered (0.6 mg/kg) was similar to the average daily intake of nicotine by smokers (0.53 mg/kg per day) (Benowitz and Jacob, 1984). AGMs in the control group received saline (i.e., vehicle) subcutaneous injections twice daily during this phase.

Treatment paradigm for the AGM study 1.
On day 22, 4 hours after the first subcutaneous injection of the day, the AGMs were sacrificed under ketamine anesthesia. AGMs were given a pentobarbital overdose followed by bilateral thoracotomy. Their organs were immediately dissected, and one half of each organ was flash-frozen and stored at −80°C until further use.
AGM Study 2: Control, Nicotine, Ethanol, and Nicotine + Ethanol Treatments.
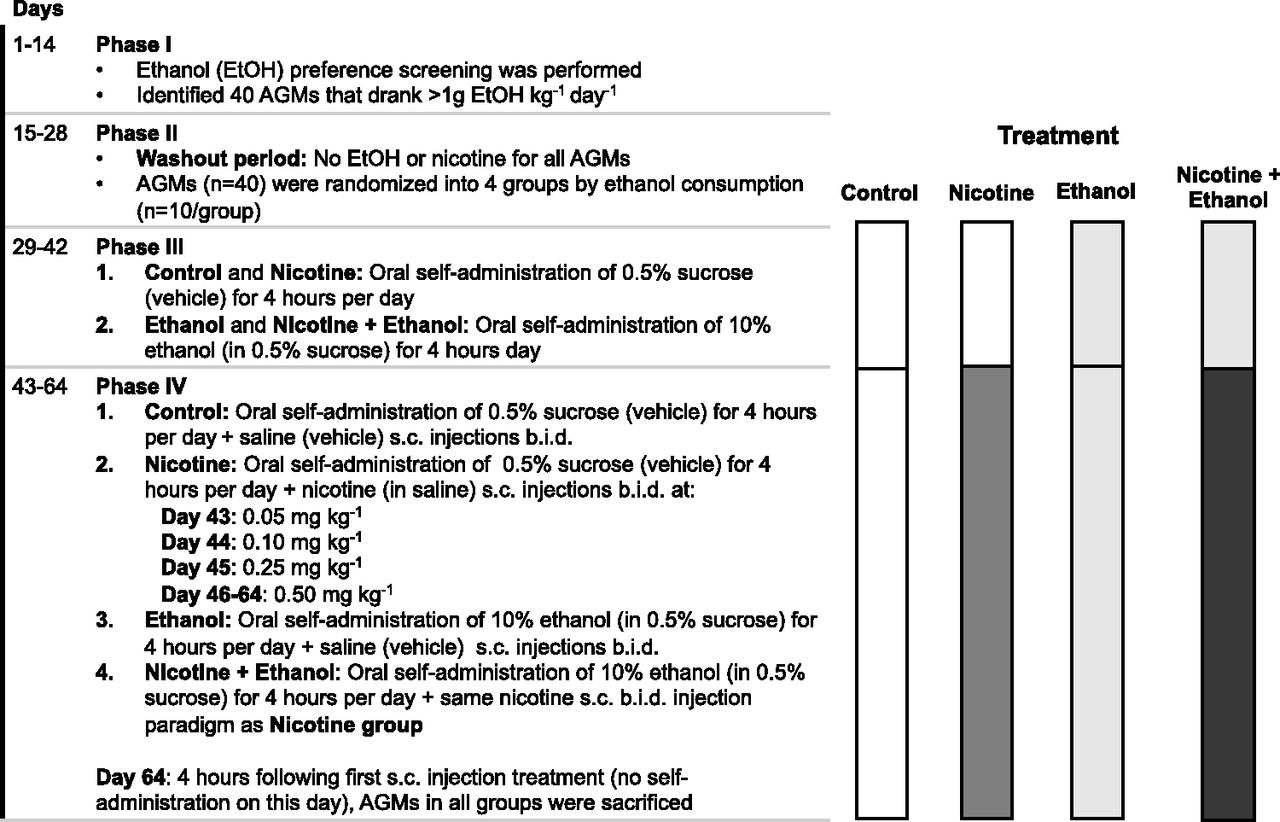
The study paradigm is outlined in Fig. 2 and has been previously described in detail (Ferguson et al., 2011). During phase I (days 1–14), AGMs underwent an ethanol preference screen, with daily access to 10% ethanol in a 0.5% sucrose solution every morning for 4 hours per day. AGMs (n = 40) that consumed more than 1 g of ethanol/kg per day were randomized into four treatment groups based on their ethanol consumption: control (n = 10), nicotine (n = 10), ethanol (n = 10), and nicotine + ethanol (n = 10). During phase II (days 15–28), there was a washout period in which the AGMs had no drug exposure.

Treatment paradigm for the AGM study 2.
During phase III (days 29–42), AGMs in the ethanol and in the nicotine + ethanol groups were allowed to self-administer 10% ethanol in a 0.5% sucrose solution every morning for 4 hours, whereas AGMs in the control and in the nicotine groups were allowed to self-administer 0.5% sucrose solution (i.e., vehicle) during the same 4-hour window.
During phase IV (days 43–64), AGMs continued to have access to 10% ethanol in a 0.5% sucrose solution or 0.5% sucrose solution every morning for 4 hours. In addition, AGMs in the nicotine and nicotine + ethanol groups were given nicotine bitartrate (milligram of nicotine base in saline, pH 7.0) subcutaneous injections twice daily at 0.05 mg/kg for 1 day, then 0.1 mg/kg for 1 day, and then 0.25 mg/kg for 1 day, followed by 0.5 mg/kg for the remaining days. AGMs in the ethanol and control groups received saline (i.e., vehicle) subcutaneous injections twice daily during this phase.
On day 64, 4 hours after the first subcutaneous treatment injection, the AGMs were sacrificed under ketamine anesthesia. AGMs were given a pentobarbital overdose followed by bilateral thoracotomy. Organs were immediately dissected, and one half was frozen and stored at −80°C until further use.
Whole Membrane Preparation
Lower and upper regions of AGM lungs were dissected by visual differentiation. Whole membranes were prepared from individual AGM lungs as previously described (Miksys and Tyndale, 2002). Briefly, lung tissues were homogenized in 0.1 mM EDTA, 0.1 mM dithiothreitol, 100 mM Tris, and 0.32 M sucrose (pH 7.4) and then centrifuged at 3000g for 10 minutes at 4°C. The supernatant was collected, and the pellet was resuspended, vortexed, and centrifuged again at 3000g for 10 minutes. The two supernatants were combined and centrifuged at 110,000g for 60 minutes at 4°C. The resulting pellet was resuspended in storage solution consisting of 0.1 mM EDTA, 0.1 mM dithiothreitol, and 100 mM Tris with 1.15% KCl and 20% glycerol. The protein contents of the lung membranes were measured using a Bradford Protein Assay kit (Bio-Rad, Burlington, ON, Canada). Pooled control group lung membranes for lower and upper lung were created by combining equal amounts of lung membrane protein from each control AGM in study 1 (n = 6) and separately for study 2 (n = 10).
Immunoblotting Analysis
CYP2A and Loading Control Analyses.
Control lung membrane proteins (ranging from 25 to 150 μg) were separated by SDS-PAGE at constant voltages of 60 V through a 4% acrylamide stacking gel and of 100 V through a 10% acrylamide separating gel at room temperature (22°C). All immunoblotting procedures were carried out at room temperature unless specified otherwise. A portion of the gel (i.e., ∼35 to ∼10 kDa) that did not contain our proteins of interest was stained with EZBlue Gel Coomassie Staining (Sigma, Oakville, ON, Canada) to quantify the protein loaded per well. Proteins in the remaining portion of the gel were transferred to nitrocellulose membrane at a constant current of 300 mAmp for 16 hours. Membranes were then rinsed three times for 5 minutes each in Tris-buffered saline (pH 7.4) with 0.1% Triton X-100 (TBST).
To detect CYP2A, membranes were blocked for 1 hour with a blocking solution consisting of 3% skim milk powder, 1% horse serum, and 0.5% bovine serum albumin (BSA) in TBST. Membranes were then incubated for 16 hours at 4°C with a polyclonal rabbit anti-CYP2A6 antibody (Sigma) diluted 1:1000 in 0.5% horse serum and 0.5% BSA in TBST. Membranes were rinsed three times for 5 minutes each in TBST and then incubated with fresh blocking solution for 1 hour and with horseradish peroxidase–conjugated anti-rabbit secondary antibody (EMD Millipore, Etobicoke, ON, Canada) diluted 1:10,000 in 0.5% horse serum and 0.5% BSA in TBST for 1 hour.
CYP2A proteins were visualized using an enhanced chemiluminescence immunoblot kit (ThermoFisher, Oakville, ON Canada). CYP2A proteins and Coomassie Blue–stained proteins were imaged and quantified with a ChemiDoc MP imaging system equipped with ImageLab v6.0.1 build 34 imaging software. Exposure times of 30 and 60 seconds were used, enabling the detection of CYP2A and Coomassie Blue–stained proteins without signal saturation.
After analysis for CYP2A, β-actin was quantified to further assess protein loading. Membranes were washed for 24 hours in TBST and then incubated for 1 hour in fresh blocking solution and for 16 hours at 4°C with a mouse monoclonal anti–β-actin antibody (Sigma) diluted 1:1000 in 0.5% horse serum and 0.5% BSA in TBST. Membranes were then washed three times for 5 minutes each in TBST, reblocked for 1 hour, and then incubated for 1 hour in horseradish peroxidase–conjugated anti-mouse secondary antibody (EMD Millipore) diluted 1:10,000 in 0.5% horse serum and 0.5% BSA in TBST. β-Actin proteins on blots were imaged and quantified using the ChemiDoc MP imaging system described above using an automatic exposure time to minimize band saturation and maximize signal linearity.
Antibody Specificity and Protein Linearity.
Pooled control group lung membranes from the lower and upper lung were serially diluted to generate a standard curve to assess the linear detection range of CYP2A, β-actin, and total proteins (i.e., Coomassie Blue–stained protein). Individual AGM samples were loaded at 75 μg beside the pooled control standard curve at 25, 75, and 150 μg on each immunoblot. The standard curve was used to ensure that each membrane sample was in the linear range and to allow for blot-to-blot adjustments. Each blot had a prestained protein mixture in one lane for molecular weight estimation (PaperRuler Prestained Protein Ladder; ThermoFisher).
The specificity and sensitivity of the polyclonal anti-CYP2A6 antibody were assessed using positive controls, including human liver microsomes, AGM liver microsomes, AGM lung membranes, and membranes from cDNA-expressed human CYP2A6 (Corning) and CYP2A13 (XenoTech). Negative controls included cDNA-expressed human CYP2E1 (BD Bioscience), CYP2D6 (XenoTech), CYP2B6 (BD Bioscience), and CYP3A4 (BD Bioscience).
Data Analysis
The data were analyzed using GraphPad Prism version 7.1a.
GEO Multiarray Statistical Analysis.
Nonparametric unpaired Mann-Whitney U tests were used to test differences in CYP2A13, CYP2A6, and CYP2A7 expression levels between smokers and nonsmokers in the small airway epithelium of the lung in GEO data sets (GSE30063 and GSE108134). As a method of reporting effect size for the Mann-Whiney U test, the degree of overlap (f) in smokers and nonsmokers was calculated using the common language effect size equation:
For GSE11784, the D’Agostino-Pearson omnibus normality test was used to determine the normality of signal distribution of CYP2A13, CYP2A6, and CYP2A7 expression levels in smokers’ small airway epithelium of the lung, followed by correlation analyses to assess the relationship between CYP2A13, CYP2A6, and CYP2A7 expression levels and pack-year data within smokers.
Background Subtraction and Blot-To-Blot Adjustment of Immunoblot Data.
Individual AGM samples were assessed on multiple immunoblots. For all signals (CYP2A, β-actin, and Coomassie Blue stain), software automatic background subtraction was applied to all blots. CYP2A signals were then normalized to β-actin signals or Coomassie Blue–stained total protein to adjust for variation in protein loading (see Supplemental Tables 1 and 2). Further background subtraction was applied after this normalization to loading controls based on the y-intercept from the linear regression analysis of the CYP2A/β-actin or CYP2A/Coomassie control group pooled standard curves present on each immunoblot. To reduce blot-to-blot variation in the analyses, the individual AGM signals were adjusted using the 75 μg of pooled control group lung membrane signal (internal standard). Analyses with (illustrated in the figures) and without this additional blot-to-blot adjustment had no impact on the fold or statistical significance of differences (Supplemental Tables 1 and 2).
Immunoblot Statistical Analysis.
Two-tailed unpaired t tests were used to assess differences in the lung CYP2A protein levels between treatment groups in AGM study 1. Two-way ANOVA tests were used to assess differences in the lung CYP2A protein levels between treatment groups in AGM study 2. Tukey’s multiple comparison post hoc tests were subsequently used to assess differences in lung CYP2A protein levels between treatment groups and treatment interactions in AGM study 2. The D’Agostino-Pearson omnibus normality test was used to determine the normality of signal distribution, followed by correlation analyses to assess the relationships between lower and upper lung CYP2A protein levels within individual AGMs. Data from both AGM studies were found to be normally distributed; thus, Pearson’s correlations were used to assess the relationship between the lower and upper lung.
AGM Liver Comparisons.
The CYP2A levels in AGM livers from the AGM study 2 control group have been previously quantified (Ferguson et al., 2012). Using these data, the total liver and total lung CYP2A were estimated and compared using a paired two-tailed t test.
Results
CYP2A13, CYP2A6, and CYP2A7 mRNA Were Lower in Smokers than in Nonsmokers.
Smokers versus nonsmokers had distinct distributions of CYP2A13 (U = 1347, f = 0.308, P < 0.001), CYP2A6 (U = 1376, f = 0.314, P < 0.001) and CYP2A7 (U = 1415, f = 0.323, P < 0.001) mRNA in the small airway epithelium of the lung of GSE30063, and these were replicated in GSE108134 (CYP2A13: U = 432, f = 0.115, P < 0.001; CYP2A6: U = 462, f = 0.123, P < 0.001; CYP2A7: U = 442, f = 0.118, P < 0.001) (Fig. 3). Smoking is an established inducer of CYP1A2 mRNA and thus was used as a positive control for the assessment within this data set of the association of smoking status and viability of samples (Wei et al., 2002). Smokers versus nonsmokers had higher CYP1A2 mRNA in both data sets (GSE30063: U = 1314, f = 0.300, P < 0.001; GSE108134: U = 242, f = 0.065, P < 0.001).

Distributions of CYP2A13, CYP2A6, and CYP2A7 mRNA levels were distinct between smokers and nonsmokers. (A) Probe intensities for the three mRNAs in the GSE30063 (GEO study 1) had degrees of overlap between smokers and nonsmokers of 30.8%, 31.4%, and 32.3%, respectively. (B) Probe intensities for the three mRNAs in the GSE108134 (GEO study 2) had degrees of overlap of 11.5%, 12.3%, and 11.8%, respectively (unpaired Mann-Whitney U tests and common language effect size f). *P < 0.05; ***P < 0.001.
There was a wide variation in the level of smoke exposure in both GEO data sets (mean ± S.D.: GSE30063 = 26 ± 16 pack-years; GSE108134 = 27 ± 14 pack-years) (Tilley et al., 2011; Wang et al., 2012; O’Beirne et al., 2018). This variation may have contributed to the large variation in CYP2A levels within smokers. For this reason, in GSE11784, we also assessed the association of smoking quantity using pack-year data with levels of CYP2A13, CYP2A6, and CYP2A7 mRNA in the small airway epithelium of the lung. There was a negative, albeit weak, correlation between CYP2A13 (r = −0.178, P = 0.044), CYP2A6 (r = −0.307, P < 0.001), and CYP2A7 (r = −0.198, P = 0.028) mRNAs and pack-years smoked, suggesting a potential dose-dependent association between smoking exposure and CYP2A mRNA levels in smokers’ lungs.
CYP2A Protein Levels Were Detected in AGM Lung by Immunoblotting.
An immunoblotting assay was established using a polyclonal anti-CYP2A6 antibody to measure the levels of CYP2A protein in AGM lung. The polyclonal antibody used was raised against the full-length human CYP2A6. CYP2A6 and CYP2A13 have 93.5% amino acid identity (Hoffman et al., 2001). CYP2A immunoreactive signal was detected in human liver, AGM liver, AGM lung, and cDNA-expressed CYP2A13 and CYP2A6 (Fig. 4A), whereas there was no crossreactivity with other cDNA-expressed human P450 (CYP3A4, CYP2E1, CYP2D6, and CYP2B6) (Fig. 4A). The assays were linear for detection of CYP2A, β–actin, and Coomassie Blue signals over a wide range of AGM lung protein (Fig. 4, B–D).

Immunoblotting assays were selective and linear. (A) Positive controls for CYP2A6 primary antibody included human liver microsomes (HUM LIV) (upper band is CYP2A13 and lower band is CYP2A6), AGM liver microsomes (AGM LIV),AGM lung membranes (AGM LNG),, and cDNA-expressed CYP2A13 and CYP2A6. Negative controls included cDNA-expressed CYP3A4, CYP2E1, CYP2D6, and CYP2B6; there was no crossreactivity of the CYP2A6 primary antibody with these P450 enzymes. Standard curves of pooled AGM control group lung membranes display linear signal detection (y-axis units are arbitrary optical densities) for up to 200 μg protein loaded with (B) CYP2A6 antibody, (C) β-actin antibody, and (D) Coomassie Blue gel staining (linear regression analyses demonstrated values of R2).
Nicotine Treatment Lowered CYP2A Protein Levels in the Lower and Upper Lung in AGM Study 1.
Most AGM lung samples, loaded at 75 μg, were within the linear range of the CYP2A, β–actin, and Coomassie Blue signals from the standard curve of pooled control AGM lung (described in the Materials and Methods) on each immunoblot (Fig. 5, A and B). However, a few samples had CYP2A detection that was below the linear detection level, and they were thus reassessed after loading at 125 μg. A representative blot from AGM study 1 is shown in Fig. 5, A and B; representative AGM lung membranes from each group (n = 3) were loaded at 75 μg.

AGM lung CYP2A protein levels were lower in the nicotine group compared with the control group (AGM study 1). Lung CYP2A immunoblots from (A) the lower lung and (B) the upper lung are shown with β-actin immunoblots and Coomassie Blue gel staining (protein loading controls). The blots contain a standard curve of pooled control AGM lung (25–150 μg) and representative samples loaded at 75 μg (n = 3 of six from each treatment group). CYP2A/β-actin was lower in (C) the lower lungs and (D) the upper lungs of the nicotine group compared with control group (n = 6 per group, two-tailed unpaired t test with Welch’s correction). (E) CYP2A/β-actin levels were correlated between the lower and upper lung within AGM (Pearson’s r correlation analysis). *P < 0.05; **P < 0.01.
The nicotine group versus the control group had lower levels of CYP2A protein in the lower [4.03-fold; 95%; confidence interval (CI) (3.09–4.97); t(10) = 3.47, P = 0.006] and upper [3.74-fold; CI (2.94–4.54); t(10) = 3.96, P = 0.003] lung (Fig. 5, C and D). Blot-to-blot adjusted (as shown in Fig. 5, C and D) and unadjusted data provided virtually identical fold group differences (Supplemental Table 2).
Among the entire data set, CYP2A protein levels in the lower and upper lung were highly correlated (r2 = 0.88, P < 0.001) within individual AGMs (Fig. 5E). The distributions of the CYP2A/β-actin levels between the lower and upper lung of the control group (P = 0.931) or nicotine group (P = 0.999) were indistinguishable.
Nicotine, but Not Ethanol Treatment, Lowered CYP2A Protein Levels in the Lower and Upper Lung in AGM Study 2.
For many samples in the nicotine and nicotine + ethanol groups, the CYP2A detection was below the linear detection level when loaded at 75 μg. Thus, samples from both of these groups were assessed at 100 μg of loaded protein. Most AGM lung samples in the control and ethanol groups (loaded at 75 μg) and nicotine and nicotine + ethanol group (loaded at 100 μg) were within the linear range of the CYP2A, β-actin, and Coomassie Blue signals from the standard curve of pooled control AGM lung (described in Materials and Methods) on each immunoblot. However, a few samples had CYP2A detection that was above or below the linear detection and were thus reassessed after loading at 25 or 125 μg, respectively. A representative blot from AGM study 2 is shown in Fig. 6, A and B; representative AGM lung membranes from each group (n = 3) were loaded at 75 μg.
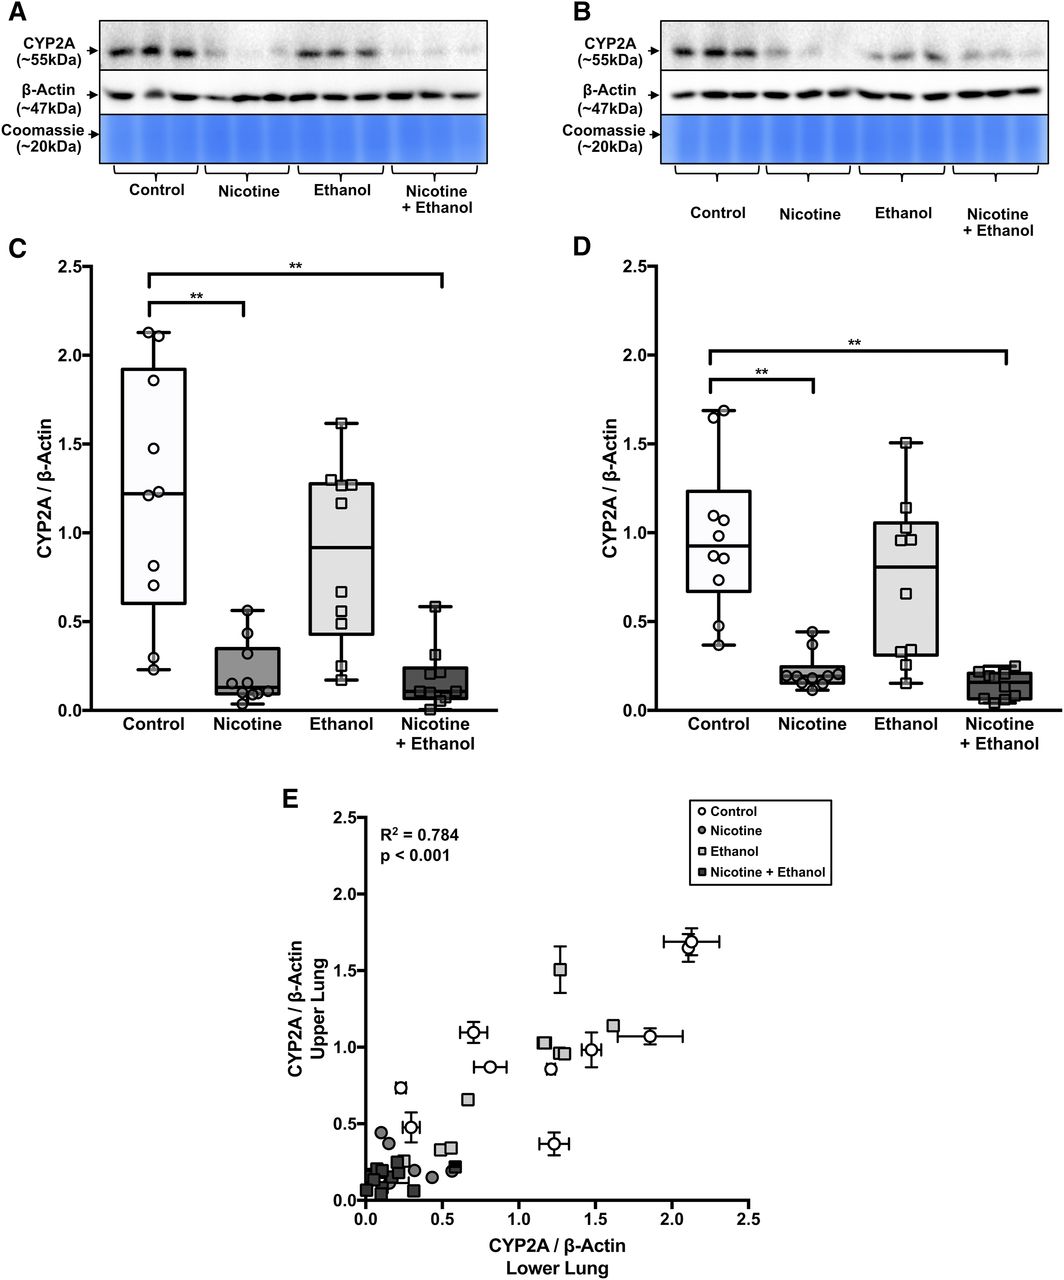
AGM lung CYP2A protein levels were lower in the nicotine groups compared with the control groups, with little apparent impact in the ethanol group (AGM study 2). Lung CYP2A immunoblots from (A) the lower lung and (B) the upper lung are shown with β-actin immunoblots and Coomassie Blue gel staining (protein loading controls). The blots contain representative samples loaded at 75 μg (n = 3 of 10 from each treatment group). CYP2A/β-actin was lower in (C) the lower lungs and (D) the upper lungs of nicotine and nicotine + ethanol groups compared with the control group (n = 10 per group, two-way ANOVA followed by Tukey’s multiple comparison post hoc tests). (E) CYP2A/β-actin levels were correlated between the lower and upper lung within AGM (Pearson’s r correlation analysis). **P < 0.01.
There was a main effect of the nicotine versus control treatments in both the lower [F(1,36) = 36.18, P < 0.001] and upper [F(1,36) = 44.65, P < 0.001] lung. There was no main effect of self-administration of ethanol versus control treatments in either the lower [F(1,36) = 1.62, P = 0.212] or upper [F(1,36) = 2.56, P = 0.119] lung. There was also no treatment interaction [lower lung: F(1,36) = 1.14, P = 0.293, upper lung: F(1,36) = 0.71, P = 0.405] (Fig. 6, C and D).
The nicotine group versus the control group had lower levels of CYP2A protein in the lower [5.87-fold; CI (3.86–7.88), P < 0.001] and upper [4.46-fold; CI (3.04–5.88), P < 0.001] lung (Fig. 6, C and D). The nicotine + ethanol group versus the control group also had lower levels of CYP2A protein in the lower [6.83-fold; CI (3.83–9.83), P < 0.001] and upper [6.73-fold; CI (5.62–7.84), P < 0.001] lung. However, the nicotine group versus the nicotine + ethanol group did not have different levels of CYP2A protein in the lower (P = 0.998) or upper (P = 0.950) lung. Blot-to-blot adjusted (as shown in Fig. 6, C–E) and unadjusted (raw) data provided virtually identical fold group differences (Supplemental Table 2).
Among the entire data set, CYP2A protein levels in the lower and upper lung were highly correlated (r2 = 0.780, P < 0.001) within individual AGMs (Fig. 6E). The distributions of the CYP2A/β-actin levels between the lower and upper lung of the control group (P = 0.895), nicotine group (P > 0.999), ethanol group (P = 0.991), or nicotine + ethanol group (P > 0.999) were indistinguishable.
Within AGMs, CYP2A Protein Levels Were Lower in the Lung Compared with the Liver.
Hepatic CYP2A protein levels from individual AGMs in AGM study 2 have been previously analyzed by our group (Ferguson et al., 2012). The lung versus the liver had substantially lower levels of CYP2A protein [40.46-fold; CI (36.65–44.27), P < 0.001] (Supplemental Fig. 1), as expected. CYP2A protein levels in the liver and lung were also highly correlated within individual AGMs (Supplemental Fig. 1).
Discussion
The findings of this study indicate that smoking and nicotine exposure can reduce CYP2A enzymes in human and AGM lung. In humans, lung CYP2A isoforms of CYP2A13, CYP2A6, and CYP2A7 mRNAs displayed distinct distributions between smokers and nonsmokers, which suggests an association of lower levels of CYP2A mRNA with smoking. This was observed in two GEO data sets (Wang et al., 2012; O’Beirne et al., 2018). Similarly, in two nonhuman primate studies, AGMs treated with nicotine had lower levels of lung CYP2A protein than controls. The treatment of 0.3 mg/kg of nicotine twice daily in study 1 resulted in a 4.03-fold and 3.74-fold decrease in CYP2A protein for the lower and upper lung, and the treatment of 0.5 mg/kg of nicotine twice daily in study 2 resulted in a 5.87- and 4.46-fold decrease in the lower and upper lung, respectively. The apparent greater fold decrease in AGM study 2 compared with study 1 suggests a potential dose-related impact of nicotine treatment on lowering AGM lung CYP2A. This was reflected in the human data, in which CYP2A mRNA was negatively correlated with cigarette pack-years. There was a similar level of lung CYP2A within animal in the upper and lower lung. Ethanol exposure did not affect AGM lung CYP2A alone or with nicotine, suggesting a lack of effect and synergism between these two drugs under these conditions. Within AGM study 2, we also highlighted the relative expression of lung CYP2A compared with hepatic CYP2A: ∼40-fold lower level of lung CYP2A versus hepatic CYP2A protein (Supplemental Fig. 1). Human CYP2A mRNA levels in various respiratory tissues were lower compared with the liver: ∼14-fold lower in the nasal mucosa, ∼67-fold lower in the trachea, and ∼144-fold lower in the lungs (Su et al., 2000). The similarity in relative organ levels of CYP2A suggests that, for liver and lung, there is similar control over expression of CYP2As in AGMs and humans.
Previous reports on CYP2A detection and quantification in human lung have been inconsistent. In a cohort of patients with cancer, the levels of CYP2A13 and CYP2A6 proteins from peripheral lung surgical resections (tumor-adjacent) varied extensively between patients (Zhang et al., 2007). Some patients had low levels of lung CYP2A protein; ∼10% had no detectable CYP2A6, and ∼88% had no detectable CYP2A13 (Zhang et al., 2007). In the current study, CYP2A6 and CYP2A13 mRNAs were detectable in all subjects. Differences between healthy and resected tissues may have contributed to detection differences between the current and previous studies. In mice, lung tumors were found to downregulate the expression of CYP2A13 in adjacent tissue, with an ∼2-fold decrease in CYP2A13 protein and mRNA compared with control healthy lung tissue (Liu et al., 2015); this may partially explain the lack of CYP2A detection in the previous human study (Zhang et al., 2007). The current study also highlights an underlying effect of smoking/nicotine in lowering lung CYP2A expression. Thus, we suspect that patient exposure to smoking or nicotine may also have contributed to the low CYP2A protein detection in the previous study (Zhang et al., 2007).
There was a lower fold difference in human lung CYP2A mRNA by smoking status (1.04- to 1.12-fold) compared with the fold difference in AGM lung CYP2A protein by nicotine treatments (∼3- to 7-fold). The association of lower CYP2A mRNA in smokers suggests transcriptional regulation. Nicotine can cause an inflammatory response, and inflammation has been previously associated with a reduction in lung CYP2A transcript levels (Gonçalves et al., 2011; Lee et al., 2012; Pouwels et al., 2016). Nicotine can also increase protein ubiquitination and subsequent proteolytic degradation (Bodas et al., 2016; Cao et al., 2018) and thus may contribute to the larger protein fold difference seen in AGM and play a role in reducing CYP2A lung protein levels.
Another plausible explanation relates to nicotine exposure differences between human smokers and nicotine-treated AGMs. The 16-hour average nicotine plasma levels previously determined for AGMs in study 1 and 2 were 44 and 61 ng/ml, respectively (Lee et al., 2006; Ferguson et al., 2011). These are similar to the average plasma nicotine levels achieved by a smoker during waking hours (approximately 16 hours) of 30 ng/ml (average range: 10–50 ng/ml) (Benowitz, 1990; Benowitz and Jacob, 1984). Smoking results in decreased nicotine clearance (12%–27%) (Benowitz and Jacob, 1993, 2000), similar to the increase in plasma nicotine half-life in AGMs of 1.3-fold previously observed after treatment with 0.5 mg/kg nicotine twice daily (Ferguson et al., 2011). However, nicotine was administered to AGMs in two bolus subcutaneous injections compared with nicotine obtained from 20 cigarettes smoked throughout a day by the average smoker (Benowitz and Jacob, 1984). The resulting higher peak concentrations of plasma nicotine in AGMs compared with the average smoker may have impacted the nicotine effect in AGM compared with human lung CYP2A.
Ethanol self-administration had no apparent effect on AGM lung CYP2A levels. The ethanol treatment paradigm was designed to model moderate alcohol consumption. The average daily ethanol intake of monkeys in the ethanol and nicotine + ethanol groups was ∼3.0 g of ethanol per kilogram of body weight (Ferguson et al., 2011). This level of consumption in these monkeys led to an average ± S.D. blood ethanol level of 26 ± 3.0 mM (Ferguson et al., 2011), which is within the range found in moderate alcohol consumers (5–20 mM) (Eckardt et al., 1998). Ethanol has been shown to increase CYP2A6 in human monocytic cell lines, in which ethanol treatment at 100 mM was able to induce CYP2A6 (Jin et al., 2012). Additionally, the nicotine metabolite ratio, an in vivo predictive CYP2A6 biomarker, was positively correlated with drinks per week (Chenoweth et al., 2014), and those in treatment of alcohol dependence had a decrease in nicotine metabolite ratio with abstinence, suggesting heavy alcohol use may induce hepatic CYP2A6 (Dermody et al., 2020). Thus, it is possible that higher ethanol consumption than found here may induce lung CYP2A.
In the current study, the effects of nicotine and ethanol exposure on AGM lung CYP2A were consistent with our previous findings in these AGMs, in which hepatic CYP2A was lowered by nicotine and unaffected by ethanol (Ferguson et al., 2012). In AGM study 1, nicotine treatment (0.3 mg/kg of nicotine twice daily), decreased hepatic CYP2A by ∼1.6-fold (Schoedel et al., 2003) versus the ∼3.8-fold difference observed here in lung CYP2A. Similarly, in AGM study 2, nicotine treatment (0.5 mg/kg of nicotine twice daily) decreased hepatic CYP2A by ∼2.5-fold (Ferguson et al., 2012) versus the ∼5.2-fold difference observed here in lung CYP2A. Together, this suggests that these nicotine treatments may cause a larger reduction in CYP2A expression in AGM lung than liver. Furthermore, the association of smoking in humans and the systemic nicotine treatment of AGMs (subcutaneous injections) with reduced lung CYP2A suggests that nicotine itself can reduce CYP2A in the lungs and liver even after a nonpulmonary delivery. Thus, we suspect that nicotine delivered by other routes, such as nicotine patch, may also downregulate CYP2A.
There are potential consequences of lowered CYP2A expression in the lung and the liver. In humans, both CYP2A13 and CYP2A6 can activate smoking-derived procarcinogens, including 3-(1-nitrosopyrrolidin-2-yl)-pyridine and NNK (D’Agostino et al., 2008; Wassenaar et al., 2015; McKay et al., 2017). For NNK, lung P450–mediated activation may play a larger role in lung carcinogenicity than hepatic activation (Weng et al., 2007; Zhang et al., 2007; Li et al., 2014; Liu et al., 2015). NNK induced fewer lung tumors in an inactivated-lung P450 mouse model compared with inactivated-liver P450 mice (Weng et al., 2007), suggesting the lung P450 enzymes contribute more than the hepatic P450 enzymes to NNK-derived tumor formation (Weng et al., 2007). Hepatic P450 activity, including CYP2A, is important in smoking-related lung cancer, in part via activation of other procarcinogens, and the relative contributions of lung and hepatic CYP2A may be carcinogen-dependent (Gu et al., 2005).
CYP2A13 and CYP2A6 genetically reduced metabolizers are at lower risk for smoking-related lung cancer, which may be due to the reduced activation of smoking-related procarcinogens (D’Agostino et al., 2008; Wassenaar et al., 2015; McKay et al., 2017). CYP2A13 reduced metabolizers with the CYP2A13*2 allele, a genetic variant with reduced activity toward nitrosamines, were found to be at lower risk for smoking-related adenocarcinoma compared with CYP2A13 normal metabolizers (D’Agostino et al., 2008). Similarly, CYP2A6 reduced metabolizers have a lower risk for lung cancer compared with normal metabolizers (Wassenaar et al., 2015). Thus, the effect of nicotine treatment on the reduction of lung CYP2As and previously reported reduction in hepatic CYP2As suggests that nicotine via pulmonary or systemic delivery may reduce lung cancer risk through the reduction of procarcinogen activation by lung and hepatic CYP2As.
In summary, this is the first study to show the association of smoking with a reduction in human lung CYP2A mRNA. This was supported by the assessment in nonhuman primates of the causal impact of nicotine treatment on decreasing AGM lung CYP2A protein. The decrease in lung CYP2A by nicotine was similar throughout the lung and was not dependent on pulmonary intake (i.e., occurred with systemic administration). It remains to be determined whether this downregulation of lung CYP2A by nicotine would be sufficient to alter the risk of lung damage or disease from inhaled or systemic drugs, carcinogens, and toxins.
Acknowledgments
We thank Fariba Baghai Wadji for her technical assistance and the staff of the Behavioural Sciences Foundation, St. Kitts, for their dedication and care in conducting all aspects of the animal experiments.
Authorship Contributions
Participated in research design: Gao, Miksys, Palmour, Tyndale.
Conducted experiments: Gao.
Performed data analysis: Gao.
Wrote or contributed to the writing of the manuscript: Gao, Miksys, Tyndale.
Footnotes
- Received June 24, 2020.
- Accepted September 17, 2020.
This work was supported by a Canada Research Chair in Pharmacogenomics (R.F.T.); the Canadian Institutes of Health Research [FDN 154294, PJY 15971, MOP 136937]; the Campbell Family Mental Health Research Institute of the Centre for Addiction and Mental Health (CAMH); and the CAMH Foundation. This paper has been deposited in a preprint in Authorea (https://doi.org/10.22541/au.159285510.07118043).
↵
 This article has supplemental material available at molpharm.aspetjournals.org.

Abbreviations
- AGM
- African green monkey
- BSA
- bovine serum albumin
- CI
- confidence interval
- f
- degree of overlap
- GEO
- Gene Expression Omnibus
- NNK
- 4-[methyl(nitroso)amino]-1-(3-pyridinyl)-1-butanone
- P450
- cytochrome P450
- Copyright © 2020 by The American Society for Pharmacology and Experimental Therapeutics


