


Article Figures & Data
Figures
- Fig. 1.
Treatment paradigm for the AGM study 1.
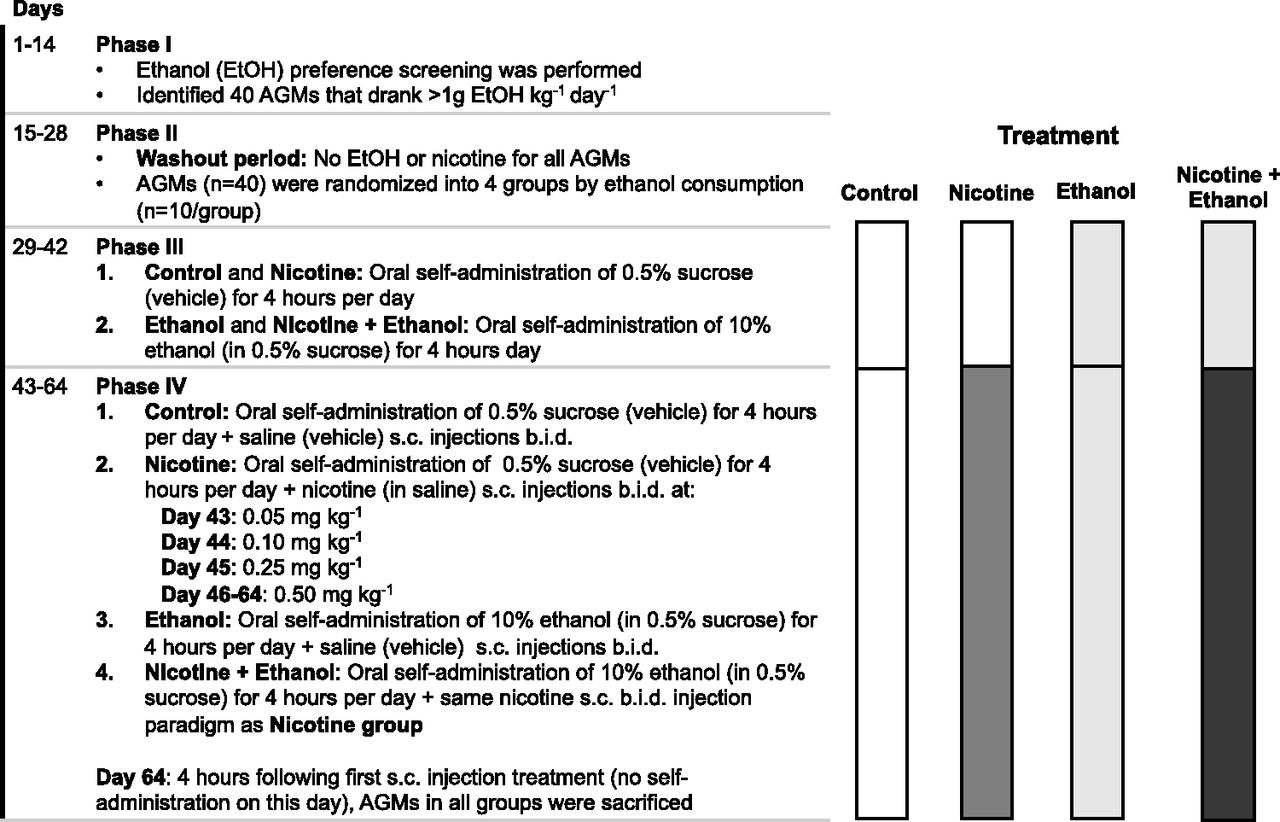
- Fig. 2.
Treatment paradigm for the AGM study 2.
- Fig. 3.
Distributions of CYP2A13, CYP2A6, and CYP2A7 mRNA levels were distinct between smokers and nonsmokers. (A) Probe intensities for the three mRNAs in the GSE30063 (GEO study 1) had degrees of overlap between smokers and nonsmokers of 30.8%, 31.4%, and 32.3%, respectively. (B) Probe intensities for the three mRNAs in the GSE108134 (GEO study 2) had degrees of overlap of 11.5%, 12.3%, and 11.8%, respectively (unpaired Mann-Whitney U tests and common language effect size f). *P < 0.05; ***P < 0.001.
- Fig. 4.
Immunoblotting assays were selective and linear. (A) Positive controls for CYP2A6 primary antibody included human liver microsomes (HUM LIV) (upper band is CYP2A13 and lower band is CYP2A6), AGM liver microsomes (AGM LIV),AGM lung membranes (AGM LNG),, and cDNA-expressed CYP2A13 and CYP2A6. Negative controls included cDNA-expressed CYP3A4, CYP2E1, CYP2D6, and CYP2B6; there was no crossreactivity of the CYP2A6 primary antibody with these P450 enzymes. Standard curves of pooled AGM control group lung membranes display linear signal detection (y-axis units are arbitrary optical densities) for up to 200 μg protein loaded with (B) CYP2A6 antibody, (C) β-actin antibody, and (D) Coomassie Blue gel staining (linear regression analyses demonstrated values of R2).
- Fig. 5.
AGM lung CYP2A protein levels were lower in the nicotine group compared with the control group (AGM study 1). Lung CYP2A immunoblots from (A) the lower lung and (B) the upper lung are shown with β-actin immunoblots and Coomassie Blue gel staining (protein loading controls). The blots contain a standard curve of pooled control AGM lung (25–150 μg) and representative samples loaded at 75 μg (n = 3 of six from each treatment group). CYP2A/β-actin was lower in (C) the lower lungs and (D) the upper lungs of the nicotine group compared with control group (n = 6 per group, two-tailed unpaired t test with Welch’s correction). (E) CYP2A/β-actin levels were correlated between the lower and upper lung within AGM (Pearson’s r correlation analysis). *P < 0.05; **P < 0.01.
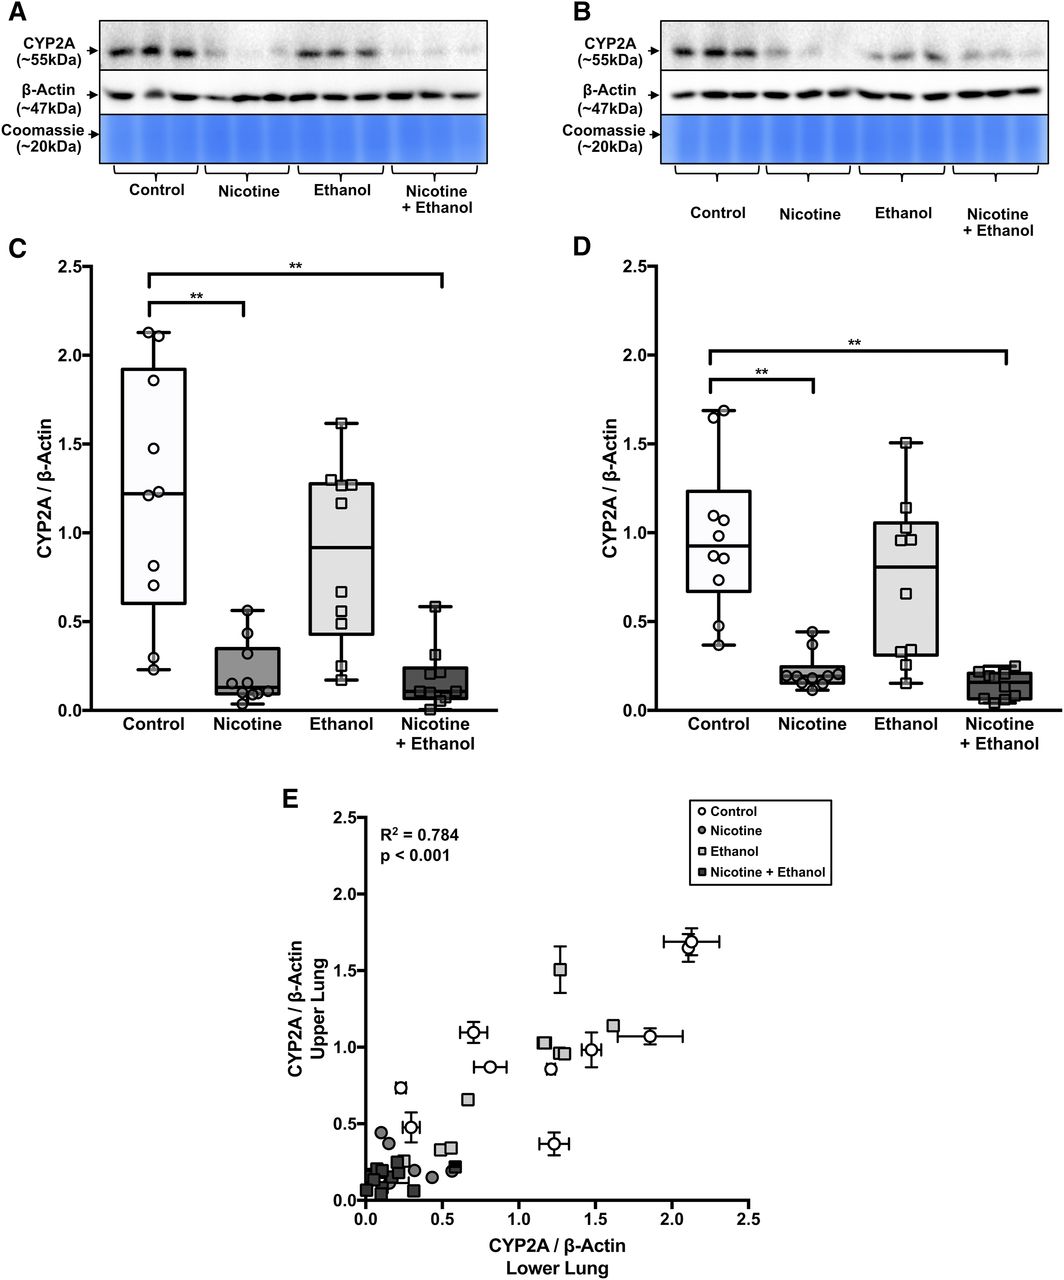
- Fig. 6.
AGM lung CYP2A protein levels were lower in the nicotine groups compared with the control groups, with little apparent impact in the ethanol group (AGM study 2). Lung CYP2A immunoblots from (A) the lower lung and (B) the upper lung are shown with β-actin immunoblots and Coomassie Blue gel staining (protein loading controls). The blots contain representative samples loaded at 75 μg (n = 3 of 10 from each treatment group). CYP2A/β-actin was lower in (C) the lower lungs and (D) the upper lungs of nicotine and nicotine + ethanol groups compared with the control group (n = 10 per group, two-way ANOVA followed by Tukey’s multiple comparison post hoc tests). (E) CYP2A/β-actin levels were correlated between the lower and upper lung within AGM (Pearson’s r correlation analysis). **P < 0.01.


Additional Files
Data Supplement
- Supplemental Data -
Supplementary Table 1 - AGM study 1 differences between treatment groups after different adjustment methods with
loading controls.Supplementary Table 2 - AGM study 2 differences in treatment groups using different adjustment methods and loading
control.Supplementary Table 3 - Primary and secondary antibodies used for immunoblotting.
Supplementary Figure 1 - AGM CYP2A protein levels (for the total organ) were substantially lower in the
lung compared to liver (AGM study 2).
- Supplemental Data -


