


Article Figures & Data
Figures
- Fig. 1.
RET+ patient–derived cell lines. (A) Schematic describing RET rearrangements in cell lines derived from patients at University of Colorado Thoracic Oncology. (B) Table describing relevant patient characteristics, cell line growth behavior, and co-alterations detected in clinical sequencing assays. K23;R12 indicates KIF5B exon 23; RET exon 12. K15;R12 indicates KIF5B exon 15; RET exon 12. E19;R12 indicates EML4 exon 19; RET exon 12, C1;R12 indicates CCDC6 exon 1; RET exon 12. Adenomatous polyposis coli (APC), tryptophan-aspartic acid repeats (WD)
- Fig. 2.
RET+ cell lines exhibit differential sensitivity to RET inhibitors. (A) MTS proliferation assays of CUTO22 (blue), CUTO32 (red), CUTO42 (green), and LC-2/Ad (black) cells treated with increasing concentrations of RXDX-105, BLU-667, or ponatinib for 72 hours. Error bars represent means ± S.D. for three replicate experiments. Lower table shows IC50 (nanomolar) values ± S.D. for each inhibitor and cell line. (B) Measurement of apoptosis induction with cleaved caspase 3/7 assay after treatment with increasing concentrations of ponatinib or RXDX-105 for 24 hours. Error bars represent means ± S.D. for three replicate experiments. (C) Western blot analysis of CUTO22, CUTO32, CUTO42, and LC-2/Ad cells treated with increasing concentrations of BLU-667 for 2 hours. pRET = 4G10 anti-phosphotyrosine in LC-2/Ad cells. (D) Quantification of dose-dependent inhibition of pRET with BLU-667. (E) IC50 values for pRET inhibition in immunoblot experiment.
- Fig. 3.
RET inhibitors successfully decrease KIF5B-RET activation but show variable MAPK and AKT inhibition. Western blot analysis of RET inhibition and downstream signaling in CUTO22 (A), CUTO42 (B), and LC-2/Ad (C) cells treated with increasing concentrations of ponatinib, RXDX-105, or BLU-667 for 2 hours. pRET = 4G10 anti-phosphotyrosine for LC-2/Ad.
- Fig 4.
RET+ cells have differential responses to MEK and PI3K inhibition. (A) MTS proliferation assays in CUTO22, CUTO42, and LC-2/Ad cells treated with increasing concentrations of trametinib or omipalisib. Lower table describes IC50 values ± S.D. Error bars represent means ± S.D. for three replicate experiments. MTS proliferations assays in CUTO22, CUTO32, CUTO42, or LC-2/Ad cells treated with increasing concentrations of RXDX-105 alone or in combination with 15 nM trametinib (B) or 20 nM omipalisib (C). Error bars represent means ± S.D. for three biologic replicate experiments. (D) Western blot analysis of cells treated with 10 or 100 nM omipalisib for 2 hours. (E) Western blot analysis of RET+ cell lines treated with RXDX-105, trametinib, or both for 2 hours. aIC50 not calculated because cells did not reach 50% inhibition of proliferation. bIC50 calculated from N = 2 replicates because third replicate did not reach 50% of proliferation.
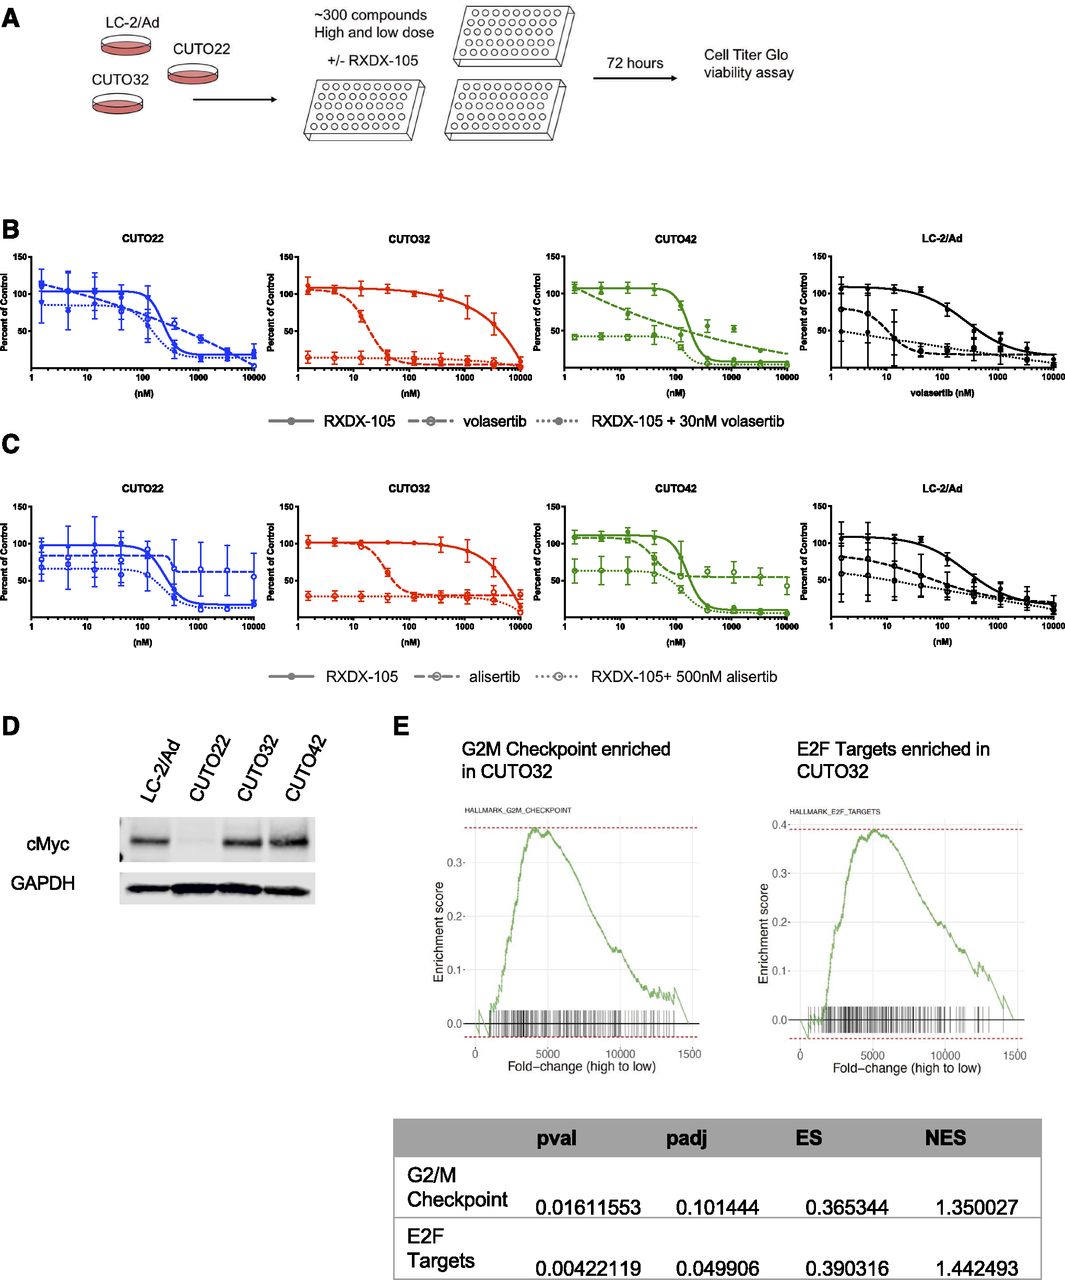
- Fig. 5.
Drug screening reveals unique vulnerabilities in cell cycle regulation. (A) Schematic describing drug screening strategy. CUTO22, CUTO32, and LC-2/Ad cells were treated with approximately 300 compounds at two fixed concentrations of inhibitors with or without 200 nM RXDX-105. Cell viability was assayed after 72 hours using Cell Titer Glo. (B) MTS proliferation assays of CUTO22, CUTO32, CUTO42, and LC-2/Ad cells treated with RXDX-105, volasertib, or RXDX-105 combined with 30 nM volasertib for 72 hours. Error bars represent means ± S.D. for three replicate experiments. (C) MTS proliferation assays of CUTO22, CUTO32, CUTO42, and LC-2/Ad cells treated with RXDX-105, alisertib, or RXDX-105 combined with 500 nM alisertib for 72 hours. Error bars represent means ± S.D. for three biologic replicate experiments. (D) Immunoblot analysis for MYC expression in CUTO22, CUTO32, CUTO42, and LC-2/Ad cells. (E) Gene set enrichment analysis of CUTO32 (untreated) compared with CUTO22 (untreated) cells shows an enrichment of genes associated with G2/M transition and E2F targets in CUTO32 cells. Adjusted p-value (padj), p-value (pval), enrichment score (ES), normalized enrichment score (NES).
- Fig. 6.
RET inhibitor treatment inhibits tumor growth in CUTO42 xenografts more effectively than CUTO32 xenografts. (A) CUTO32 or CUTO42 cells were subcutaneously implanted in the flanks of nude mice. Once tumors developed, mice were treated once per day with 60 mg/kg BLU-667, 1 mg/kg trametinib, 1.5 mg/kg omipalisib, 30 mg/kg alisertib, or control (vehicle) via daily oral gavage. N = 10 mice per treatment group. (B) Graphs of percent change in tumor growth (relative to starting tumor volume at initiation of treatment). Error bars represent ±S.D. (C) Summary figure describing potential for differential recruitment of adapter proteins in KIF5B-RET+ and non–KIF5B-RET+ cells. (D) Potential differential subcellular localization of RET fusion proteins. Glial cell line-derived neurotrophic factor (GDNF), growth factor receptor bound protein 2(Grb2).


Additional Files
Data Supplement
- Data Supplement -
Supplemental Figure 1 - A. Representative phase contrast images from InCucyte of CUTO22, CUTO32, CUTO42 and LC-2/Ad cells under untreated conditions show different cellular morphologies.
Supplemental Figure 2 - RET inhibitors rapidly decrease RET activation and is sustained for up to 24 hours.
Supplemental Figure 3 - CUTO32 cells treated with indicated concentrations of ponatinib, RXDX-105 or BLU-667 for 2 hours.
Supplemental Figure 4 - . CUTO32 cells are sensitive to PLK1 and Aurora kinase inhibitors in drug screen.
Supplemental Figure 5 - Normalized expression in counts per million (CPM) of selected genes from RNA sequencing.
Supplemental Figure 6 - Co-inhibition of MET does not sensitize RET+ cells to RET inhibitors.
Supplemental Figure 7 - Average mouse weight measurements for xenograft experiments.
- Data Supplement -
Data Supplement
- Supplemental Data -
Supplemental Methods
Supplemental Table 1 - Sequences for knockdown, knock-out, protein inhibitor experiments.
Supplemental Table 2 - Characteristics of cell lines used in hUNG2 inhibition experiments and FdU IC50
valuesaSupplemental Table 3 - Substrate sequences for hUNG activity assay.
Supplemental Table 4 - Retention time and fragmentation products monitored by LC-MS.
Supplemental Table 5 - IC50 values for FU in colorectal cancer cell linesa
Supplement Table 6 - Raltitrexed IC50 values and Area under curve analysis for Colorectal Cancer Cell Linesa.Supplemental Figure 1 - Validation of HCT116 isogenic TP53 knock-out.
Supplemental Figure 2 - Measurement of hUNG Activity for non-colorectal cell lines.
Supplemental Figure 3 - Measurement of Inducible hUNG inhibition after 3 months of cultures.
Supplemental Figure 4 - Inhibition of hUNG activity increases potency of FdU for a subset of noncolorectal cancer cell lines.
Supplemental Figure 5 - Average transcript levels of DNA damage repair and uracil metabolism genes in hUNG-responsive and non-responsive cancer cell lines.
Supplemental Figure 6 - Evaluation of apoptosis and double stranded breaks in hUNG responsive and nonresponsive colon cancer cell lines in response to 100 nM concentration of FdU.
Supplemental Figure 7 - Validation of Apoptosis Assay using TRAIL agonist.
Supplemental Figure 8 - Cell proliferation assay for FdU toxicity in representative R and NR cell lines.
Supplemental Figure 9 - Quantitative measurements of hUNG activity across FdU responsive and non-responsive cell lines.
Supplemental Figure 10 - Sanger electropherogram tracings of thymine-DNA glycosylase (TDG) CRISPR knock out clones in the DLD1 background.
Supplemental Figure 11 - Evaluating the impact of ion channel blockade or NOTCH1 inhibition to exacerbate FdU cytotoxicity in two R lines.
Supplemental References
- Supplemental Data -
Data Supplement
- Supplemental Figure -
Supplemental Figure 1 - Structure of Ang II and its chemicaly modified analogues.
- Supplemental Figure -


