


Abstract
Alterations in cancer genomes strongly influence clinical responses to treatment and in many instances are potent biomarkers for response to drugs. The Genomics of Drug Sensitivity in Cancer (GDSC) database (www.cancerRxgene.org) is the largest public resource for information on drug sensitivity in cancer cells and molecular markers of drug response. Data are freely available without restriction. GDSC currently contains drug sensitivity data for almost 75 000 experiments, describing response to 138 anticancer drugs across almost 700 cancer cell lines. To identify molecular markers of drug response, cell line drug sensitivity data are integrated with large genomic datasets obtained from the Catalogue of Somatic Mutations in Cancer database, including information on somatic mutations in cancer genes, gene amplification and deletion, tissue type and transcriptional data. Analysis of GDSC data is through a web portal focused on identifying molecular biomarkers of drug sensitivity based on queries of specific anticancer drugs or cancer genes. Graphical representations of the data are used throughout with links to related resources and all datasets are fully downloadable. GDSC provides a unique resource incorporating large drug sensitivity and genomic datasets to facilitate the discovery of new therapeutic biomarkers for cancer therapies.
INTRODUCTION
There is compelling evidence that alterations in cancer genomes can strongly influence clinical responses to anticancer therapies. Indeed, there are now several examples where genomic changes can be used as molecular biomarkers to identify patients most likely to benefit from a treatment. For example, the use of drugs to target the protein product of the BCR–ABL translocation in chronic myeloid leukemia, or the BRAF gene in malignant melanoma, has transformed the treatment of these diseases and substantially improved survival rates (1,2). Despite these notable successes, many cancer drugs in use or development have not been linked to specific genomic markers that could direct their clinical use to maximize patient benefit. Moreover, even among appropriately selected patients, a poorly explained range of clinical responses is observed (2,3). Thus, there exists a need for the development of new and improved biomarkers to guide therapies and ultimately improve clinical responses.
Recent years have seen significant advances in our understanding of the molecular nature of cancer (4). This has been driven in part by advances in high-throughput technologies and, in particular, DNA sequencing technologies that allow us to sequence on a scale that was previously unthinkable. In the near future, sequencing efforts will provide a complete description of the genomic changes that occur in many cancer subtypes. A complete list of the repertoire of cancer genes will provide profound insights into the origins, evolution and progression of cancer and will act as an impetus for the development of new cancer therapies.
To exploit this increased understanding, preclinical studies that link the genomic complexity of cancer with functional readouts such as drug sensitivity are required. Cancer cell lines derived from naturally occurring tumours have been generated from many different cancer types and in many respects recapitulate the tissue type and genomic context of cancer. They are a facile system for experimental manipulation and are a standard research tool in molecular biology and drug discovery. Significantly, several studies have used cancer cell lines to link pharmacological data with genomic information and helped define therapeutic biomarkers (5–7). Collectively, these studies have demonstrated that pharmacogenomic profiling in cancer cell lines can be used as a biomarker discovery platform to guide the development of new cancer therapies.
The Genomics of Drug Sensitivity in Cancer (GDSC) database (www.cancerRxgene.org) is designed to facilitate an increased understanding of the molecular features that influence drug response in cancer cells and which will enable the design of improved cancer therapies. GDSC holds and annotates large datasets on drug sensitivity in cancer cells and links these data to detailed genomic information to facilitate the discovery of molecular biomarkers of drug response. The website is designed to provide straightforward access to querying the database, and interactive graphical interfaces are used throughout to provide readily interpretable summaries of data and analyses.
DATABASE CONTENT
The GDSC database is based on three types of datasets as described in the following sections.
Cell line drug sensitivity data
Cancer cell line drug sensitivity data are generated from ongoing high-throughput screening performed by the Cancer Genome Project at the Wellcome Trust Sanger Institute (WTSI) and the Center for Molecular Therapeutics at Massachusetts General Hospital using a collection of >1000 cell lines (7). Compounds selected for screening are anticancer therapeutics encompassing both targeted agents and cytotoxic chemotherapeutics. They are comprised of approved drugs used in the clinic, drugs undergoing clinical development and in clinical trials and tool compounds in early phase development. They cover a wide range of targets and processes implicated in cancer biology including receptor tyrosine kinase signalling, cell cycle control, DNA damage response and the cytoskeleton. Compounds are sourced from commercial vendors or provided by collaborators in academia, biotech and the pharmaceutical industry.
Cell line drug sensitivity is measured using fluorescence-based cell viability assays following 72 h of drug treatment. Dose–response curves are fitted to fluorescence signal intensities over nine drug concentrations (2-fold dilution series) to derive a multi-parameter signature of drug response. Values reported on the website include the half maximal inhibitory concentration (IC50), the slope of the dose–response curve and the area under the curve for each experiment.
The current release of GDSC (release 2, July 2012) includes drug sensitivity data for 138 anticancer compounds screened across a range of 329–668 cell lines per drug (mean = 525 cell lines per drug) representing 73 169 cell line–drug interactions. This is the largest public resource available on drug sensitivity in cancer cells. Screening is ongoing and the objective is to screen these compounds, as well as additional compounds in the future, across the entire collection of >1000 cell lines. Data release occurs every 4 months and with each release, these results are updated with new data for existing drugs, as well as data for newly screened drugs.
Genomic datasets for cell lines
The total collection available for screening includes >1000 different cancer cell lines. These have been selected to represent the spectrum of common and rare types of adult and childhood cancers of epithelial, mesenchymal and haematopoietic origin. The cell lines have been extensively genomically characterized as part of the cancer cell line project from the Cancer Genome Project at the WTSI. The genomic datasets currently available for each cell line include information on somatic mutations in 75 cancer genes, genome wide gene copy number for amplification and deletion, targeted screening for seven gene rearrangements, markers of microsatellite instability, tissue type and transcriptional data. Using various statistical approaches as described below, genomic datasets are used together with drug sensitivity data for each cell line to identify genomic biomarkers of drug response. Genomic datasets within GDSC are obtained and updated directly from the Catalogue of Somatic Mutations in Cancer (COSMIC) database, a comprehensive freely available resource for the annotation and presentation of somatic mutations in cancer (8).
Analysis of genomic features of drug sensitivity
An essential component of the GDSC database is the systematic integration of large-scale genomic and drug sensitivity datasets. To identify genomic markers of drug response, we currently use two complementary analytical approaches (7). A multivariate analysis of variance (MANOVA) is used to correlate drug sensitivity (IC50 values and slope of the dose–response curve) with genomic alterations in cancer including point mutations, amplifications and deletions of common cancer genes, cancer gene rearrangements and microsatellite instability. The MANOVA identifies individual genomic features associated with drug sensitivity and for each drug–gene association reports a size effect and statistical significance of the association.
We also apply elastic net regression, a penalized linear modelling technique, to identify multiple interacting genomic features influencing each drug response. Genomic data used in the elastic net analysis include all of those used in the MANOVA and also incorporate genome-wide transcriptional profiles and tissue type. The elastic net selects which of these features are associated with drug response as measured by IC50 values across the cell line panel. For each drug, a feature list is built comprised of mutations, transcripts and tissue with an effect size assigned to each.
A more detailed description of the different statistical analyses performed, as well as guidance on interpreting the results, can be found on the ‘Help & Documentation’ webpages under the ‘statistical analysis’ tab.
DATA ACCESS
Querying the GDSC database
The website is focused on presenting cell line drug sensitivity data and genomic correlates of drug sensitivity. Although data on the genomic characterization of the cell lines are available through the GDSC website, these data are presented in more detail within the COSMIC database.
To facilitate data interpretation, graphical representations with interactive features are used wherever possible. Querying the database is primarily based on either specific screening ‘Compounds’ or ‘Cancer Genes’ in the ‘Browse our data’ section of the homepage (Figure 1). Browsing by ‘Compounds’ displays a list of drug names together with their associated synonyms, putative therapeutic target(s), the number of cell lines screened for each drug (sample size) and date of the most recent data update for each compound. A link to the PUBCHEM database of chemical structures is provided (9). By clicking a specific drug name, users enter the individual drug page where drug sensitivity and genomic correlation data are presented.
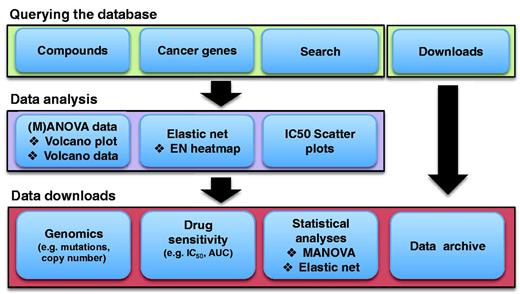
A schematic representation of the GDSC database structure and content. Data are accessed in a hierarchical fashion by either querying by screening compound or cancer gene of interest. This gives access to graphical representations of cell line drug sensitivity data and genomic correlations of drug response in multiple formats through either drug- or gene-specific pages. All data are freely available for download either through gene- or drug-specific pages, or as a whole through the download page.
Similarly, browsing ‘Cancer Genes’ leads to a list of cancer genes identified by their HUGO name. This page provides direct links to the COSMIC page for the gene and to the UniProt databases for further protein information (10). Clicking on the gene name accesses the drug sensitivity and genomic correlation data on the individual gene page.
It is also possible to query the database using a ‘Search’ function (Figure 1). The ‘Search’ box accepts queries based on compound (including synonyms), cancer gene or cell line name. An auto-completion feature enables users to quickly select their drug, gene or cell line of interest. The search result page lists matching compounds, cancer genes or cell lines with links to the detailed drug/gene page of the website. In the case of cell line matches, links are provided to detailed cell line information within COSMIC.
Data analysis and visualization
Screening data and genomic correlations are accessed through specific drug or gene pages (Figures 2a and 3). The top panel provides drug or gene information and links to PUBCHEM, COSMIC and UniProt databases as appropriate. Notably, the top panel also provides links to relevant help pages to explain the data and analyses performed. Additional information is also available from the ‘Help & Documentation’ link found in the header at the top of all pages. The actual screening data and analyses are presented in the bottom panel of a drug/gene page and are split into the following tabs: Volcano plot, Volcano data, Elastic net (drug pages only), Scatter plots and Download data.
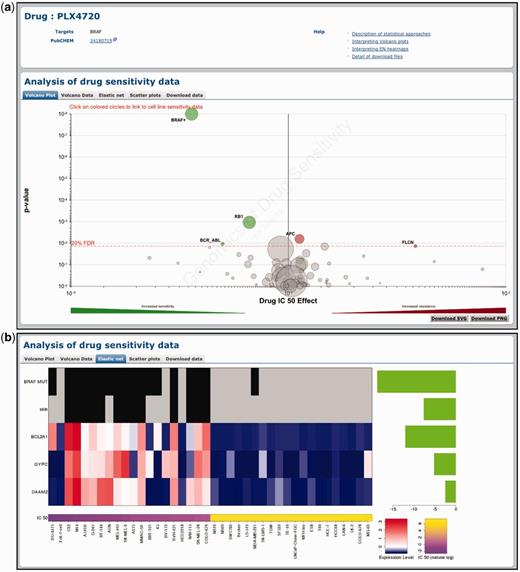
Querying the GDSC database by compound name. Drug-specific pages demonstrate the effect of genomic features on cell line sensitivity to a particular drug. In this example, we show the effect of genomic features on sensitivity to the BRAF-inhibitor PLX4720. (a) A volcano plot representation of MANOVA results showing the magnitude (x-axis) and significance (P-value, log scale on inverted axis) for each cancer gene association. Each circle represents a single drug–gene interaction and the size is proportional to the number of mutant cell lines screened for each drug. For clarity, the y-axis is capped at P = 1 × 10⁻⁸ and a plus sign (+) next to a circle indicates that the P-value is smaller than this threshold. The dashed red line represents a Benjamini–Hochberg multiple testing correction for significance and only significant associations are coloured either green for drug sensitivity or red for resistance. (b) Elastic net analysis of genomic features associated with sensitivity to PLX4720. Features with negative effect size are associated with drug sensitivity and features with positive effect size are associated with drug resistance (all features are negative in this example). Mutation and tissue features are at the top of the heatmap to represent the presence (black) or absence (grey) of a mutation/tissue subtype. Below this are gene expression and copy number features with blue corresponding to lower expression or copy number, and red to indicate higher expression or copy number.
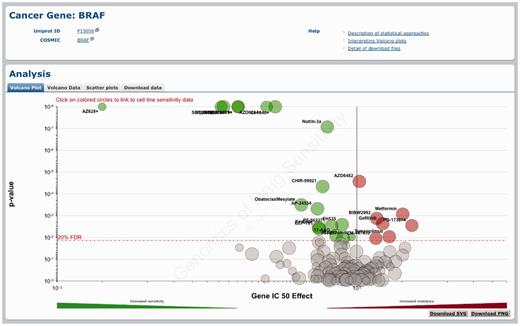
Querying the GDSC database by cancer gene. Gene-specific pages show how a cancer gene mutation affects response to many drugs. A volcano plot representation shows results of the MANOVA analysis for drug sensitivity associated with BRAF mutations.
A volcano plot is used to visualize the correlation of drug sensitivity data with genetic events as calculated using the MANOVA. The drug page shows a drug-specific volcano plot, which represents how different genomic changes influence response to a specific drug (Figure 2a). The gene page shows a gene-specific volcano plot, which represents the effect of a mutated cancer gene on the responses to all drugs analysed (Figure 3). For example, the drug-specific volcano plot for the BRAF-inhibitor PLX4720 shows that mutations in the gene BRAF are significantly associated with sensitivity to this compound (Figure 2a). Conversely, the gene-specific volcano plot for BRAF shows that mutations in this gene are associated with sensitivity to multiple drugs including several different BRAF inhibitors (i.e. PLX4720, SB590885 and AZ628) (Figure 3). In both cases, the x-axis represents the magnitude of the effect of a gene–drug interaction on IC50 values across the cell lines screened and the y-axis is the significance of the interaction (P-value). By hovering over each circle, the following information is provided: genetic event sample size (i.e. the number of cell lines screened with a specific mutation), effect size and P-value. By clicking on an individual circle, it is possible to link to a scatter plot of cell line IC50 values for this association (see below). The volcano data tab represents the volcano plot data as a sortable table. Three buttons at the top of the table allow the download of the table in .csv, .tab or .xlsx file format.
Similarly, the elastic net tab contains a graphical representation of results from the elastic net analysis of drug sensitivity (Figure 2b). For effective visualization, a maximum of 10 significant features associated with drug response are shown. These may include tissue type, mutations in cancer genes, expression levels and gene copy number. Each graphic contains three elements: a bar plot of effect size for significant features (right-hand side), a heatmap of genomic features (central panel) and a second heatmap of IC50 values for the 20 least and most sensitive cell lines (bottom). For example, the elastic net analysis for BRAF-inhibitor PLX4720 identified mutations in the BRAF gene, the tissue-type skin, as well as several transcriptional features (BCL2A1, GYPC and DAAM2) as associated with drug sensitivity (Figure 2b). Unlike the MANOVA analysis, gene-specific correlations for the elastic net analysis are not represented since the EN describes how multiple genes affect drug sensitivity together.
The ‘Scatter plots’ tab shows a plot of cell line IC50 values to a drug. IC50 values are split into two populations according to a cell lines mutational status for a given gene that is significantly associated with the drug response (Figure 4). In the example provided, cell lines with a BRAF mutation are on average more sensitive to PLX4720 compared with BRAF wild-type cell lines (Figure 4). The table in the middle shows the statistics for the plot including sample size, and the mean and median IC50 values for the two populations (mutated or wild type). Additional functionality includes the ability of users to select which drugs (or genes from the drug-specific pages) to plot. It is possible to link directly to relevant scatter plots by clicking on circles within the volcano plot pages. Furthermore, by clicking on circles within scatter plots, cell line IC50 values are directly linked to the COSMIC database facilitating integration of drug sensitivity data with detailed cell line information such a tissue type, tumour histology and a description of cell line origin and genotype.
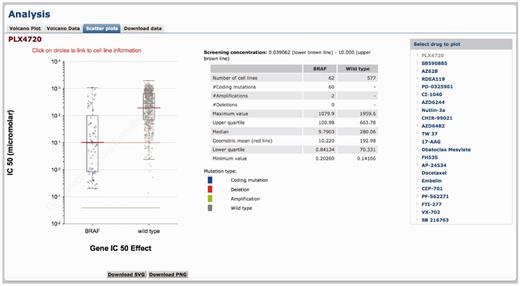
Scatter plot of cell line IC50 values and the effect of a cancer mutation. A scatter plot of cell line IC50 values for BRAF-mutated versus wild-type cell lines following drugging with PLX4720. Each circle represents the IC50 value for an individual cell line plotted on a logarithmic scale and the red line is the geometric mean of the population. Cell lines are colour coded to indicate whether the mutation is a coding mutation detected by sequencing, or an amplification or deletion detected by copy number analysis. The lower and upper brown lines indicate the minimum and maximum concentration in micro-molar of drug used for screening. Super-imposed on the scatter plot is a box-and-whisker plot showing the median, interquartile ranges and max and min for each plot. The central panel contains statistics for the plot and the right-hand table allows users to select which drug data to plot.
Download data
As the emphasis of the website is on the graphical representation of data both the volcano and scatter plots are downloadable as either .png or .svg files. In addition, the raw data are available to download in either .csv or .xlsx format. As described below, it is possible to download the data for a specific drug or gene on their associated pages, or to download the data from all of our analyses in a series of large spreadsheets.
On the drug page for a specific compound, the available downloads include (i) sensitivity data for the drug (a table of cell line IC50 values); (ii) genomic alterations in cell lines; (iii) genomic correlations with MANOVA and (iv) elastic net analysis of drug sensitivity. On a gene page a single data download is available, containing the MANOVA correlation for how a gene correlates with drug response across the entire panel of compounds.
Rather than downloading drug- or gene-specific data, drug sensitivity and genomic datasets can also be directly downloaded as a whole through the ‘Downloads’ page. This can be directly accessed from the header on each page. Downloadable files include (i) cell line tissue type, drug sensitivity and genomic data used for the MANOVA; (ii) the MANOVA results for all compounds; (iii) A tissue-specific ANOVA to examine the effect of tissue type on drug response; (iv) the elastic net results for all compounds; (v) cell line genomic and transcriptional data used for elastic net analysis and (vi) a continuously updated list of cancer cell lines in our collection. Please note that some of these files contain a large number of columns and data will be lost if files are opened in Excel 2003 or earlier versions because the worksheet size is limited to 256 columns. The ‘Downloads’ page also provides access to archive files of previous data releases.
FUTURE WORK
The GDSC database will expand significantly in coming years as the size and complexity of datasets increase. The database currently contains data for ∼75 000 experiments across 138 drugs and the amount of drug sensitivity data is expected to increase in size 2–3-fold within the next 2 years and even further in the future. This will include drug sensitivity data for many new cell lines to bring the total number to >1000 lines, and the inclusion of data for hundreds of newly screened anticancer drugs. Collectively, this will expand the number of different cancer subtypes and genotypes represented within the cell line collection, as well as the number of different drug targets interrogated by screening compounds.
Additional developments will see the further genomic characterization of the cell line collection to increase its utility as a resource. Notably, this will include whole-exome sequencing of all ∼22 000 coding genes across the entire collection. Whole genome SNP6.0 copy number data currently include ∼750 cell lines and this will be expanded to include the entire cell line collection. Similarly, basal transcriptional data are currently being updated to include the entire cell line collection using the latest Affymetrix human genome U219 mRNA expression array. These new genomic datasets, together with our expanding drug sensitivity datasets, will be incorporated into our analytical models to enhance our ability to identify therapeutic biomarkers predictive of drug response.
Large numbers of primary tumours across different cancer types are being extensively genomically characterized by systematic efforts such as the International Cancer Genomics Consortium. This will give us profound insights into the molecular taxonomy of cancer and, for the first time, enable us to directly assess the genomic similarity of our cell line models to primary tumours. Based on these comparisons, we will refine and expand the cell line collection to ensure that they are as representative as possible of primary tumours. Similarly, it is increasingly clear that patient responses to therapy can be highly variable even within pre-selected populations. We intend to systematically interrogate mechanisms of intrinsic resistance to clinical drugs by enriching the cell line collection with suitable in vitro models. An additional development will be an increased emphasis on drug sensitivity screening of low passage primary cultures derived from patient tumours. Collectively, these developments should further enhance our ability to model drug response and help address the fundamental question of intrinsic resistance to clinical cancer drugs.
The expansion of the database will likely require the development of new analytical tools to identify genomic biomarkers of drug response. This will involve the development of new statistical methods to interrogate the data and is likely to include the incorporation of pathway and tissue-based analyses of drug sensitivity. Similarly, the expansion will require new tools for mining and visualizing increasingly sophisticated and complex analyses.
DISCUSSION
Here, we have presented the GDSC database as a new resource for therapeutic biomarker discovery in cancer cells. Key features of the database include the largest resource of cell line anticancer drug sensitivity data publically available. In addition, the GDSC database integrates large genomic datasets with drug sensitivity information to identify putative therapeutic biomarkers for further preclinical validation. These data are presented using simple graphical representations and all data are freely available for download. The GDSC database will undergo significant expansion in coming years as drug sensitivity and genomic datasets increase in size and complexity.
The ultimate aim of the GDSC database is to facilitate the development of new cancer therapies through the preclinical identification of therapeutic biomarkers. The current approach to development of new cancer therapies is difficult, costly and time-consuming. For example, the time taken to develop a new drug is often >10 years and costs frequently exceed 1 billion US dollars. Moreover, despite this substantial investment, the level of attrition is very high with the majority of new drugs failing during clinical trials (estimated to be between an 80–95% failure rate) due to lack of efficacy or unacceptable toxicity (11). The preclinical identification of therapeutic biomarkers could significantly improve the design and ultimate success of clinical trials by permitting smaller, quicker and less costly trials in molecularly stratified patient populations most likely to benefit from treatment. By facilitating the preclinical identification of putative therapeutic biomarkers, the GDSC database is a valuable resource to enable the development of new rationally designed cancer therapeutic strategies incorporating molecular biomarkers.
FUNDING
The Wellcome Trust [086357 to M.R.S., P.A.F., D.A.H.]; Royal College of Physicians and Surgeons of Glasgow/Cancer Research UK Clinician Scientist Fellowship (to U.M.). Funding for open access charge: Wellcome Trust.
Conflict of interest statement. None declared.
ACKNOWLEGEMENTS
We would like to thank the members of the GDSC team for advice and discussion. We also thank Prasad Gunasekaran, Mingming Jia and Paul Bevan for their technical assistance.

Comments