


Abstract
In an effort to further characterize the mechanisms of 2,3,7,8-tetrachlorodibenzo-p-dioxin (TCDD)-mediated toxicity, comprehensive temporal and dose–response microarray analyses were performed on hepatic tissue from immature ovariectomized C57BL/6 mice treated with TCDD. For temporal analysis, mice were gavaged with 30 μg/kg of TCDD or vehicle and sacrificed after 2, 4, 8, 12, 18, 24, 72, or 168 h. Dose–response mice were gavaged with 0, 0.001, 0.01, 0.1, 1, 10, 100, or 300 μg/kg of TCDD and sacrificed after 24 h. Hepatic gene expression profiles were monitored using custom cDNA microarrays containing 13,362 cDNA clones. Gene expression analysis identified 443 and 315 features which exhibited a significant change at one or more doses or time points, respectively, as determined using an empirical Bayes approach. Functional gene annotation extracted from public databases associated gene expression changes with physiological processes such as oxidative stress and metabolism, differentiation, apoptosis, gluconeogenesis, and fatty acid uptake and metabolism. Complementary histopathology (H&E and Oil Red O stains), clinical chemistry (i.e., alanine aminotransferase [ALT], triglyceride [TG], free fatty acids [FFA], cholesterol) and high-resolution gas chromatography/mass spectrometry assessment of hepatic TCDD levels were also performed in order to phenotypically anchor changes in gene expression to physiological end points. Collectively, the data support a proposed mechanism for TCDD-mediated hepatotoxicity, including fatty liver, which involves mobilization of peripheral fat and inappropriate increases in hepatic uptake of fatty acids.
INTRODUCTION
2,3,7,8-Tetrachlorodibenzo-p-dioxin (TCDD) and related compounds are legacy environmental contaminants that cause controversial human health effects at environmental levels. This class of chemicals elicits a broad spectrum of toxic and biochemical responses in a tissue-, sex-, age- and species-specific manner that include a wasting syndrome, tumor promotion, teratogenesis, hepatotoxicity, modulation of endocrine systems, immunotoxicity, and enzyme induction (Poland and Knutson, 1982). TCDD exposure in human populations has also been linked to increases in various cancers including hepatocellular carcinoma (McGregor et al., 1998). Many, if not all, of these effects are due to alterations in gene expression mediated via the activation of the aryl hydrocarbon receptor (AhR), a member of the basic-helix-loop-helix-PAS (bHLH-PAS) family (Denison and Heath-Pagliuso, 1998; Poland and Knutson, 1982). Ligand binding to the cytoplasmic AhR complex triggers the dissociation of interacting proteins and results in the subsequent translocation of the ligand-bound AhR to the nucleus, where it heterodimerizes with the aryl hydrocarbon receptor nuclear translocator (ARNT), another member of the bHLH-PAS family. This heterodimer then binds specific DNA elements, termed dioxin response elements (DREs), in the regulatory regions of target genes leading to changes in gene expression that ultimately result in the observed toxic and biochemical responses (Hankinson, 1995).
The obligatory involvement of the AhR/ARNT signaling pathway in mediating the toxic and biochemical responses to TCDD is supported by studies demonstrating that mice with low-affinity AhR alleles are less susceptible than other mice to the effects of TCDD (Okey et al., 1989), and that AhR-null mice are resistant to the prototypical toxicities of TCDD and related compounds (Gonzalez and Fernandez-Salguero, 1998; Peters et al., 1999; Vorderstrasse et al., 2001). More recent studies have shown that mice possessing mutations in the AhR nuclear localization/DRE binding domain, as well as mice harboring a hypomorphic ARNT allele, fail to exhibit the classical TCDD toxicities (Bunger et al., 2003; Walisser et al., 2004b). Furthermore, the AhR/ARNT signaling pathway plays an important role in development, differentiation, and growth, as AhR null mice experience various liver, heart, thymus, and immune system abnormalities. Developmental effects are most notable in the liver as AhR null mice exhibit reduced liver weight, transient microvesicular fatty metamorphosis, prolonged extramedullary hematopoiesis, and portal hypercellularity with thickening and fibrosis (Schmidt et al., 1996). Moreover, mice expressing a constitutively active AhR exhibit increased hepatocarcinogenesis, which has further implicated AhR activation in tumor promotion (Moennikes et al., 2004).
Although the mechanisms of AhR/ARNT-mediated changes in gene expression are fairly well established, TCDD-elicited modulation of gene expression and the pathways associated with toxicity remains poorly understood. Well-characterized AhR-inducible genes are limited to various xenobiotic-metabolizing enzymes, including cytochrome P450s 1a1, 1a2, and 1b1. However, a significant role for cytochrome P450 induction alone in the observed adverse responses is questionable (Schmidt and Bradfield, 1996). Global gene expression technologies provide a comprehensive strategy whereby critical AhR-regulated target genes can be identified and used to elucidate target pathways involved in the etiology of TCDD and related compound toxicity.
Sustained activation of the AhR and its target genes has been hypothesized as a prerequisite for toxicity that typically requires days or weeks to develop. Alternatively, activation of the AhR may initiate a cascade of secondary and tertiary gene expression changes leading to the compromised physiological state. Hepatotoxicity is a classical end point of TCDD exposure and is characterized by hepatomegaly accompanied by hepatocyte hypertrophy, fat accumulation, immune infiltration, necrosis, and alterations in liver enzymes (Pohjanvirta and Tuomisto, 1994), which likely contribute to tumor promotion and hepatocarcinogenesis. To identify gene expression changes that cause hepatotoxicity and carcinogenesis, and to further characterize the spectrum of AhR/ARNT-responsive transcripts, temporal and dose-dependent effects of TCDD on hepatic gene expression were examined in the context of complementary histological and clinical chemistry end points. This integrative approach has provided a powerful strategy in the comprehensive assessment of the in vivo effects of TCDD.
MATERIALS AND METHODS
Animal handling.
Female C57BL/6 mice, ovariectomized by the vendor on postnatal day (PND) 20 and all having body weights (BW) within 10% of the average BW, were obtained from Charles River Laboratories (Raleigh, NC) on PND day 26. This animal model is used in our lab for the research of estrogenic endocrine disruptors and was employed in the present study for consistency and to facilitate future research goals examining the estrogenic endocrine disrupting effects of TCDD. The mice were housed in polycarbonate cages containing cellulose fiber chips (Aspen Chip Laboratory Bedding, Northeastern Products, Warrensberg, NY) in a 23°C HEPA-filtered environment with 30–40% humidity and a 12 h light/dark cycle (0700 h–1900 h). Animals were allowed free access to deionized water and Harlan Teklad 22/5 Rodent Diet 8640 (Madison, WI), and acclimatized for 4 days prior to dosing. On the fourth day, animals were weighed, and a stock solution of TCDD (provided by S. Safe, Texas A&M University, College Station, TX) was diluted in sesame oil (Sigma, St. Louis, MO) to achieve the desired dose based on the average weight. All procedures were performed with the approval of the Michigan State University All-University Committee on Animal Use and Care.
Time-course and dose-response studies.
For the time-course study, mice were treated by gavage with 0.1 ml of sesame oil for a nominal dose of 0 (vehicle control) or 30 μg/kg bw of TCDD. Eight animals were treated per dose group and time point, and groups for each dose and time point were housed in separate cages. Mice were sacrificed 2, 4, 8, 12, 18, 24, 72, or 168 h after dosing. An untreated group of mice was also included, and it was sacrificed at time zero, the time at which the other animals were dosed. For the dose-response study, five mice per group were gavaged with 0.1 ml of vehicle or 0.001, 0.01, 0.1, 1, 10, 100, or 300 μg/kg TCDD and sacrificed 24 h after dosing. In both studies, treatment was staggered to ensure that the exposure duration was within 5% of the desired length. Animals were sacrificed by cervical dislocation and tissue samples were removed, weighed, flash frozen in liquid nitrogen, and stored at −80°C until further use. For the dose-response study, the right lobe of the liver was fixed in 10% neutral buffered formalin (Sigma), for histological analysis.
Clinical chemistry and histological analyses.
Mice were gavaged with 0 (vehicle control) or 30 μg/kg bw of TCDD and were sacrificed 2, 4, 8, 12, 18, 24, 72, or 168 h after dosing. At sacrifice, mice were anesthetized with 0.1 ml of a 5% solution of sodium-pentobarbital, and blood was collected by cardiac puncture and placed in Vacutainer SST gel and clot activator tubes (Becton Dickinson, Franklin Lakes, NJ). Samples were allowed to clot, and serum was separated by spinning at 1500 × g for 10 min, after which the samples were stored at −80°C until analysis. Because sampling was limited, only select clinical chemistry end points were monitored: blood urea nitrogen (BUN), creatinine (CREA), free fatty acids (FFA), glucose (GLU), total bilirubin (TBIL), alanine aminotransferase (ALT), cholesterol (CHOL), and triglycerides (TG). End points were monitored by standard clinical chemistry assays with an Olympus AU640 Automated Chemistry Analyzer (Olympus America Inc., Melville, NY) at the Clinical Pathology Laboratory at MSU (http://cvm.msu.edu/clinpath/new.htm).
Tissues were harvested and fixed in 10% neutral buffered formalin (NBF, Sigma). Sectioned tissues were processed sequentially in ethanol, xylene, and paraffin in a Thermo Electron Excelsior tissue processor (Waltham, MA). Tissues were then embedded in paraffin with a Miles Tissue Tek II embedding center, after which paraffin blocks were sectioned at 5 μm with a rotary microtome. Sections were placed on glass microscope slides, dried, and stained with the standard hematoxylin and eosin stain. All histological processing was performed at the Histology Laboratory at MSU (http://www.lahms.msu.edu). Histological evaluations were preformed by a veterinary pathologist. For Oil Red O staining, liver cryosections were fixed in NBF, stained with Oil Red O solution, washed, and counterstained with hematoxylin.
Quantification of TCDD in liver samples.
Liver samples were processed in parallel with lab blanks and a reference or background sample at Wellington Laboratories Inc. (Guelph, ON, Canada). Samples were weighed, spiked with 13C12 TCDD surrogate, digested with sulfuric acid, and then extracted. Extracts were cleaned, concentrated, and spiked with an injection standard. Analysis was performed on a high resolution gas chromatograph/high resolution mass spectrometer (HRGC/HRMS) using a Hewlett Packard 5890 Series II GC interfaced to a VG 70SE HRMS. The HRMS was operated in the EI/SIR mode at 10,000 resolution. A 60-m DB5 column (J&W Scientific, Folsom, CA) with an internal diameter of 0.25 mm and film thickness of 0.25 μm was employed. Injection volumes were 2 μl and a splitless injection was used.
RNA isolation.
Frozen liver samples (approximately 70 mg) were transferred to 1.0 ml of Trizol (Invitrogen, Carlsbad, CA) and homogenized in a Mixer Mill 300 tissue homogenizer (Retsch, Germany). Total RNA was isolated according to the manufacturer's protocol with an additional phenol:chloroform extraction. Isolated RNA was resuspended in RNA storage solution (Ambion Inc., Austin, TX), quantified (A260), and assessed for purity by determining the A260/A280 ratio and by visual inspection of 1.0 μg on a denaturing gel.
Microarray experimental design.
Changes in gene expression were assessed using customized cDNA microarrays containing 13,362 features representing 7952 unique genes (Unigene build #144; see Supplementary Data of the Supplementary Material online). For temporal analysis, TCDD-treated samples were compared to time-matched vehicle controls with an independent reference design. In this design, a treated animal is compared to a time-matched vehicle control with two independent labelings per sample (dye swap) for a total of 16 arrays per replicate (8 time points × 2 arrays/time point comparison). Four replicates of this design were performed, each using different animals, for a total of four biological replicates and 64 arrays.
Dose–response changes in gene expression were analyzed using a common reference design in which samples from TCDD-treated mice are co-hybridized with a common vehicle control. Each design replicate uses one of the five animals from each dose group, with two independent labelings per sample (dye swap) for a total of 14 arrays (7 doses × 2 arrays/dose comparison). Four replicates of this design were performed, each using different animals, for a total of four biological replicates and 56 microarrays.
Microarray analysis of differential gene expression.
Detailed protocols for microarray preparation, labeling of the cDNA probe, sample hybridization, and washing can be found at http://dbzach.fst.msu.edu/interfaces/microarray.html. Briefly, polymerase chain reaction (PCR) amplified DNA was robotically arrayed onto epoxy-coated glass slides (Schott-Nexterion, Duryea, PA) using an Omnigrid arrayer (GeneMachines, San Carlos, CA) equipped with 48 (4 × 12) Chipmaker 2 pins (Telechem) at the Genomics Technology Support Facility (http://www.genomics.msu.edu). Total RNA (30 μg) was reverse transcribed in the presence of Cy3- or Cy5-deoxyuridine triphosphate (dUTP) to create fluor-labeled cDNA, which was purified using a Qiagen polymerase chain reaction (PCR) purification kit (Qiagen, Valencia, CA). Cy3 and Cy5 samples were mixed, vacuum dried, and resuspended in 48 μl of hybridization buffer (40% formamide, 4× SSC, 1% sodium dodecyl sulfate [SDS]) with 20 μg polydA and 20 μg of mouse COT-1 DNA (Invitrogen, Carlsbad, CA) as competitor. This probe mixture was heated at 95°C for 3 min and hybridized on the array under a 22 × 40 mm lifterslip (Erie Scientific Company, Portsmouth, NH) in a light-protected and humidified hybridization chamber (Corning Inc., Corning, NY) for 18–24 h in a 42°C water bath. Slides were then washed, dried by centrifugation, and scanned at 635 nm (Cy5) and 532 nm (Cy3) on an Affymetrix 428 Array Scanner (Santa Clara, CA). Images were analyzed for feature and background intensities using GenePix Pro 5.0 (Molecular Devices, Union City, CA).
Microarray data normalization and analysis.
Data were normalized using a semiparametric approach (Eckel et al., 2004b). Model-based t-values were calculated from normalized data, comparing treated and vehicle responses per time point or dose group. Empirical Bayes analysis was used to calculate posterior probabilities (P1(t)-value) of activity on a per gene and time-point or dose-group basis using the model-based t-value (Eckel et al., 2004a). A stringent P1(t) cutoff of 1.0 was used to obtain a subset of differentially regulated genes to initially focus analysis and data interpretation on the most reproducible differentially regulated genes,. Gene expression changes that passed the threshold were subsequently analyzed by hierarchical and K-means clustering (GeneSpring 6.0, Silicon Genetics, Redwood City, CA). Dose–response analysis was performed with Graph Pad Prism 4.0 (GraphPad Software, San Diego, CA). The P1(t) value is a Bayesian posterior probability that is different from the p value in that it can be used to provide an initial ranking of genes, based on their expression, in order to prioritize those transcripts for further investigation relative to biologic/toxic relevance. It is only a guide to rank the probability of identifying the most active genes, and is not equivalent to a p value. Therefore, it is not intended to be used for hypothesis testing. Posterior probabilities generated by Bayesian analyses are better suited for microarray data when compared to parametric analyses since no assumptions are required regarding the distribution of the gene expression data, which typically are not normally distributed. Consequently, gene expression changes that approach the initial P1(t) cutoff will also be considered, provided supporting published evidence indicates its relevance in the emerging pathway. These genes would also be candidates for verification by quantitative RT-PCR (QRTPC).
Quantitative real-time PCR.
For each sample, 1.0 μg of total RNA was reverse transcribed by SuperScript II using an anchored oligo-dT primer as described by the manufacturer (Invitrogen, Carlsbad, CA). The cDNA (1.0μl) was used as a template in a 30 μl PCR reaction containing 0.1μM of forward and reverse gene-specific primers designed using Primer3 (Rozen and Skaletsky, 2000), 3 mM MgCl2, 1.0 mM dNTPs, 0.025 IU AmpliTaq Gold, and 1× SYBR Green PCR buffer (Applied Biosystems, Foster City, CA). Gene names, accession numbers, forward and reverse primer sequences, and amplicon sizes are listed in Supplementary Data of the Supplementary Material online. Polymerase chain reaction amplification was conducted in MicroAmp Optical 96-well reaction plates (Applied Biosystems) on an Applied Biosystems PRISM 7000 Sequence Detection System under the following conditions: initial denaturation and enzyme activation for 10 min at 95°C, followed by 40 cycles of 95°C for 15 s and 60°C for 1 min. A dissociation protocol was performed to assess the specificity of the primers and the uniformity of the PCR-generated products. Each plate contained duplicate standards of purified PCR products of known template concentration covering 7 orders of magnitude to interpolate relative template concentrations of the samples from the standard curves of log copy number versus threshold cycle (Ct). No template controls (NTC) were also included on each plate. Samples with a Ct value within 2 SD of the mean Ct values for the NTCs were considered below the limits of detection. The copy number of each unknown sample for each gene was standardized to the geometric mean of three house-keeping genes (β-actin, Gapd, and Hprt) to control for differences in RNA loading, quality, and cDNA synthesis. For graphing purposes, the relative expression levels were scaled such that the expression level of the time-matched control group was equal to 1.
Statistical analysis.
Statistical analysis was performed with SAS 8.02 (SAS Institute, Cary, NC). Data were analyzed by analysis of variance (ANOVA) followed by Dunnett's or Tukey's post hoc tests. Differences between treatment groups were considered significant when p < 0.05.
RESULTS
Organ and Body Weights
TCDD treatment resulted in a significant (p < 0.05) dose-dependent increase in relative liver weights at 100 and 300 μg/kg (Table 1). In the time-course study, relative liver weights were significantly (p < 0.05) increased at 24, 72, and 168 h, with maximal increases observed at 168 h (Table 2). No additional significant treatment-related alterations in organ weights were noted in either study. Although wasting syndrome is a hallmark of TCDD toxicity, no effects on body weight or body weight gain were noted at any of the doses or time points in either study when compared to time-matched controls. These results are consistent with a recent study that reported increases in liver weights but no alterations in body weights after a single oral dose of TCDD at concentrations up to 200 μg/kg (Fletcher et al., 2001).
Terminal Body, Whole Liver, and Relative Liver Weights for Mice Treated with Vehicle or Increasing Doses of TCDD and Sacrificed After 24 Hours
Dosea | Treatment | Body weight (g) | Liver weight (g) | RLWb |
|---|---|---|---|---|
| 0 | Vehicle | 14.52 ± 1.27 | 0.864 ± 0.112 | 0.059 ± 0.003 |
| 0.001 | TCDD | 15.88 ± 1.37 | 0.972 ± 0.246 | 0.061 ± 0.004 |
| 0.01 | TCDD | 15.24 ± 1.71 | 0.921 ± 0.092 | 0.061 ± 0.010 |
| 0.1 | TCDD | 14.94 ± 1.24 | 0.891 ± 0.036 | 0.060 ± 0.005 |
| 1 | TCDD | 15.30 ± 1.02 | 0.967 ± 0.122 | 0.063 ± 0.005 |
| 10 | TCDD | 14.72 ± 1.13 | 0.962 ± 0.111 | 0.065 ± 0.004 |
| 100 | TCDD | 15.46 ± 0.48 | 1.042 ± 0.076 | 0.067 ± 0.003* |
| 300 | TCDD | 15.14 ± 0.91 | 1.002 ± 0.109 | 0.067 ± 0.004* |
Note. Averages ± SD.
All doses in μg/kg.
RLW = relative liver weight.
p < 0.05.
Terminal Body, Whole Liver and Relative Liver Weights for Mice Treated with Vehicle or 30 μg/kg of TCDD
Sacrifice time (h) | Treatment | Body weight (g) | Liver weight (g) | RLWa |
|---|---|---|---|---|
| 2 | Vehicle | 12.58 ± 1.61 | 0.753 ± 0.127 | 0.059 ± 0.004 |
| TCDD | 12.23 ± 1.31 | 0.722 ± 0.136 | 0.059 ± 0.005 | |
| 4 | Vehicle | 12.25 ± 1.49 | 0.718 ± 0.115 | 0.058 ± 0.003 |
| TCDD | 12.16 ± 1.48 | 0.652 ± 0.0.86 | 0.054 ± 0.004 | |
| 8 | Vehicle | 12.31 ± 1.65 | 0.618 ± 0.093 | 0.050 ± 0.004 |
| TCDD | 12.50 ± 1.70 | 0.655 ± 0.109 | 0.052 ± 0.003 | |
| 12 | Vehicle | 12.64 ± 1.26 | 0.687 ± 0.084 | 0.054 ± 0.004 |
| TCDD | 12.97 ± 0.79 | 0.741 ± 0.060 | 0.057 ± 0.006 | |
| 18 | Vehicle | 13.86 ± 1.56 | 0.844 ± 0.109 | 0.060 ± 0.005 |
| TCDD | 13.33 ± 1.67 | 0.830 ± 0.165 | 0.062 ± 0.006 | |
| 24 | Vehicle | 13.11 ± 1.63 | 0.816 ± 0.100 | 0.062 ± 0.003 |
| TCDD | 12.54 ± 1.43 | 0.879 ± 0.112 | 0.070 ± 0.003* | |
| 72 | Vehicle | 14.44 ± 1.58 | 0.858 ± 0.127 | 0.058 ± 0.009 |
| TCDD | 14.00 ± 1.97 | 1.061 ± 0.209 | 0.075 ± 0.007* | |
| 168 | Vehicle | 15.89 ± 1.51 | 0.974 ± 0.139 | 0.060 ± 0.004 |
| TCDD | 15.53 ± 1.84 | 1.262 ± 0.212 | 0.081 ± 0.006* |
Note. Averages ± SD.
RLW = relative liver weight.
p < 0.05.
Hepatic TCDD Concentrations
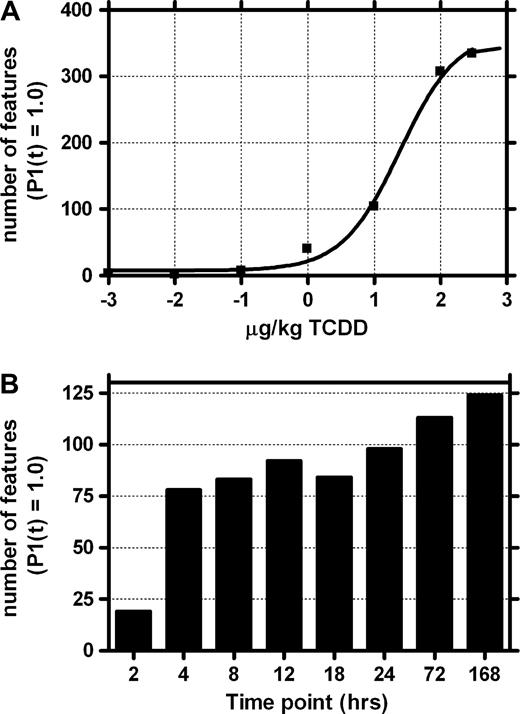
Hepatic TCDD levels were determined in dose-response and time-course studies in order to relate tissue concentrations to molecular responses. TCDD levels were significantly (p < 0.05) increased in a dose-dependent manner at doses as low as 0.1 μg/kg (Fig. 1A). In the time-course study, significant (p < 0.05) increases in hepatic TCDD content were noted at all time points, with a gradual increase between 2 and 72 h, followed by a 60% decrease at 168 h (Fig. 1B). Hepatic TCDD levels in this study are comparable to other reports with similar exposure regimens. For example, acute administration of 1 μg/kg to rats resulted in 7,000 ppt TCDD in the liver after 24 h (Hurst et al., 2000), comparable to 5100 ppt in this study. Similarly, 54,000 ppt TCDD was detected in the mouse liver at 7 days after acute administration of 10 μg/kg (Diliberto et al., 1995), while we report 154,000 ppt TCDD 7 days after a 30 μg/kg dose. Moreover, a recent 13-week subchronic National Toxicology Program study reported that mice dosed with 0.1 μg/kg/day 5 days/week achieved hepatic TCDD levels of 18,300 ppt (Vezina et al., 2004), a value within the range of this study. The accurate determination of hepatic TCDD levels is essential to elucidate correlations between gene expression and physiological effects across studies, and to comparatively assess hepatic accumulation and clearance of TCDD between species, as there are significant species differences in the half-life of TCDD.
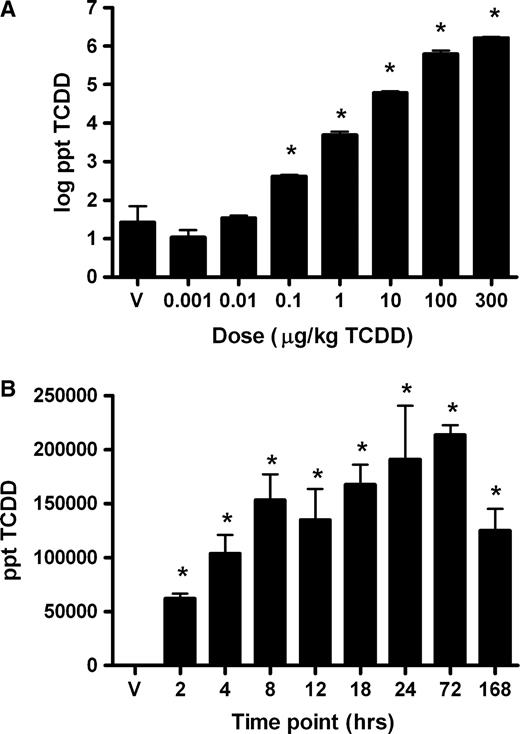
TCDD concentrations in hepatic tissue of mice from both dose-response (A) and time-response (B) studies determined using HRGC/HRMS. Dose-response concentrations are displayed on a log scale to allow for visualization of tissue concentrations at all doses. All results are displayed as the mean ± standard error of at least three independent samples. ppt = parts per trillion (equivalent to pg/g), *p < 0.05.
Histological End Points
In the dose–response study, the principle TCDD-related alteration was a minimal to moderate cytoplasmic vacuolization of hepatocytes primarily in the periportal and midzonal regions of the liver. This effect was absent or minimal in mice from the 0.001–0.1 μg/kg groups, whereas in mice from the 1–300 μg/kg dose groups, mild to moderate cytoplasmic vacuolization was consistently observed.
In the time-course study, cytoplasmic vacuolization was observed in the periportal and midzonal regions with extension into the centriacinar regions at later time points. Minimal vacuolization was first observed at 18 h, with severity progressing from mild to moderate at 24 and 72 h, respectively. Marked cytoplasmic vacuolization was noted at 168 h and was accompanied by individual cell apoptosis and immune cell accumulation (Fig. 2A and 2B). Oil Red O staining confirmed that the dose- and time-dependent vacuolization was due to lipid accumulation (Fig. 2C and 2D). Analysis of liver lipid extracts by thin layer chromatography revealed increases in triglycerides (TG), free fatty acids (FFA), and cholesterol esters (CHOL) in TCDD-treated mice (data not shown).
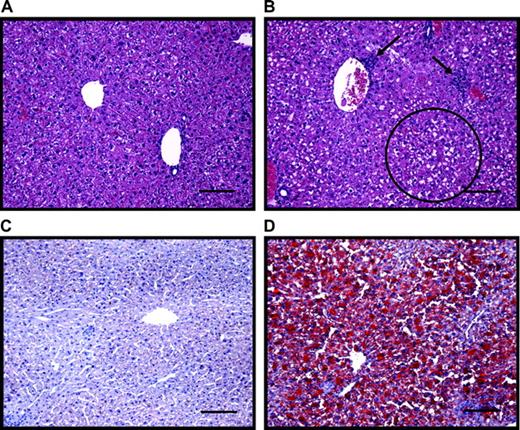
Liver histology from control and TCDD-treated mice at the 168-h time point. A and B are H&E stains from a control and TCDD-treated mouse, respectively. Arrows indicate immune cell accumulation; the circle highlights an area of extensive vacuolization. C and D are Oil Red O stains from a control and TCDD-treated mouse, respectively. Red-staining areas denote fat accumulation; bars = 10 μm.
Clinical Chemistry
Significant treatment-related alterations were noted in serum alanine aminotransferase (ALT), CHOL, FFA, and TG (Fig. 3). The ALT levels increased steadily after 24 h to a maximum of 2.6-fold at 168 h, indicative of mild liver injury in TCDD-treated mice. Serum cholesterol was significantly (p < 0.05) decreased by 33% and 28% at 72 and 168 h, respectively. Serum FFA were increased 33%, 16%, and 28% at 24, 72, and 168 h, respectively. Triglyceride levels were also elevated by 24%, 15%, and 40% in TCDD-treated mice at 24, 72, and 168 h, respectively. No significant treatment-related effects were noted on serum BUN, CREA, GLU, or TBIL.
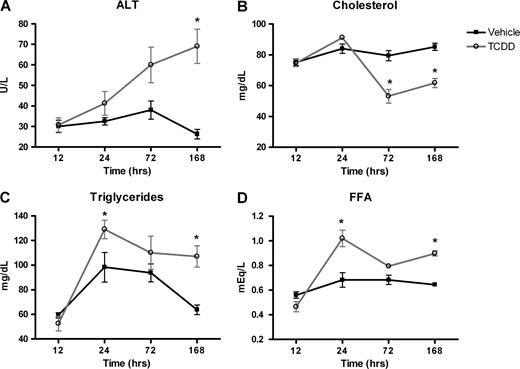
Serum clinical chemistry values of significantly affected end points after treatment with vehicle (squares) or 30 μg/kg TCDD (circles) for 12, 24, 72, or 168 h. Triglycerides (A), cholesterol (B), alanine aminotransferse (ALT; C), and free fatty acids (FFA; D). There were no significant treatment effects on serum BUN, CREA, GLU, or TBIL. Results represent the mean ± standard error of at least three independent samples. *p < 0.05.
Microarray Data Filtering
Empirical Bayesian analysis of the dose-response data identified 443 microarray features representing 374 annotated clones and 349 unique genes, which were differentially expressed (P1(t) = 1.0), relative to vehicle controls, at one or more doses. A dose-dependent increase in the number of active genes began to plateau at 100 and 300 μg/kg TCDD (Fig. 4A). Based on these results, a dose of 30 μg/kg was chosen for temporal studies, because it represents the approximate ED50 for overall gene responses and would avoid overt toxicity and lethality in a longer term study. Analysis of the time-course data identified 315 microarray features representing 269 annotated clones corresponding to 255 unique genes, which were differentially expressed (P1(t) = 1.0), relative to the time-matched vehicle controls at one or more time points. The 2-h time point displayed the fewest number of active genes, followed by a large increase at 4 h, which was largely stable through 18 h and followed by an additional increase between 24 and 168 h (Fig. 4B). This temporal pattern indicates that a majority of the gene expression responses are preceding the observed histological alterations. In addition, the later increases in active features coincide with the appearance and severity of hepatotoxicity, indicating that these responses may be a result of the emerging toxicity. The gene lists obtained from these initial stringent filtering criteria were used for data clustering, organization, and the identification of functional pathways affected by TCDD. Complete data sets for both dose-response and time-course experiments are available in Supplementary Data and Supplementary Data, respectively, of the Supplementary Material online.
Number of features exhibiting significant changes in gene expression for dose-response (A) and temporal (B) microarray studies (P1(t) = 1.0). The dose-response study revealed a dose-dependent increase in the number of active features, which maximized at 100 and 300 μg/kg. The temporal study displayed a large increase at 4 h, followed by a consistent increase in the number of active genes with time.
Of the 98 active genes identified by these criteria in the time-course study at 24 h, 83 also exhibited active dose-dependent responses. Although the dose used in the time course study (30 μg/kg) was not included in the dose-response study, comparison of responses from flanking doses (10 and 100 μg/kg) indicated that there was a good agreement in the magnitude of the responses between these studies. For example, Notch1, Nqo1, and peroxisomal acyl-CoA thioesterase 2A (Pte2a) were induced 3.1-, 3.1-, and 3.0-fold, respectively, in the time-course study and 3.4-, 3.3-, and 2.6-fold at 100 μg/kg in the dose-response study. Similarly, carbonic anhydrase 3 (Car3), glutamate oxaloacetate transaminase 1 (Got1), and torsin family 3, member A (Tor3a) exhibited −2.7-fold, −2.3-fold, and −2.1-fold repression in the time-course study and −2.3-fold, −2.4-fold, and −2.5-fold repression at 100 μg/kg in the dose-response study, respectively. These results indicate the reproducibility of the gene expression responses in independent microarray experiments.
Data Clustering
Hierarchical clustering of the dose-response data by treatment revealed a strong concord between gene expression responses and the administered dose of TCDD (Fig. 5A). The two low-dose groups clustered together, as did the five highest doses. The high-dose cluster also branched out sequentially by dose, with the top dose of 300 μg/kg exhibiting the greatest difference from low-dose groups, as expected. Three K-means clusters, one downregulated cluster and two up-regulated clusters, most accurately represented the dose-response data (data not shown). The existence of two upregulated clusters for the dose-response data indicates that TCDD elicits gene-specific dose-dependent responses. For example, genes such as Cyp1a2, phosphoenolpyruvate carboxykinase 1 (Pck1), and Got1 displayed similar ED50 values to that of Cyp1a1 (0.37–0.95 μg/kg). The ED50 values for Notch gene homolog 1 (Notch1) and NAD(P)H dehydrogenase, quinone 1 (Nqo1) induction were an order of magnitude greater (2.17–8.8 μg/kg), whereas tumor necrosis factor, alpha-induced protein 2 (Tnfaip2), and Cyp1b1 were two orders of magnitude greater (28–39.5 μg/kg) (Fig. 6). These results may be due to gene-specific thresholds, differential temporal regulation, or differing basal expression levels, which would affect the dose at which transcriptional regulation may be initiated or detected.
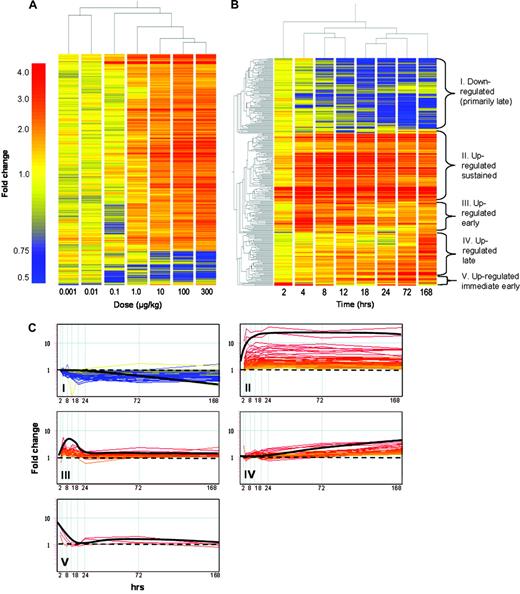
Hierarchical clustering of active gene lists for dose-response (A) and temporal (B) microarray studies. Similar temporal clusters were identified empirically using K-means clustering (C) and were classified into downregulated (primarily late; I), upregulated sustained (across time course; II), upregulated early (4–12 h; III), upregulated late (24–168 h; IV), or upregulated immediate early (2 h; V).
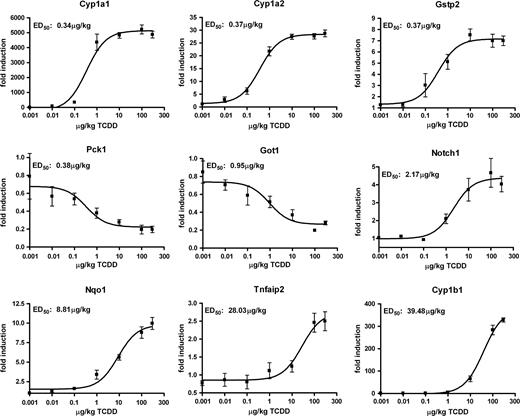
Quantitative RT-PCR verification of select dose-dependent gene expression responses. The same RNA used for cDNA microarray analysis was examined by QRTPCR. The y-axis represents the fold-change calculated relative to time-matched vehicle controls; the x-axis represents the dose groups. Data points represent the fold-change ± standard error of at least four independent samples. Dose-response curves and ED50 values for QRTPCR data were generated in Graph Pad 4.0 using non-linear regression dose-response analysis. Genes are indicated by official gene symbols.
Hierarchical clustering of temporal data by experimental time points identified three primary branches. The 2 h time point clustered alone, and the remaining time points clustered into early (4, 8, and 12 h) and late (18, 24, 72, and 168 h) responsive groups (Fig. 5B). Both hierarchical and K-means clustering revealed distinctive gene expression patterns across time including downregulated (primarily late; I), up-regulated sustained (across time course; II), upregulated early (4–12 h; III), upregulated late (24–168 h; IV), and upregulated immediate early (2 h; V) (Fig. 5B and 5C). These patterns reflect the complex transcriptional hepatic response to TCDD, which involves induction and repression as well as early and late responses.
Functional Categorization of Microarray Data
Functional annotation extracted from public databases revealed that many of the transcriptional responses were associated with metabolizing enzymes, development and differentiation, fatty acid uptake and metabolism, gluconeogenesis, immune signaling, and apoptosis (Table 3). Metabolizing enzymes included oxidoreductases, monooxygenases, and xenobiotic metabolizing enzymes such as the well-characterized TCDD-inducible genes Cyp1a1 and Nqo1. Novel responsive oxidoreductase and xenobiotic metabolizing genes included abhydrolase domain containing 6 (Abhd6), carbonyl reductase 3 (Cbr3), dehydrogenase/reductase (SDR family) member 3 (Dhrs3), epoxide hydrolase 1 (Ephx1), and UDP-glucose dehydrogenase (Ugdh). Glutathione S-transferases alpha2, alpha4, and pi2 (Gsta2, a4, and p2) as well as glutamate-cysteine ligase (Gclc) and glutathione synthetase (Gss) were also regulated by TCDD, which is consistent with the induction of both phase I and II metabolizing enzymes by TCDD, commonly referred to as the “AhR gene battery.”
Functional Categorization and Temporal Regulation of Select Hepatic Genes Identified as Differentially Regulated in Response to TCDD
Functional category | Accession | Locus link | Gene name | Gene symbol | Regulation | Fold- changea | Time points (h)b | Clusterc | DREd |
|---|---|---|---|---|---|---|---|---|---|
| Metabolizing enzymes | W34507 | 66082 | Abhydrolase domain containing 6 | Abhd6 | ▴ | 3 | 4–168 | II | Yes |
| AA710940 | 14870 | Glutathione S-transferase, pi 2 | Gstp2 | ▴ | 2.5 | 8,12,24,168 | II | Yes | |
| AA067191 | 22235 | UDP-glucose dehydrogenase | Ugdh | ▴ | 3 | 2–168 | II | Yes | |
| AA472074 | 22436 | Xanthine dehydrogenase | Xdh | ▴ | 3 | 4–168 | II | Yes | |
| W29265 | 14858 | Glutathione S-transferase, alpha 2 (Yc2) | Gsta2 | ▴ | 7 | 12–168 | II | No | |
| BG062989 | 14629 | Glutamate-cysteine ligase, catalytic subunit | Gclc | ▴ | 2 | 4,8,12,24,72,168 | II | No | |
| BG072453 | 13849 | Epoxide hydrolase 1, microsomal | Ephx1 | ▴ | 2 | 4–72 | II | Yes | |
| NM_009992 | 13076 | Cytochrome P450, family 1, subfamily a1 | Cyp1a1 | ▴ | 40 | 2–168 | II | Yes | |
| BE623489 | 18104 | NAD(P)H dehydrogenase, quinone 1 | Nqo1 | ▴ | 5 | 4–168 | II | Yes | |
| AK003232 | 109857 | Carbonyl reductase 3 | Cbr3 | ▴ | 2.5 | 8,12,18,72 | II | Yes | |
| BE457542 | 20148 | Dehydrogenase/reductase (SDR family) member 3 | Dhrs3 | ▴ | 2 | 4–168 | II | Yes | |
| W54349 | 14860 | Glutathione S-transferase, alpha 4 | Gsta4 | ▴ | 2 | 12–168 | IV | Yes | |
| Development/differentiation | W84211 | 14451 | Growth arrest specific 1 | Gas1 | ▾ | −2 | 4,8,18,24,72,168 | I | Yes |
| W98998 | 18128 | Notch gene homolog 1 (Drosophila) | Notch1 | ▴ | 3.5 | 2–68 | II | Yes | |
| AA009268 | 17869 | Myelocytomatosis oncogene | Myc | ▴ | 4 | 4,12,18,24,168 | III | Yes | |
| BG065761 | 21928 | Tumor necrosis factor, alpha-induced protein 2 | Tnfaip2 | ▴ | 5.5 | 2–168 | III | Yes | |
| BE951829 | 55927 | Hairy and enhancer of split 6 (Drosophila) | Hes6 | ▴ | 2 | 168 | IV | Yes | |
| BB025141 | 14673 | Guanine nucleotide binding protein, alpha 12 | Gna12 | ▴ | 1.5 | 12,24,72,168 | IV | Yes | |
| NM_008655 | 17873 | Growth arrest and DNA-damage-inducible 45 beta | Gadd45b | ▴ | 5 | 2,4,8,24,72 | V | Yes | |
| Fatty acid uptake/ metabolism | AA032375 | 11806 | Apolipoprotein A-I | Apoa1 | ▾ | −2.5 | 18–168 | I | Yes |
| BG063838 | 14104 | Fatty acid synthase | Fasn | ▾ | −2 | 72, 168 | I | No | |
| BG066626 | 64898 | Lipin 2 | Lpin2 | ▴ | 3 | 4, 12, 24, 72 | II | Yes | |
| XM_130363 | 14725 | Low density lipoprotein receptor-related protein 2 | Lrp2 | ▴ | 3 | 4–168 | II | Yes | |
| AJ223958 | 26458 | Solute carrier family 27 (fatty acid transporter) 2 | Slc27a2 | ▴ | 2 | 8–168 | II | No | |
| BC002008 | 16592 | Fatty acid binding protein 5, epidermal | Fabp5 | ▴ | 4 | 8,12,18,72,168 | III | Yes | |
| AA458178 | 12491 | CD36 antigen | Cd36 | ▴ | 3.5 | 18–168 | IV | No | |
| BG063416 | 16956 | Lipoprotein lipase | Lpl | ▴ | 3.5 | 18,72,168 | IV | Yes | |
| Gluconeogenesis | W41175 | 14571 | Glycerol phosphate dehydrogenase 2, mitochondrial | Gpd2 | ▾ | −2.5 | 4–68 | I | Yes |
| AA014441 | 103988 | Glucokinase | Gck | ▾ | −2.5 | 12,24 | I | Yes | |
| BG064771 | 26384 | Glucosamine-6-phosphate deaminase 1 | Gnpda1 | ▾ | −1.5 | 4,18,72,168 | I | No | |
| BG066689 | 14718 | glutamate oxaloacetate transaminase 1, soluble | Got1 | ▾ | −2.5 | 8–168 | I | Yes | |
| NM_011044 | 18534 | Phosphoenolpyruvate carboxykinase 1, cytosolic | Pck1 | ▾ | −2.5 | 18, 24 | I | Yes | |
| Apoptosis | AI506719 | 215114 | Huntingtin interacting protein 1 | Hip1 | ▴ | 2 | 4–168 | II | Yes |
| AA269857 | 19766 | Receptor (TNFRSF)-interacting serine-threonine kinase 1 | Ripk1 | ▴ | 4.5 | 12–168 | IV | No | |
| AA711151 | 12125 | BCL2-like 11 (apoptosis facilitator) | Bcl2l11 | ▴ | 1.5 | 12–168 | IV | No | |
| BG076240 | 12368 | Caspase 6 | Casp6 | ▴ | 2 | 24–168 | IV | Yes | |
| Immune response | AA273296 | 12505 | CD44 antigen | Cd44 | ▴ | 2 | 168 | IV | No |
| AA419750 | 16149 | Ia-associated invariant chain | Ii | ▴ | 3 | 168 | IV | No | |
| AA145865 | 110454 | Lymphocyte antigen 6 complex, locus A | Ly6a | ▴ | 2.5 | 72,168 | IV | No | |
| AA175329 | 14961 | Histocompatibility 2, class II antigen A, beta 1 | H2-Ab1 | ▴ | 3 | 168 | IV | No | |
| BG063553 | 14969 | Histocompatibility 2, class II antigen E beta | H2-Eb1 | ▴ | 3.5 | 168 | IV | No |
Induction or repression as determined by microarray analysis.
Significant at P1(t) > 0.99.
Cluster designations as in Figure 4.
DRE identified in −1500 to +1500 of the transcriptional start site (TSS).
Genes involved in development and differentiation were also induced or repressed in response to TCDD treatment, including Notch1, tumor necrosis factor, alpha-induced protein 2 (Tnfaip2), hairy and enhancer of split 6 (Hes6), growth arrest and DNA-damage-inducible 45 beta (Gadd45b), and growth arrest specific 1 (Gas1), all of which have not been previously reported to be regulated by TCDD. Aryl hydrocarbon receptor–mediated dysregulation of these genes may play a role in mediating the effects of TCDD on cellular differentiation or in AhR signaling, which has been implicated in the differentiation and development of various organ systems. TCDD also repressed transcripts encoding enzymes involved in gluconeogenesis including Pck1, which has been previously reported (Stahl et al., 1992). In addition, Got1 and glycerol phosphate dehydrogenase 2 (Gpd2), two additional enzymes involved in the gluconeogenic pathway, were also downregulated. These results suggest that TCDD may affect multiple steps in gluconeogenesis, although clinical chemistry did not detect any alterations in circulating glucose.
Effects on fatty acid uptake and metabolism, immune signaling, and apoptosis are consistent with the observed hepatic histological findings. Hematoxylin and eosin and Oil Red O staining revealed marked fatty vacuolization of hepatocytes at 24 h, with maximal effects at 168 h. Numerous genes involved in fatty acid transport, including fatty acid binding protein 4 and 5 (Fabp4 and 5), CD36 antigen (Cd36), solute carrier family 27, member 2 (Slc27a2), and lipoprotein lipase (Lpl) were significantly induced and may mediate the fatty accumulation. Induced apoptotic genes included receptor tumor necrosis factor rabbit primary synovial fibroblast (TNFRSF)-interacting serine-threonine kinase 1 (Ripk1), caspase 6 (Casp6), BCL2-like 11 (Bcl2l11), and huntingtin interacting protein 1 (Hip1), which is also consistent with the histopathologic identification of hepatocyte apoptosis at 168 h. In general, these gene expression responses preceded or paralleled the observed histopathology for each functional category. In contrast, the induction of immune signaling genes was largely confined to 168 h coincident with the histology. Consequently, these gene expression changes are likely due to the infiltration of immune cells and not to changes in hepatocyte gene expression. Moreover, all functional categories included genes in each of the five identified clusters of upregulated immediate early, early, late, and sustained, as well as downregulated responses. The exceptions were the TCDD-elicited changes in gluconeogenesis and immune signaling, which were primarily represented by downregulated and upregulated late clusters, respectively.
Verification of Microarray Responses
Qualitative RT-PCR was used to verify changes in transcript levels for a selected subset of active genes representing different responses and functional categories in Table 3 (Fig. 7). In total, 24 genes were verified by QRTPCR, all of which displayed temporal expression patterns comparable with the microarray data (See Supplementary Data of the Supplementary Material online for a complete list of genes). For genes such as Myc, Tnfaip2, Fabp5, and Cd36, there was also good agreement in the magnitude of the fold-change when comparing microarray and QRTPCR data. However, microarray data compression was evident for Cyp1a1 and Gstp2 due to the smaller dynamic fluorescence intensity range (0–65,535) of the microarrays, which resulted in signal saturation for these genes and compression of the true induction. Cross hybridization of homologous probes to a given target sequence on the microarray may also be a contributing factor, especially when in comparison to other, more gene-specific measurement techniques (Yuen et al., 2002).
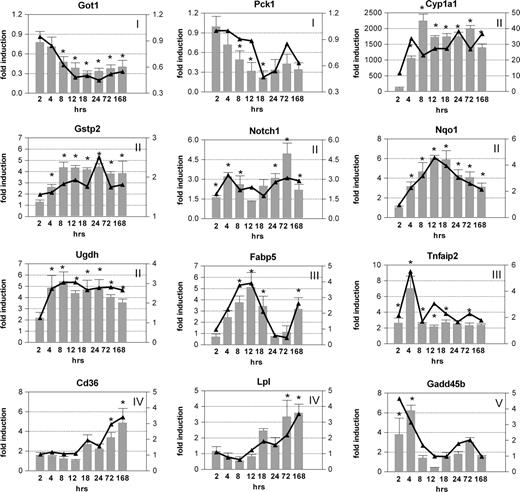
Quantitative real-time PCR verification of temporal microarray results. The same RNA used for cDNA microarray analysis was examined by QRTPCR. All fold-changes were calculated relative to time-matched vehicle controls. Bars (left axis) and lines (right axis) represent data obtained by QRTPCR and cDNA microarrays, respectively; the x-axis represents the time points. Genes are indicated by official gene symbols, and results are the average of four biological replicates. Numbers indicate respective clusters as illustrated in Figure 4B and C. Error bars represent the SEM for the average fold-change. *p < 0.05 for QRTPCR.
Identification of Putative DREs in Responsive Genes
Genomic sequence (−1500 to +1500 relative to the transcriptional start site [TSS]) for genes represented in Table 3 were also examined for the presence of putative DREs, which were identified by computational scanning (Sun et al., 2004). Tentative functionality was assessed by comparing matrix similarity scores calculated using a position weight matrix (PWM) developed using sequences from bona fide functional DREs. Of the 42 TCDD-regulated genes listed in Table 2, 28 contained putative DREs within this region (Supplementary Data and Supplementary Data of the Supplementary Material online). Bach, Cbr3, Dhrs3, Gadd45b, Myc, and Ugdh all possessed high-scoring DREs within this region and displayed an early induction response to TCDD treatment, strongly suggesting that they are primary AhR-responsive genes.
DISCUSSION
The present study examined the hepatotoxicity elicited by a single oral dose of TCDD using histological, clinical, and global gene expression approaches. TCDD induced time-dependent and dose-dependent increases in relative liver weight due to fatty vacuolization and altered serum FFA, TG, and CHOL. At later time points, there also was evidence of immune infiltration and apoptosis. Gene-expression responses exhibited time- and dose-dependent patterns consistent with these end points, thereby providing mechanistic information regarding the etiology of TCDD-induced fatty liver and hepatotoxicity. Functional annotation of the responses associated changes in gene expression with metabolizing enzymes, development and differentiation, fatty acid uptake and metabolism, gluconeogenesis, apoptosis, and immune signaling, all of which are consistent with known responses to TCDD, as well as the histological and clinical results from this study. The following sections integrate these results with published data to further elucidate AhR-mediated gene expression effects involved in the hepatotoxic effects of TCDD.
TCDD Induction of Metabolizing Enzymes and Oxidative Stress
Genes encoding products associated with oxidoreductase, monooxygenase, and xenobiotic metabolism activities were induced by TCDD, some of which have been previously characterized as members of the “AhR gene battery,” including Cyp1a1, 1a2, and 1b1, as well as Nqo1 and Ugt1a6 (Nebert et al., 2000). Although their induction serves an important role in detoxification, their activity also contributes to the formation of reactive oxygen species (ROS), which can lead to cellular oxidative stress, lipid peroxidation, and DNA fragmentation (Bagchi et al., 2002; Barouki and Morel, 2001). TCDD is a particularly potent mediator of ROS formation as a result of its pronounced induction of P450 enzymes such as Cyp1a1 (Bagchi et al., 2002), whereas Cyp1a2 is considered only a minor contributor (Slezak et al., 1999). However, Cyp1a1 null mice still exhibit the hallmarks of TCDD toxicity, suggesting the involvement of additional members of the AhR gene battery in mediating these adverse effects (Uno et al., 2004).
Further examination identified previously uncharacterized TCDD-induced transcripts encoding enzymes with oxidoreductase activity. As with classic members of the AhR gene battery, xanthine dehydrogenase (Xdh), Ugdh, Dhrs3, and Cbr3 were upregulated early (within 4 h) and dose dependently, and they were likely significant contributors to TCDD-mediated oxidative stress. For example, Xdh is a known major producer of ROS in ischemia–reperfusion injury because of its ability to catalyze the reduction of molecular oxygen leading to the formation of superoxide anions and hydrogen peroxide (Zimmerman and Granger, 1994). Xanthine dehydrogenase transcript induction also complements reports of sustained induction of hepatic Xdh enzyme activity after TCDD treatment (Sugihara et al., 2001). Moreover, comparative computational scanning using a PWM has identified high-scoring putative DREs in the proximal promoter sequences of each of these enzymes.
Induction of ROS-generating enzymes was accompanied by increases in glutathione transferases (GSTs—Gsta2, a4, and p2), epoxide hydrolase (Ephx1), and Ugdh, which prevent cellular damage by oxidative stress. Glutathione transferases catalyze the conjugation of reduced glutathione (GSH) to electrophiles and products of oxidative stress, thereby facilitating their elimination. Although GSH protects against oxidative stress, production of ROS by TCDD depletes cellular GSH levels, leaving cells susceptible to oxidative damage. Consistent with this finding, the two GSH-synthesis enzymes, glutamate-cysteine ligase, which catalyzes the first and rate-limiting step, and glutathione synthetase, which catalyzes the second step, were induced by TCDD. UDP glucose dehydrogenase catalyzes the formation of UDP-glucuronic acid (UDPGA) from UDP-glucose. In subsequent phase II glucuronidation reactions, UDPGA is conjugated to reactive xenobiotics to facilitate their elimination. Interestingly, these conjugation reactions are catalyzed by Ugt1a6 and 1a7, both members of the AhR gene battery, indicating that TCDD induces multiple levels of this phase II metabolism pathway. The induction of these phase II enzymes may play an important protective role in response to TCDD-elicited oxidative stress.
TCDD-Induced Fatty Acid Uptake and Metabolism
The integration of histopathology and clinical chemistry with microarray data provides compelling evidence that TCDD-mediated increases in liver weight can be attributed to fatty accumulation involving the disruption of hepatic lipid uptake and metabolism. Cellular uptake of lipids from chylomicrons and very low density lipoprotein (VLDL) occurs via hydrolysis by lipoprotein lipase (Lpl) and hepatic lipase, which enables FFA to accumulate via membrane-associated transporters such as fatty acid binding proteins (Fabp), fatty acid translocase, and fatty acid transport proteins (Jump and Clarke, 1999). Lipoprotein lipase mRNA was upregulated within 18 h and achieved maximum induction by 168 h, which would increase FFA availability for hepatic uptake. In addition, TCDD induction of Fabp4 and 5, Slc27a2, and Cd36 would facilitate increased hepatic fatty acid uptake and a resultant fatty liver. Cell models with increased or reduced expression of Fabp exhibit increased and decreased fatty acid uptake, respectively (Haunerland and Spener, 2004). Fatty acid transporter 2 (Slc27a2), which was upregulated at 4 h and remained elevated through to 168 h, facilitates long chain fatty acid transport across the plasma membrane and accounts for high affinity and specific FA transport in hepatocytes (Hirsch et al., 1998). Fatty acid translocase (Cd36), upregulated in a pattern similar to that of Lpl, is a key enzyme involved in the uptake of FA and oxidized LDL across the plasma membrane. Null mutations of Cd36 result in reduced FA uptake, whereas overexpression increases FA uptake and metabolism (Bonen et al., 2004; Febbraio et al., 1999). Lipoprotein receptor–related protein-2 (Lrp2) was also upregulated for the duration of the time course and may account for the increased hepatic cholesterol ester content and reduced serum levels. Lipin2 was upregulated throughout the time course and belongs to a family of genes whose deficiency prevents normal lipid accumulation and the induction of key lipogenic enzymes in adipocytes (Peterfy et al., 2001; Phan et al., 2004). Furthermore, mice deficient in Lipin exhibit dramatically reduced Lpl activity (Langner et al., 1989). Consequently, TCDD induction of Lipin2 may be linked to the subsequent upregulation of Lpl. Collectively, induction of these key genes supports an environment for increased lipid uptake into the liver. Furthermore, their dose-dependent and temporal expression profiles precede or parallel the observed histological increases in hepatic fat accumulation, strongly suggesting that their induction is involved in mediating this response.
Fatty acids also act as signaling molecules that regulate gene expression. Fatty acid synthase (Fasn), involved in de novo lipogenesis, and Apoa1 were both downregulated late following TCDD treatment, consistent with their previously reported decreases in transcript and activity levels after increases in hepatic FA accumulation (Duplus et al., 2000). Similarly, the oxidative phosphorylation uncoupling gene, uncoupling protein-2 (Ucp2), was induced late, in agreement with its regulation by FA (Reilly and Thompson, 2000). These results suggest that a subset of the late changes in gene expression may be secondary to the increased FA content of the liver, and not direct AhR-mediated responses.
Inhibition of Gluconeogenic Enzymes
TCDD-induced lethality involves feed refusal, body weight loss, and exhaustion of energy stores, collectively referred to as a “wasting syndrome” (Viluksela et al., 1995). However, feed refusal alone does not sufficiently account for the wasting effect, as pair-fed animals still exhibit this response (Chapman and Schiller, 1985). TCDD exposure also inhibits gluconeogenesis by repressing key gluconeogenic enzymes, which, in combination with feed refusal, is thought to result in TCDD-induced wasting syndrome lethality (Viluksela et al., 1995). Phosphoenolpyruvate carboxykinase 1, pyruvate carboxylase (Pcx), and to a lesser extent G6pc (glucose-6-phosphatase) are known to be repressed by TCDD. In this study, repression of Pck1, Gpd2, and Got1 was also detected. Of these, Gpd2 catalyzes the irreversible conversion of glycerol phosphate to dihydroxyacetone phosphate (DHAP) required for the formation of fructose-1–6-bisphosphate; Got1 is involved in the malate-aspartate shuttle and the conversion of aspartate to oxaloacetate, which provides substrate for use by Pck1 in gluconeogenesis. The multiple gluconeogenic enzymes downregulated further implicate this pathway as a target in the etiology of TCDD-induced wasting syndrome.
In adipose tissue, TCDD inhibits lipid synthesis, decreases uptake of FFA due to reduced Lpl activity, and increases the mobilization of fat (Lakshman et al., 1989). Gluconeogenic enzymes also serve roles in glyceroneogenesis, a process that plays an integral but opposite role in fatty acid cycling and triglyceride turnover in hepatic and adipose tissues. In adipose tissue, inhibition of glyceroneogeneis induces FFA release caused by decreased triglyceride storage. Increased FFA output combined with the reduced uptake from downregulation of adipose Lpl, is a likely contributor to the increased serum FFA levels observed in the present study. Furthermore, inhibition of hepatic glyceroneogenesis reduces triglyceride output, thereby contributing to the TCDD-elicited fatty liver. Collectively, FFA mobilization from adipose tissue and the decreased triglyceride export from the liver, combined with the increased expression of genes for fatty acid uptake, would facilitate the loss of body fat (i.e., wasting) and its accumulation in the liver.
Immune Cell Accumulation
Histological analysis revealed the presence of immune cell accumulation, primarily in the centrilobular regions, coincident with the upregulation of numerous immune signaling genes at 168 h. These genes included a number of cluster of differentiation and lymphocyte antigens (Cd and Ly antigens), as well as major histocompatabilty complex (MHC) molecules. Cluster of differentiation and Ly antigens are surface molecules on hemopoietic cells that are important in a number of immune signaling functions, including rolling and migration, as well as T-cell activation (Lai et al., 1998; Sumoza-Toledo and Santos-Argumedo, 2004). H2-Ab1 and H2-Eb1 belong to the MHC class II and are involved in antigen presentation and processing (Alfonso et al., 2001). Changes in immune gene expression are likely a secondary AhR-independent response to hepatic damage mediated by ROS or fatty accumulation, as induction was confined to the 168-h time point when immune cell infiltration was detected by histology, a finding consistent the absence of DREs in the promoters of these genes. These results further illustrate the importance of complementary histology to facilitate the interpretation of changes in gene expression in complex tissue analysis.
Apoptosis
Induction of a number of genes involved in the initiation of apoptosis was also detected by microarray analysis, including Rip1k, Casp6, and Hip1. Both Rip1k and Hip1 are able to activate apoptotic pathways (Gervais et al., 2002; Grimm et al., 1996), whereas Casp6 induction lowers the threshold for apoptotic signals (MacLachlan and El-Deiry, 2002). The collective induction of these and other genes is supportive of a cellular environment conducive to apoptosis, in agreement with histological evidence of late apoptotic events. Although induction of these apoptotic genes may be a response secondary to oxidative stress and toxicity, it is also possible that these are primary response genes involved in TCDD-mediated apoptosis or alterations in differentiation.
TCDD Regulates Genes Involved in Development and Differentiation
TCDD treatment also resulted in the induction of a number of genes involved in development and differentiation, including Tnfaip2 and Notch1. Although these genes may not be involved in mediating the hepatotoxicity observed in this study, they may play an important role in normal AhR signaling during hepatic development, as AhR null mice are known to exhibit reduced liver size and altered hepatic vasculature (Fernandez-Salguero et al., 1995; Lahvis et al., 2000; Schmidt et al., 1996). Both genes have previously been implicated in tissue development and exhibit specific patterns of expression in the developing liver (Wolf et al., 1994) (Harper et al., 2003; Loomes et al., 2002). Activation of Notch receptors induce the hairy and enhancer of split (Hes) family of genes, whose expression mediates many aspects of Notch signaling (Pissarra et al., 2000). Consistent with this regulation, induction of Hes6 at the 72- and 168-h time points was also observed. The hepatic expression patterns of Tnfaip2 and Notch1 occur during embryonic days 12–18 (Loomes et al., 2002; Wolf et al., 1994), which coincides with the period of AhR activation required for normal liver development (Walisser et al., 2004a). Furthermore, treatment of AhR hypomorphs, which exhibit a 90% reduction in AhR levels and display altered hepatic development, with TCDD on embryonic days 12–18, is able to restore normal liver development, presumably as a result of the potent activation of low levels of AhR (Walisser et al., 2004a). Therefore, these genes provide putative candidates for mediating the hepatic developmental role of the AhR.
SUMMARY
The present study represents the first comprehensive in vivo examination of the acute transcriptional response of the liver to TCDD. Alterations in gene expression were directly related to physiological outcomes, which demonstrates the importance of phenotypic anchoring when interpreting microarray data. Integration of gene expression and histological and clinical chemistry end points facilitated the development of a response network that further elucidates potential mechanisms involved in TCDD-mediated hepatotoxicity (Fig. 8). The comprehensive time course analysis also allowed for the identification of gene expression responses that precede and may mediate subsequent physiological/toxicological responses. Early and sustained induction of ROS-generating oxidoreductase enzymes likely contribute to later liver damage, as indicated by mild increases in ALT levels and the subsequent accumulation of immune cells. Changes in gene expression and histopathology also indicated the occurrence of apoptosis, which may be due to direct transcriptional responses or may be a secondary response to oxidative stress. Dysregulation of gene expression responses involved in fatty acid uptake and metabolism concomitant with serum TG and FFA increases the inhibition of glyceroneogenesis, suggesting a putative mechanism for mediating the subsequent fatty liver response. Additional studies are required to more fully delineate these responses and determine if other hepatotoxicants use common pathways to elicit comparable steatotic effects. Furthermore, examination of additional target tissues and animal models will reveal whether these responses are tissue- and/or species-specific, which will aid in development of accurate models of toxicity for TCDD and related compounds, as well as human risk assessments.
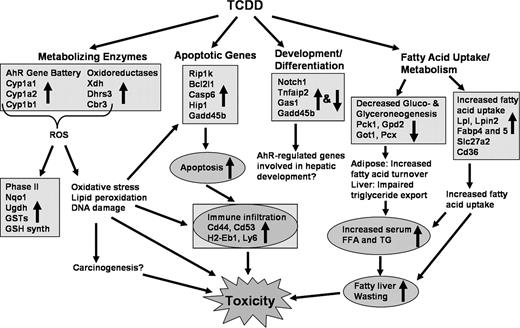
Integration of gene expression, histology, and clinical chemistry end points and their potential involvement in the etiology of TCDD-mediated hepatotoxicity. Responses in boxes represent gene expression observations; circles represent clinical or histological observations; arrows in the boxes or circles indicate direction of indicated response.
Special thanks to Dr. John LaPres, Ajith Vengellur, Ed Dere, and Josh Kwekel for critical reading of this manuscript. D.R.B. is supported by a fellowship from the Michigan Agricultural Experimental Station. T.R.Z. is partially supported by the Michigan Agricultural Experimental Station. This work was supported by funds from National Institutes of Health (NIH) grant R01-ES12245 and Superfund grant P42-ES04911.
References
Alfonso, C., Han, J.-O., Williams, G. S., and Karlsson, L. (
Bagchi, D., Balmoori, J., Bagchi, M., Ye, X., Williams, C. B., and Stohs, S. J. (
Barouki, R., and Morel, Y. (
Bonen, A., Campbell, S. E., Benton, C. R., Chabowski, A., Coort, S. L., Han, X. X., Koonen, D. P., Glatz, J. F., and Luiken, J. J. (
Bunger, M. K., Moran, S. M., Glover, E., Thomae, T. L., Lahvis, G. P., Lin, B. C., and Bradfield, C. A. (
Chapman, D. E., and Schiller, C. M. (
Denison, M. S., and Heath-Pagliuso, S. (
Diliberto, J. J., Akubue, P. I., Luebke, R. W., and Birnbaum, L. S. (
Duplus, E., Glorian, M., and Forest, C. (
Eckel, J. E., Gennings, C., Chinchilli, V. M., Burgoon, L. D., and Zacharewski, T. R. (
Eckel, J. E., Gennings, C., Therneau, T. M., Burgoon, L. D., Boverhof, D. R., and Zacharewski, T. R. (
Febbraio, M., Abumrad, N. A., Hajjar, D. P., Sharma, K., Cheng, W., Pearce, S. F. A., and Silverstein, R. L. (
Fernandez-Salguero, P., Pineau, T., Hilbert, D. M., McPhail, T., Lee, S. S., Kimura, S., Nebert, D. W., Rudikoff, S., Ward, J. M., and Gonzalez, F. J. (
Fletcher, N., Hanberg, A., and Hakansson, H. (
Gervais, F. G., Singaraja, R., Xanthoudakis, S., Gutekunst, C. A., Leavitt, B. R., Metzler, M., Hackam, A. S., Tam, J., Vaillancourt, J. P., Houtzager, V. et al. (
Gonzalez, F. J., and Fernandez-Salguero, P. (
Grimm, S., Stanger, B. Z., and Leder, P. (
Hankinson, O. (
Harper, J. A., Yuan, J. S., Tan, J. B., Visan, I., and Guidos, C. J. (
Haunerland, N. H., and Spener, F. (
Hirsch, D., Stahl, A., and Lodish, H. F. (
Hurst, C. H., DeVito, M. J., Setzer, R. W., and Birnbaum, L. S. (
Jump, D. B., and Clarke, S. D. (
Lahvis, G. P., Lindell, S. L., Thomas, R. S., McCuskey, R. S., Murphy, C., Glover, E., Bentz, M., Southard, J., and Bradfield, C. A. (
Lai, L., Alaverdi, N., Maltais, L., and Morse, H. C., III (
Lakshman, M. R., Chirtel, S. J., Chambers, L. L., and Coutlakis, P. J. (
Langner, C. A., Birkenmeier, E. H., Ben-Zeev, O., Schotz, M. C., Sweet, H. O., Davisson, M. T., and Gordon, J. I. (
Loomes, K. M., Taichman, D. B., Glover, C. L., Williams, P. T., Markowitz, J. E., Piccoli, D. A., Baldwin, H. S., and Oakey, R. J. (
MacLachlan, T. K., and El-Deiry, W. S. (
McGregor, D. B., Partensky, C., Wilbourn, J., and Rice, J. M. (
Moennikes, O., Loeppen, S., Buchmann, A., Andersson, P., Ittrich, C., Poellinger, L., and Schwarz, M. (
Nebert, D. W., Roe, A. L., Dieter, M. Z., Solis, W. A., Yang, Y., and Dalton, T. P. (
Okey, A. B., Vella, L. M., and Harper, P. A. (
Peterfy, M., Phan, J., Xu, P., and Reue, K. (
Peters, J. M., Narotsky, M. G., Elizondo, G., Fernandez-Salguero, P. M., Gonzalez, F. J., and Abbott, B. D. (
Phan, J., Peterfy, M., and Reue, K. (
Pissarra, L., Henrique, D., and Duarte, A. (
Pohjanvirta, R., and Tuomisto, J. (
Poland, A., and Knutson, J. C. (
Reilly, J. M., and Thompson, M. P. (
Rozen, S., and Skaletsky, H. J. (
Schmidt, J. V., and Bradfield, C. A. (
Schmidt, J. V., Su, G. H., Reddy, J. K., Simon, M. C., and Bradfield, C. A. (
Slezak, B. P., Diliberto, J. J., and Birnbaum, L. S. (
Stahl, B. U., Beer, D. G., Weber, L. W., Lebofsky, M., and Rozman, K. (
Sugihara, K., Kitamura, S., Yamada, T., Ohta, S., Yamashita, K., Yasuda, M., and Fujii-Kuriyama, Y. (
Sumoza-Toledo, A., and Santos-Argumedo, L. (
Sun, Y. V., Boverhof, D. R., Burgoon, L. D., Fielden, M. R., and Zacharewski, T. R. (
Uno, S., Dalton, T. P., Sinclair, P. R., Gorman, N., Wang, B., Smith, A. G., Miller, M. L., Shertzer, H. G., and Nebert, D. W. (
Vezina, C. M., Walker, N. J., and Olson, J. R. (
Viluksela, M., Stahl, B. U., and Rozman, K. K. (
Vorderstrasse, B. A., Steppan, L. B., Silverstone, A. E., and Kerkvliet, N. I. (
Walisser, J. A., Bunger, M. K., Glover, E., and Bradfield, C. A. (
Walisser, J. A., Bunger, M. K., Glover, E., Harstad, E. B., and Bradfield, C. A. (
Wolf, F. W., Sarma, V., Seldin, M., Drake, S., Suchard, S. J., Shao, H., O'Shea, K. S., and Dixit, V. M. (
Yuen, T., Wurmbach, E., Pfeffer, R. L., Ebersole, B. J., and Sealfon, S. C. (
Author notes
*Department of Biochemistry and Molecular Biology, Michigan State University, East Lansing Michigan; †Department of Pharmacology and Toxicology, Michigan State University, East Lansing Michigan; ‡Department of Pathobiology and Diagnostic Investigation, Michigan State University, East Lansing Michigan; §Department of Physiology, Michigan State University, East Lansing Michigan; ¶Center for Integrative Toxicology, Michigan State University, East Lansing Michigan; and ‖Wellington Laboratories Inc., Guelph Ontario, Canada

Comments