Cryo-EM structure of the adenosine A2A receptor coupled to an engineered heterotrimeric G protein
- MRC Laboratory of Molecular Biology, United Kingdom
Abstract
The adenosine A2A receptor (A2AR) is a prototypical G protein-coupled receptor (GPCR) that couples to the heterotrimeric G protein GS. Here, we determine the structure by electron cryo-microscopy (cryo-EM) of A2AR at pH 7.5 bound to the small molecule agonist NECA and coupled to an engineered heterotrimeric G protein, which contains mini-GS, the βγ subunits and nanobody Nb35. Most regions of the complex have a resolution of ~3.8 Å or better. Comparison with the 3.4 Å resolution crystal structure shows that the receptor and mini-GS are virtually identical and that the density of the side chains and ligand are of comparable quality. However, the cryo-EM density map also indicates regions that are flexible in comparison to the crystal structures, which unexpectedly includes regions in the ligand binding pocket. In addition, an interaction between intracellular loop 1 of the receptor and the β subunit of the G protein was observed.
https://doi.org/10.7554/eLife.35946.001Introduction
The adenosine A2A receptor (A2AR) is an archetypical Class A G-protein-coupled receptor (GPCR) (Venkatakrishnan et al., 2013). A2AR is activated by the endogenous agonist adenosine and plays a prominent role in cardiac function, the immune system and central nervous system, including the release of the major excitatory neurotransmitter glutamate (Fredholm et al., 2001; Fredholm et al., 2011). Given the widespread tissue distribution and physiological relevance of A2AR, it is a validated drug target for many disorders (de Lera Ruiz et al., 2014), including Parkinson’s disease (Hickey and Stacy, 2012) and cancer (Leone et al., 2015). A2AR is one of the most stable GPCRs and structures have been determined of A2AR in an inactive state bound to inverse agonists (Doré et al., 2011; Jaakola et al., 2008; Congreve et al., 2012; Hino et al., 2012; Liu et al., 2012; Segala et al., 2016; Sun et al., 2017), an active intermediate state bound to agonists (Lebon et al., 2015; Lebon et al., 2011; Xu et al., 2011) and the fully active state bound to an agonist and coupled to an engineered G protein, mini-GS (Carpenter et al., 2016). In addition, structure-based drug design has been applied to inactive state structures of A2AR to develop potent and subtype specific inverse agonists with novel scaffolds (Congreve et al., 2012) and these are currently in clinical trials. Comparison of the structures has led to an understanding of the molecular determinants for an inverse agonist compared to an agonist (Lebon et al., 2011), the conformational changes induced by agonist binding to convert the inactive state to the active intermediate state (Lebon et al., 2012), and the role of the G protein in stabilising the fully active state (Carpenter et al., 2016). The active state was determined by crystallizing the receptor coupled solely to mini-GS, an engineered G protein with eight point mutations and three deletions, including the whole of the α-helical domain (Carpenter and Tate, 2016). Although pharmacologically mini-GS recapitulates the ability of a heterotrimeric G protein to increase the affinity of agonist binding to the receptor (Carpenter et al., 2016), the roles for the βγ subunits could not be described. In terms of the interactions between a heterotrimeric G protein and a Class A GPCR, the vast majority of interactions are made by the α subunit, in particular the C-terminal α5 helix (Rasmussen et al., 2011). However, there was an interaction between the β subunit and the β2-adrenoceptor (Rasmussen et al., 2011) and also between the β subunit and the class B receptors for calcitonin (Liang et al., 2017) and glucagon-like peptide (Zhang et al., 2017; Liang et al., 2018). In addition, there is mutagenesis data suggesting that the α2-adrenergic receptor directly interacts with the β subunit (Taylor et al., 1994; Taylor et al., 1996). We therefore determined the structure of A2AR coupled to an engineered heterotrimeric G protein.
There are now two choices in how to determine the structure of a GPCR coupled to a heterotrimeric G protein, which are X-ray crystallography and electron cryo-microscopy (cryo-EM). The disadvantage of X-ray crystallography lies in the difficulty of producing good quality crystals of a GPCR coupled to a heterotrimeric G protein. The only successful strategy so far has been to use lipidic cubic phase composed of the lipid MAG7:7 and to crystallise a GPCR fusion protein with T4 lysozyme at the N-terminus, but there is only a single structure published to date (Rasmussen et al., 2011). The other option is to use cryo-EM and single particle reconstruction techniques. This is now possible given the recent developments in the field over the last few years (Fernandez-Leiro and Scheres, 2016) together with the improved contrast provided by the recently developed Volta phase plate (VPP) (Danev et al., 2014), which enhances the probability of getting structural data of small proteins (Khoshouei et al., 2017). The recent structure determination of two Class B receptors coupled to GS also shows the potential of this methodology (Liang et al., 2017; Zhang et al., 2017; Liang et al., 2018). We thus decided to use cryo-EM to determine the structure of A2AR coupled to an engineered heterotrimeric G protein. This would provide insights about the role of the β subunit in coupling to A2AR, but would also provide an opportunity to directly compare the structure of the receptor determined in the active state by X-ray crystallography and cryo-EM.
Results
Preparation of an A2AR-GS complex
In this work, we used a construct of A2AR that contained thioredoxin at the N-terminus of the receptor (Nehmé et al., 2017). This was originally designed with a rigid linker between the thioredoxin and the receptor to generate a large hydrophilic surface to A2AR to improve crystallisation, although this proved unsuccessful. The presence of thioredoxin did not significantly affect the pharmacology of A2AR, as assessed by determination of its apparent KD for the inverse agonist ZM241385 or in agonist shift assays (Figure 1). It could also be purified to homogeneity and coupled effectively to both mini-GS (Nehmé et al., 2017) and to the heterotrimer containing mini-GS, β1, γ2 and Nb35 (Figure 1). Detergent-solubilised A2AR coupled to the heterotrimer had a molecular weight (excluding the detergent micelle of LMNG) of approximately 135 kDa (Nehmé et al., 2017).
Figure 1
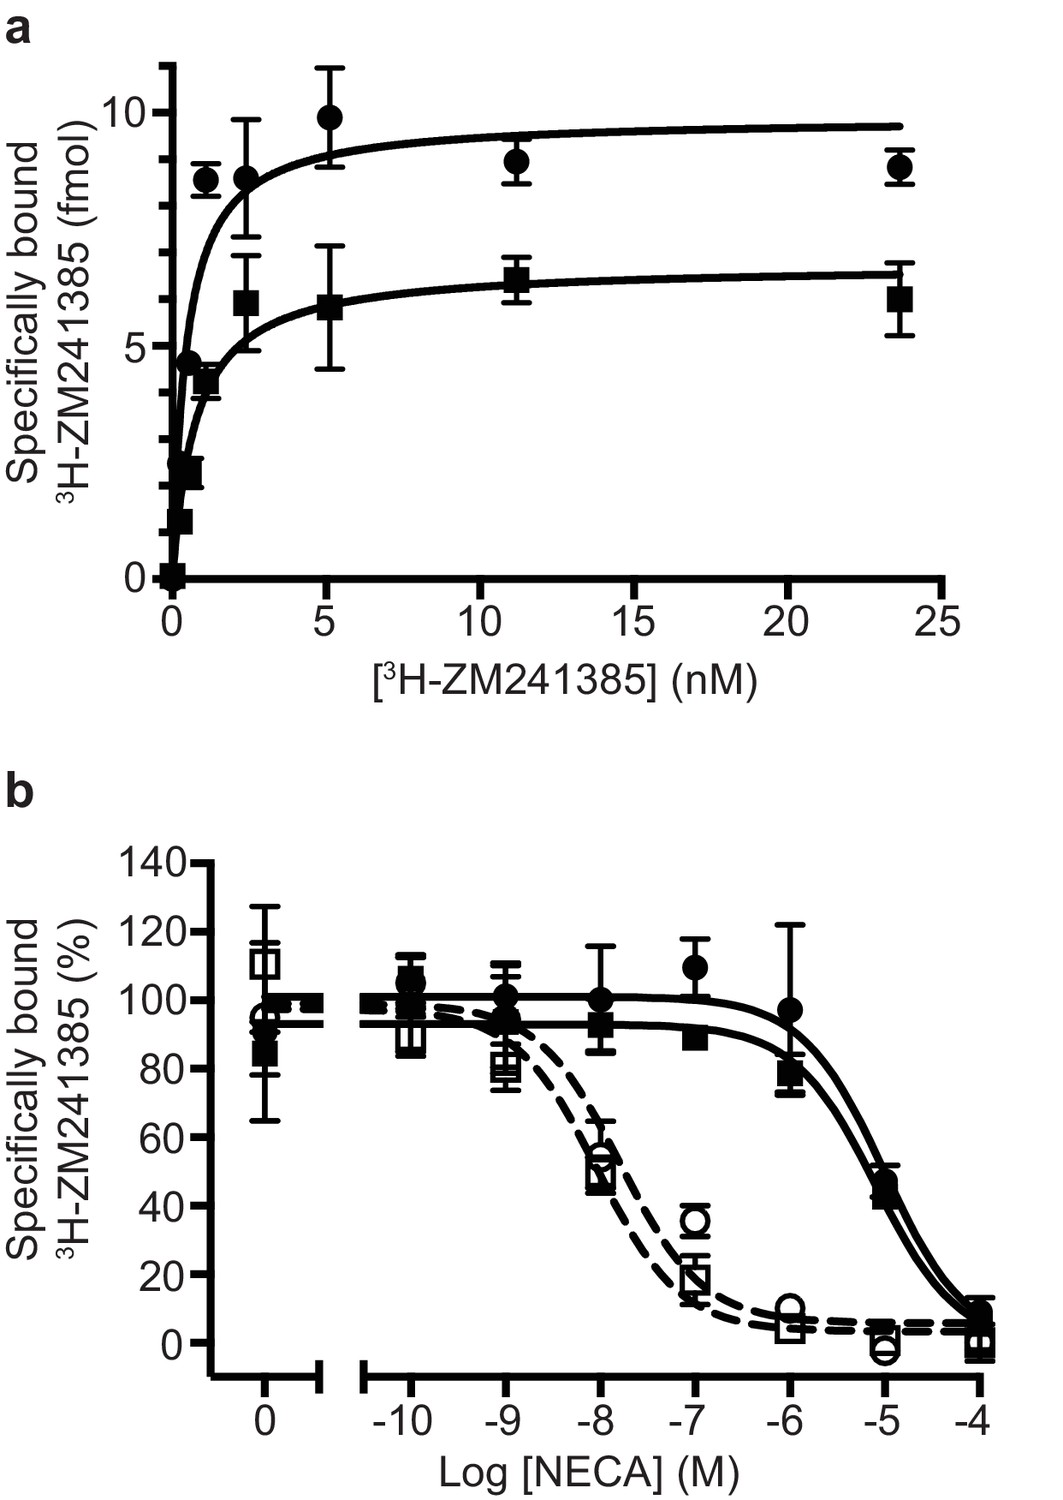
Pharmacological analyses of A2AR.
(a) Saturation binding of the inverse agonist 3H-ZM241385 to A2AR constructs gave the following apparent KDs: A2AR (circles), 0.5 ± 0.1 nM; TrxA-A2AR (squares), 0.8 ± 0.2 nM. (b) Competition binding curves measuring the displacement of 3H-ZM241385 with increasing concentrations of NECA gave the following Kis for NECA; A2AR (filled circles), 1.0 ± 0.5 µM; A2AR + mini-GS (open circles, dashed line), 2.6 ± 1.8 nM; TrxA-A2AR (filled squares), 1.1 ± 0.4 µM; TrxA-A2AR + mini-GS (open squares, dashed line), 1.8 ± 1.2 nM. Data plotted are the average from two independent experiments performed in duplicate with error bars shown as the SD.
-
Figure 1—source data 1
Raw data for A2aR competition binding curves.
- https://doi.org/10.7554/eLife.35946.003
The impact of the Volta Phase Plate on the cryo-EM A2AR-G-protein complex map
Initial micrographs for the A2AR complex were collected on a FEI Titan Krios microscope using a K2 Summit detector in the absence of a Volta-potential phase plate (VPP) (Figure 2a). Data processing showed the characteristic 2D class averages of a GPCR coupled to a heterotrimeric G protein (Figure 2a). After 3D classification and refinement, the best model (containing 72,486 particles) reached 6.7 Å resolution and showed clearly defined α-helices in both the receptor and G protein (Figure 2a). We then collected data using the VPP on a FEI Titan Krios microscope using either a K2 Summit detector or a Falcon III detector in electron counting mode (Figure 2b and c). The K2 dataset consisted of micrographs pooled from different days and collected with slight variations regarding total dose and doses rates (see Materials and methods for details), while the Falcon III dataset was collected in a single session over 48 hr. Both datasets were processed in an equivalent manner to the non-VPP data, with only few minor exceptions (see Materials and methods). Since images collected with a VPP possess higher contrast (Figure 2b and c), the auto-picking feature in RELION that uses a Gaussian blob as a reference resulted in optimal particle picking without the need for specific ‘auto-picking’ references (Fernandez-Leiro and Scheres, 2017). After 2D and 3D classification (see Materials and methods for details), refinement yielded models with overall resolution of 4.88 Å and 4.45 Å for the K2 Summit and Falcon III detector, respectively (Figure 2b and c). The Falcon III model was later improved to 4.11 Å with further processing (see below) showing details for most amino acid side chains after B factor sharpening. The effect of the VPP for this particular dataset was therefore essential to make ‘side-chain’ resolution accessible. A B-factor plot (assessing the number of particles vs resolution) was used to assess the impact of the VPP (Figure 2e). It is observed that, in the presence of the VPP, the A2AR map not only has a better resolution for the same number of particles, but the B-factor improves significantly from 426 to 170 (when comparing K2 Summit with and without VPP). This becomes essential when trying to reach high-resolution information in a reasonable time scale (especially important for high-throughput structure determination in drug discovery). As an example, to obtain the same resolution of 4.88 Å using the K2 Summit detector without the VPP, one would have needed about 5 million particles, that would require ~65 days of data collection at a Titan Krios electron microscope (in comparison to 145,169 particles collected in 48 hr with a VPP).
Figure 2
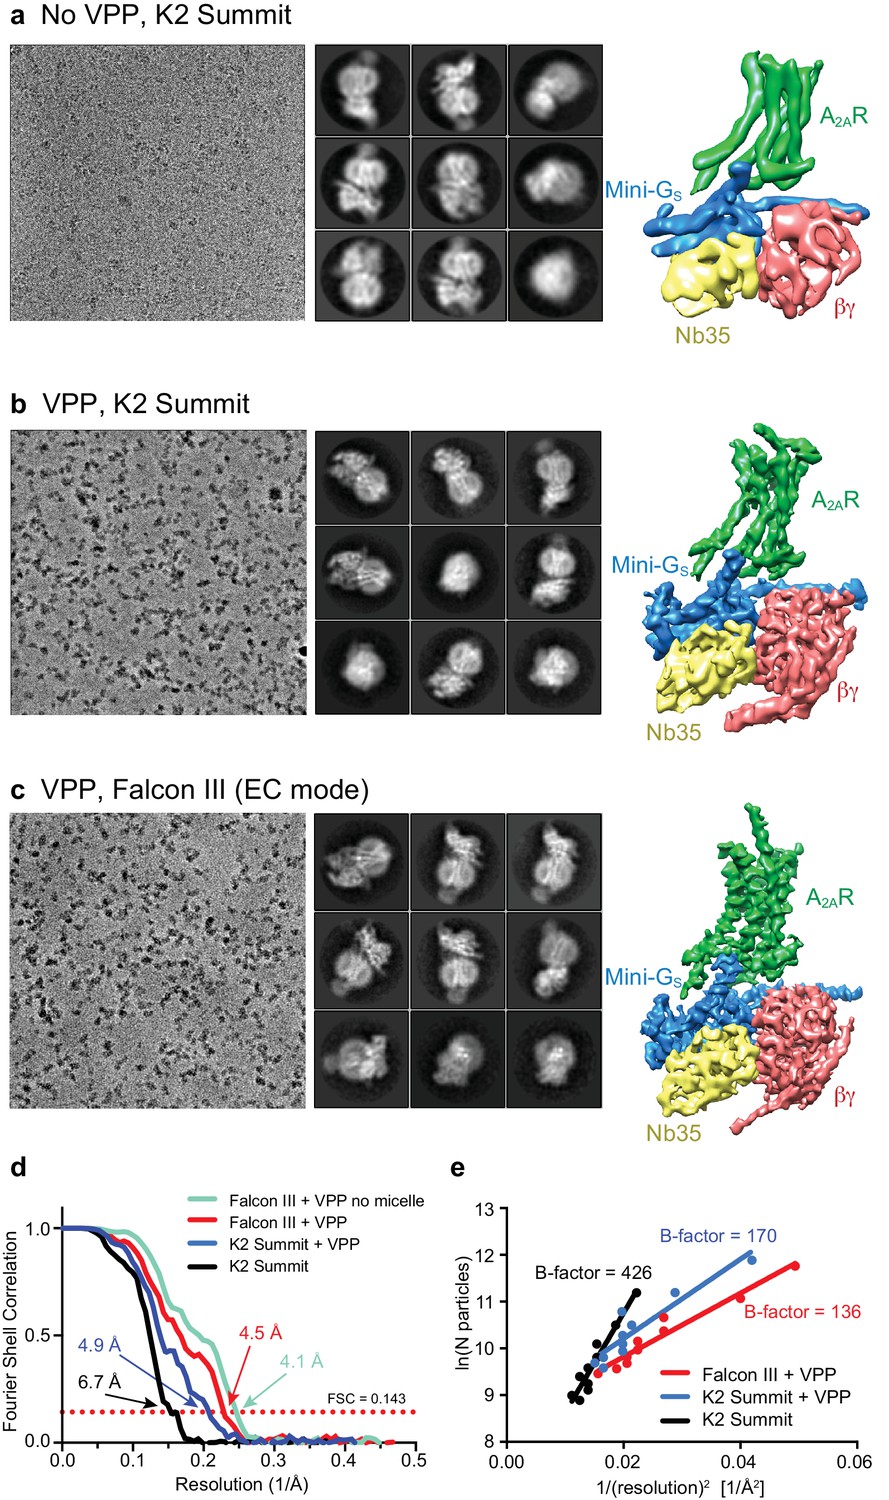
Cryo-EM of the A2AR complex in the presence and absence of a VPP.
(a-c) Each panel contains three sections, with the left-hand section showing a representative micrograph obtained on a Titan Krios, the central section depicting 2D class averages and the right-hand section the refined 3D reconstruction obtained from the data collected. (a) Data collected without using a VPP on a K2 Summit detector. (b) Data collected using a VPP on a K2 Summit detector. (c) Data collected using a VPP on a Falcon III detector in electron counting (EC) mode. (d) Gold-standard FSC curves for the three 3D reconstructions with resolutions estimated at 0.143. (e) Difference in B-factors between the three datasets.
All cryo-EM grids were plunge-frozen from a single batch of A2AR–G protein complex and most of the duplicate grids were made in a single freezing session. Data collection was performed at higher magnification for the non-VPP data (magnification 200,000x and 0.66 Å/pixel) than for the VPP dataset (1.14 Å/pixel and 1.07 Å/pixel for the K2 Summit and Falcon III detectors, respectively), positioning the high-resolution information of the non-VPP data at a better location in the detector DQE range (Nyquist being 1.32 Å vs 2.14 Å/2.28 Å for the non-VPP vs the VPP K2/Falcon III, respectively). The VPP resolution enhancement therefore could potentially be higher if equivalent magnifications were used. Data processing was carried out as equivalent as possible for all datasets in order to make them comparable. We therefore believe that the comparison between the VPP and non-VPP datasets is as fair as possible, although if anything we are favouring the non-VPP data.
Comparisons of data with and without VPP had only been previously been published for samples that readily reached high resolution without VPP. Although in our experience, the improvement is sample dependent, these data show the potential to which the VPP can be useful in certain cases and more comparisons will be needed in order to understand the variability in enhancement between samples. Although we see a significant difference between the K2 and Falcon III performance, data for the K2 with VPP was a result of merging data with different dose rates and total doses. We therefore do not have an absolutely identical comparison of the two detectors.
Structure determination of the A2AR–GS complex
The highest resolution data set corresponded to micrographs collected on a Falcon III detector in electron counting mode using a VPP, therefore this map was used for further processing, model building and subsequent analysis. Data collection parameters and processing are described in the Materials and methods section. In summary, 837 movies were collected and corrected for stage drift, beam induced movement and dose weighting with MotionCor2 (Zheng et al., 2017). CTF fitting, defocus and phase estimation were performed with Gctf-v0.1.06 (Zhang, 2016). Particle picking was performed using a Gaussian blob, as implemented by RELION (Scheres, 2012). 3D classification was performed with an ab initio model and refinement of the best classes with clear GPCR-like features (128,002 particles) attained an overall resolution of 4.45 Å (using gold standard FSC of 0.143) (Rosenthal and Henderson, 2003). Attempts to improve the model included further 3D classification, which revealed that around 50% of the particles contained a heterogeneous γ subunit. However, the resolution and quality of the overall model suffered when removing these particles, so we therefore compromised on having poor quality density for the γ subunit, but having higher resolution for the rest of the complex.
In further attempts to improve the model, during refinement, the low-pass filter effect of the Wiener filter in the regularised likelihood optimisation algorithm was relaxed through the use of a regularisation parameter (T = 5). This allowed the refinement algorithm to consider higher spatial frequencies in the alignment of the individual particles yielding a map of higher quality. Nevertheless, both half-reconstructions were kept completely separately, and the final resolution estimate (at the post-processing stage in RELION) was based on the standard FSC between the two unfiltered half-reconstructions. Although resolution did not improve, the quality of the map improved noticeably.
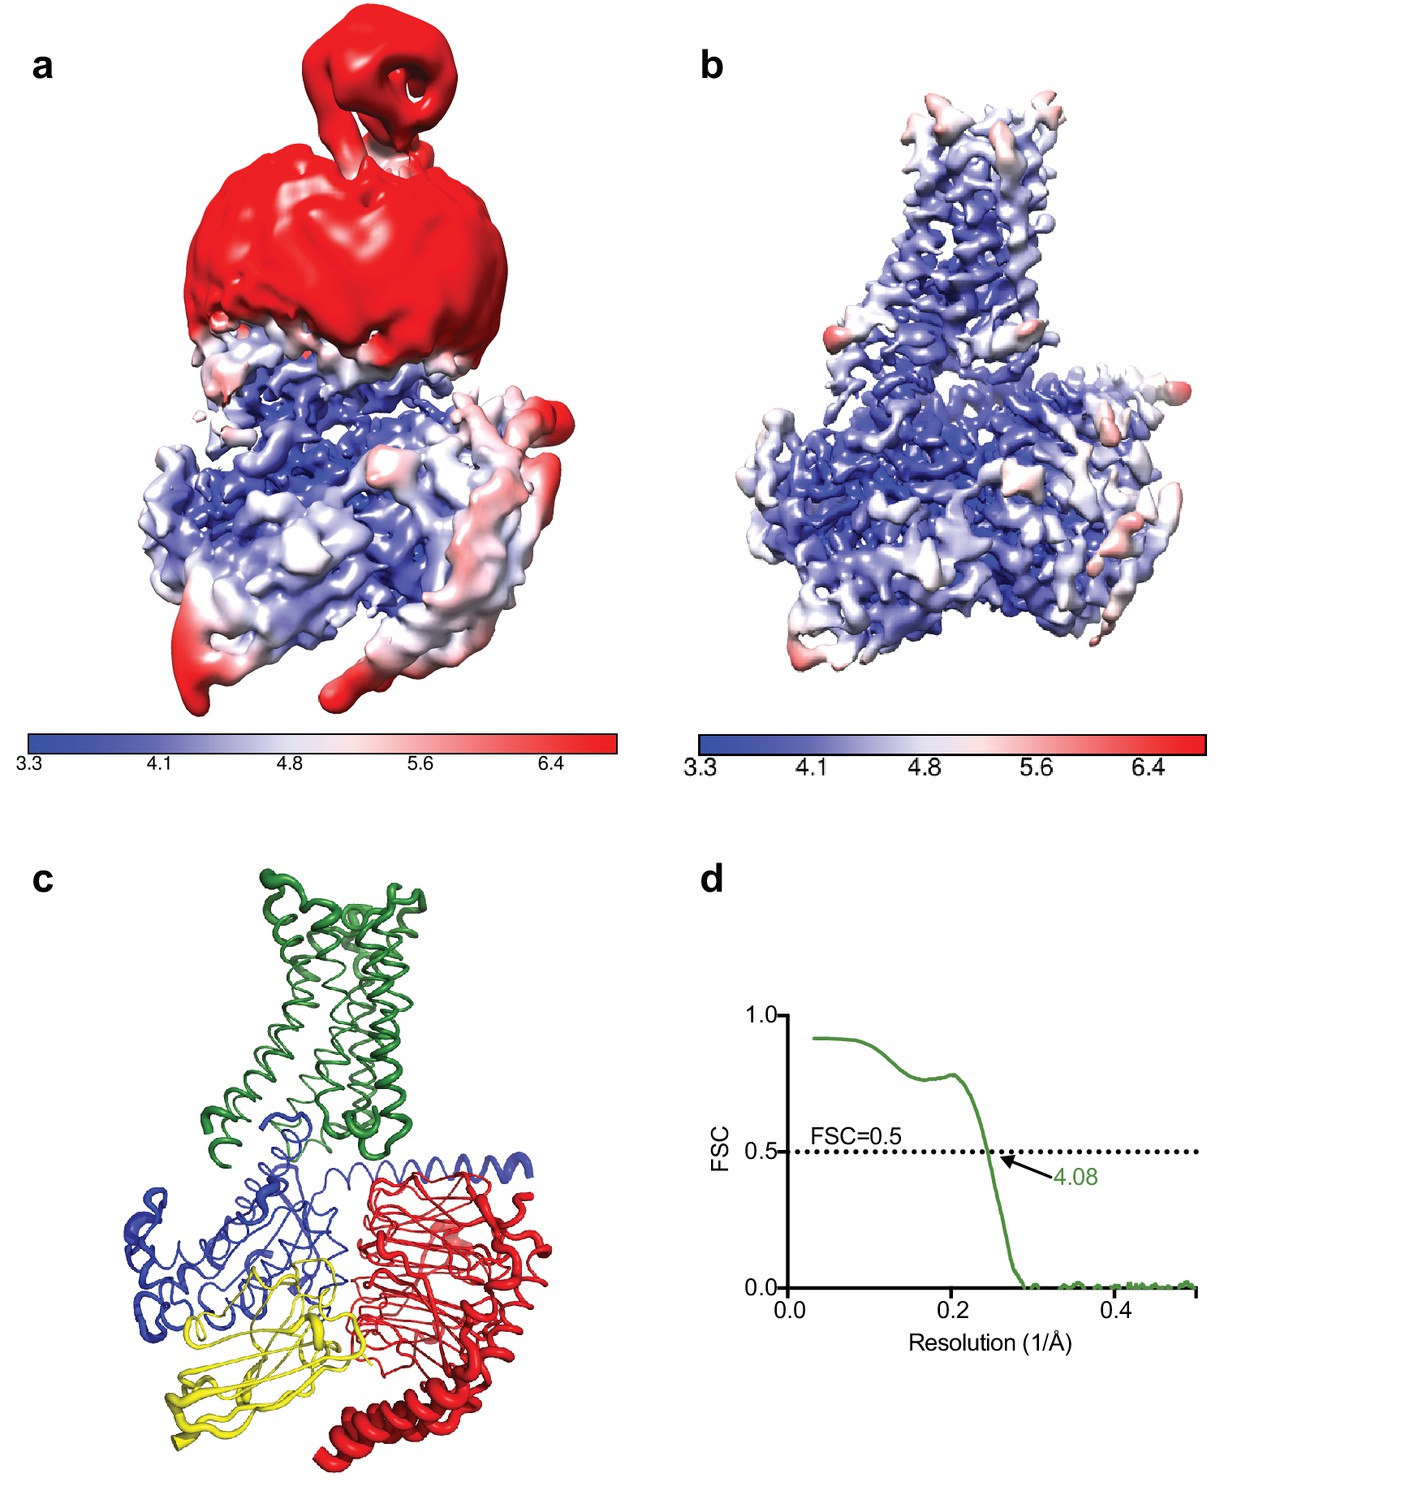
Calculation of the local resolution in RELION showed that although the overall resolution was estimated to be 4.5 Å the core of the complex was ~3.8 Å with most of the map at 4.0 Å resolution or higher, with clearly visible density for the majority of amino acid side chains. As shown in Figure 3, the regions that showed poorer resolution were the thioredoxin and the detergent micelle (a significant fraction of the small complex), which hinders a realistic overall resolution estimation.
Figure 3
Local resolution cryo-EM map.
(a) Local resolution map of the Falcon III + VPP model prior to refinement with signal subtracted particles as calculated with RELION. (b) Local resolution of the same model after refinement of signal subtracted particles (also calculated with RELION) (c) A2AR complex displayed as putty cartoons, where B-factor of the coordinates relates to the thickness of the tube. (d) Fourier shell correlation of the refined model versus the map.
In order to accurately estimate the resolution of the A2AR complex map and to eliminate noise from refinement, the detergent micelle and thioredoxin moiety needed to be excluded. Excluding the micelle by simply tightening the mask did not yield optimal results with artefacts produced at the interface between the model and the mask. Such a strong signal might be specific to LMNG since, in our experience, the signal from other detergents can be masked out in this manner. We then decided to perform a double signal subtraction protocol where initial coordinates were used to create a tight mask around the protein component excluding thioredoxin (A2AR, mini-GS, β, γ, Nb35), which was then subtracted from the original particles. The resulting particles were used to produce an accurate map of the micelle and thioredoxin, which was then used to perform signal subtraction of the original particles, leaving them devoid of micelle or thioredoxin. Refinement of these particles yielded an improved map at 4.11 Å resolution. However, it appeared that the refinement process focused primarily on the intracellular G protein heterotrimer complex leaving a lower quality map at the receptor region. In order to circumvent this problem, we performed refinement with the original particles and then exchanging them for their signal subtracted equivalent (without micelle and thioredoxin) only in the last iteration of refinement. This resulted in the best overall map at 4.11 Å resolution with quality density throughout (Table 1).
Table 1
Data collection and refinement statistics
https://doi.org/10.7554/eLife.35946.006| Data collection | |||
|---|---|---|---|
| Microscope | FEI titan krios | FEI titan krios | FEI titan krios |
| Detector | Falcon III + VPP | K2 Summit + VPP | K2 Summit |
| Pixel size (Å) | 1.07 | 1.14 | 0.66 |
| Voltage (kV) | 300 | 300 | 300 |
| Total electron dose (e-/Å2) | 30 | 40/40/30 | 50 |
| Micrographs collected | 827 | 906 | 2800 |
| Number of frames | 75 | 40/23/30 | 40 |
| Exposure time (s) | 60 | 10/4.6/6.5 | 10 |
| Electron dose per frame (e-/Å2) | 0.4 | 1/1.7/1 | 1.25 |
| Dose rate (e-/pixel/s) | 0.5 | 5.2/9/6 | 2 |
| Frame exposure (s) | 0.8 | 0.25/0.115/0.216 | 0.25 |
| Total number of particles (after 2D classification) | 232,739 | 313,879 | 166,313 |
| cryo-EM 3D Refinement | |||
| Resolution (Å) | 4.11 | 4.88 | 6.71 |
| Map sharpening B-factor (Å2) | −130 | −150 | −529 |
| Fourier shell correlation criterion | 0.143 | 0.143 | 0.143 |
| Particles used in final 3D refinement | 128,002 | 145,169 | 72,487 |
| Defocus (μm) | −0.2 to −1 | −0.3 to −1.2 | −1.2 to −3.5 |
| Coordinate Refinement and Validation | |||
| R.m.s. deviations | |||
| Bonds (Å) | 0.07 | ||
| Angles (°) | 0.984 | ||
| Ramachandran Favoured (%) | 94.6 | ||
| Ramachandran Allowed (%) | 4.89 | ||
| Ramachandran Outliers (%) | 0.51 | ||
| Molprobity score | 1.36 | ||
| Clashcore, all atoms | 0.79 | ||
| Favoured rotamers | 91.12 | ||
| EMRinger score | 1.93 | ||
| FSC (model vs map - 0.5 cut-off) (Å) | 4.08 | ||
| PDB and map deposition | |||
| PDB ID | 6GDG | ||
| EMDB ID | 4390 | ||
Attempts to remove particles with low phase shift and poor contrast (~22,000 particles with <0.25π) decreased resolution and map quality. We therefore kept low phase shift data in the final model.
Overall structure of the NECA-bound A2AR mini heterotrimeric G protein complex
The A2AR cryo-EM complex structure provides insights into its structure in solution, in the absence of crystal contacts and at more physiological conditions (pH 7.5) than the X-ray structure (pH 5.7 or below for inactive structures). The density map of the A2AR–G protein heterotrimer displayed a local resolution varying from 3.3 Å to 6.4 Å (Figure 3). Side chain densities were observed for most amino acid residues (Figure 4), which were of similar quality to those in the X-ray crystallographic map of the A2AR–mini-GS structure (Figure 5). The lowest resolution was found at the C-terminus of the β subunit and most of the γ subunit, which had very poor density. Signal subtraction and 3D classification protocols have been used to isolate different protein conformations of small regions (Bai et al., 2015). Upon implementation of these strategies, we did not find any other discrete conformations of the heterotrimeric G protein, suggesting that the C-terminus of the β subunit and most of the γ subunit region are flexible. Within the cryo-EM structure of A2AR, there are two regions that lack density and are therefore also probably disordered and flexible, namely the N-terminal section of ECL2 (G147 to Q163) and the whole of ICL3 (E212 to S223). These regions are ordered in some crystal structures, but this usually correlates with these regions forming lattice contacts. Sections of the cryo-EM density map for which there is poor quality density and high B-factors of the refined coordinates include TM1, helix 8, the second section of ECL2 that contributes relevant residues for ligand binding (see below), ECL1 and ECL3 (Figures 3 and 4).
Figure 4
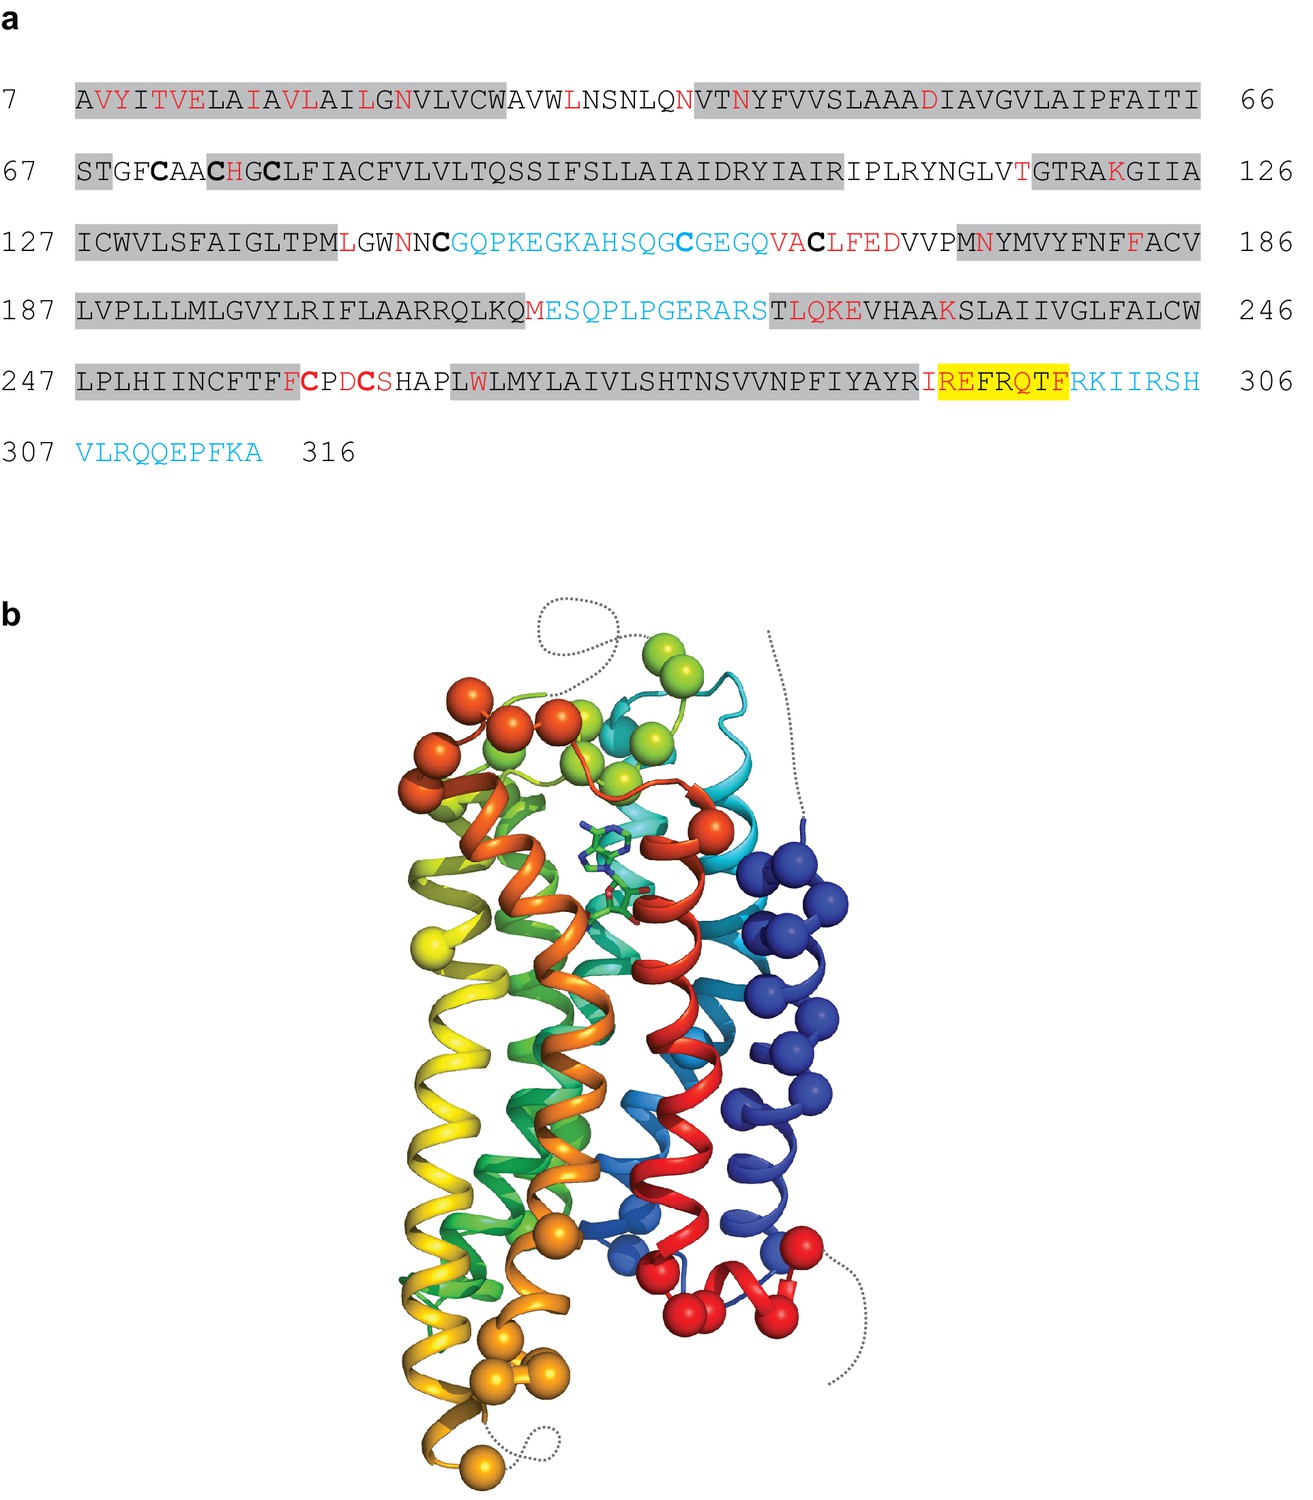
Modelling quality of the A2AR structure.
(a) Amino acid sequence of A2AR used in the cryo-EM structure determination. Residues are coloured according to how they have been modelled: black, good density allows the side chain to be modelled; red, limited density for the side chain present and therefore the side chain has been truncated to Cβ; blue, no density observed and therefore the residue was not modelled. Regions highlighted in grey represent the transmembrane α-helices and amphipathic helix eight is highlighted in yellow. Cys residues involved in the formation of disulphide bonds are in bold. In the cryo-EM structure densities for the disulphide bonds Cys74-Cys146 and Cys77-Cys166 are observed. Densities corresponding to the disulphide bonds Cys71-Cys159 and Cys259-Cys262 are not observed in the cryo-EM data. The sequence of A2AR is from residue 8–316, with the initial Ala residue at position seven being part of the linker between the N-terminal thioredoxin fusion and A2AR. (b) Model of A2AR showing the Cα positions of amino acid residues with poor density (spheres) and regions unmodelled (dotted lines).
Figure 5
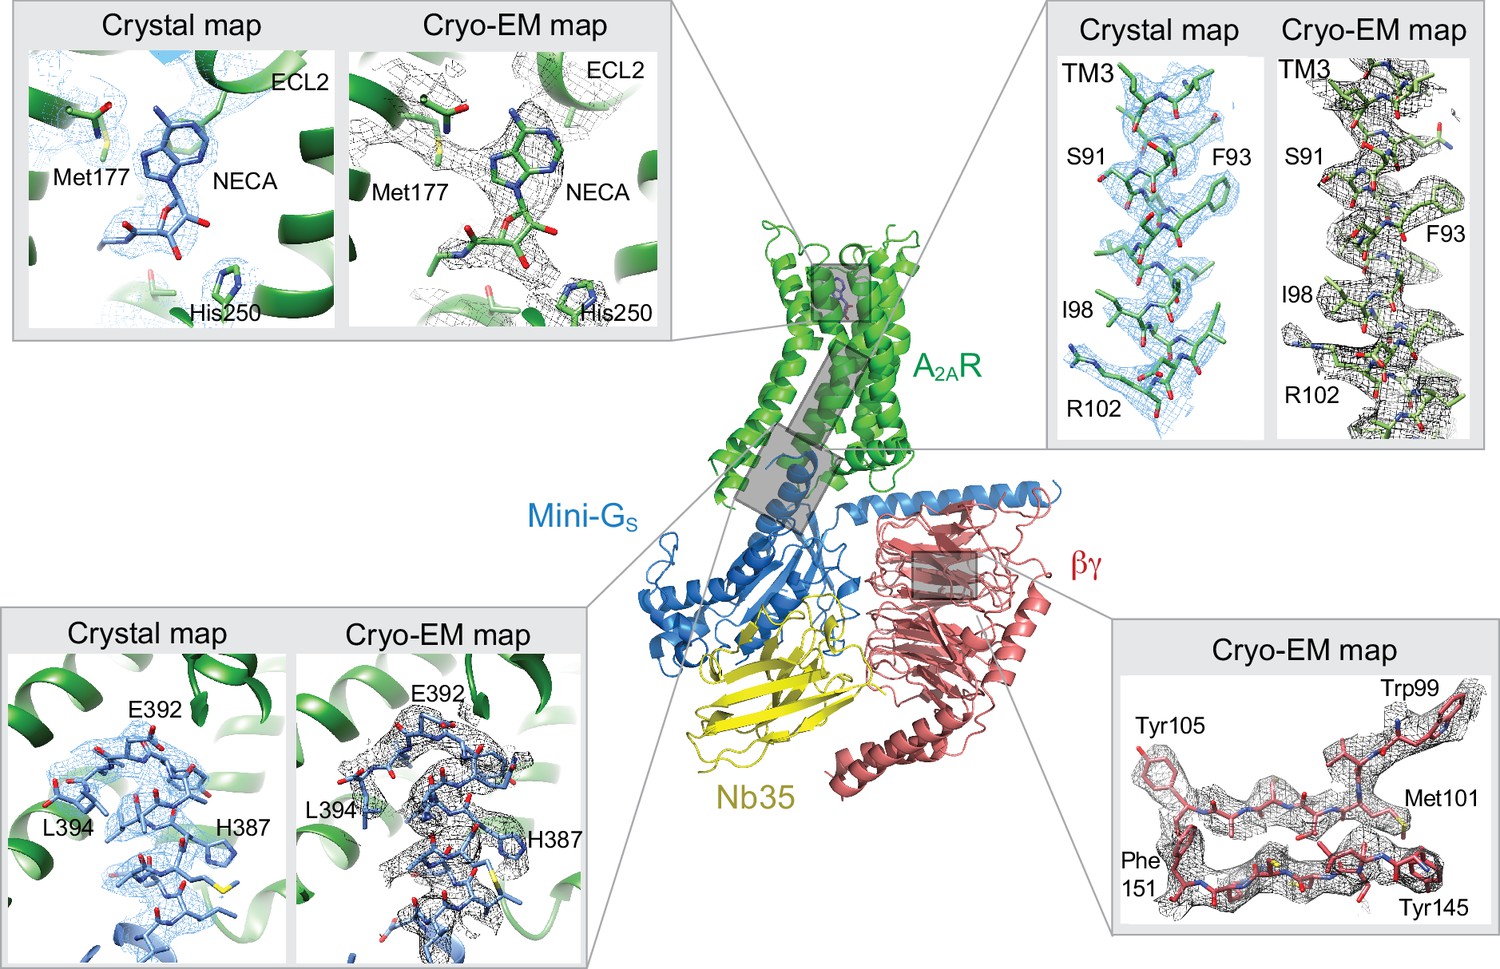
Comparison of map densities from the cryo-EM data and X-ray diffraction data.
The structure of the A2AR–heterotrimeric G protein complex determined by cryo-EM is depicted as a cartoon. The four panels show regions of the structure and the associated density maps from the cryo-EM data and, where present, electron density (2Fo-Fc) from the X-ray structure of the A2AR–mini-GS (PDB code 5g53). Densities for the maps shown in the panels were sharpened using the following B factors (resolution of filtering in parentheses): β subunit and A2AR, −170 Å2 (3.7 Å); mini-GS–A2AR interface, −130 Å2 (3.7 Å); NECA, −130 Å2 (4.1 Å).
The overall architecture of the A2AR–heterotrimeric G protein complex is similar to the heterotrimeric GS-coupled complexes for the β2-adrenergic receptor (Rasmussen et al., 2011), GLP1 (Zhang et al., 2017, Liang et al., 2018) and the calcitonin receptor (Liang et al., 2017). The receptor and mini-Gs portions of the A2AR–G protein complex are very similar to the crystal structure of the A2AR–mini-GS complex, with the RMSD of Cα atoms for the receptor and mini-GS components being 0.5 Å and 0.6 Å, respectively. The largest differences are found at the interface between mini-GS and the β subunit, which have a different conformation when βγ is bound. This may contribute to a minor difference in curvature of the α5 helix in mini-GS when it is in the heterotrimer complex compared to when it is bound to the receptor alone (Figure 5). However, this does not have any major impact on the interface between the receptor and mini-GS, thus further validating the use of mini G proteins as a surrogate for G protein heterotrimers (Carpenter et al., 2016; Carpenter and Tate, 2016; Nehmé et al., 2017).
Cryo-EM map at the ligand binding pocket
The A2AR orthosteric binding pocket is described by two crystal structures of A2AR bound to NECA, with one structure of A2AR in an active intermediate conformation (PDB code 2ydv) (Lebon et al., 2011) and the other structure in the active state coupled to mini-GS (PDB code 5g53) (Carpenter et al., 2016). The extracellular half of A2AR does not undergo any major structural changes in the transition from the active intermediate to the mini-GS coupled active state, with the volume of the binding pocket remaining constant and the interactions to NECA being identical (Carpenter et al., 2016). The orthosteric binding site in the cryo-EM map has well-defined density, although the map has lower resolution towards the extracellular surface. The density for NECA is of sufficient quality to allow an unambiguous orientation of NECA and the same interactions to the receptor are observed as present in the crystal structures (Figures 5 and 6).
Figure 6
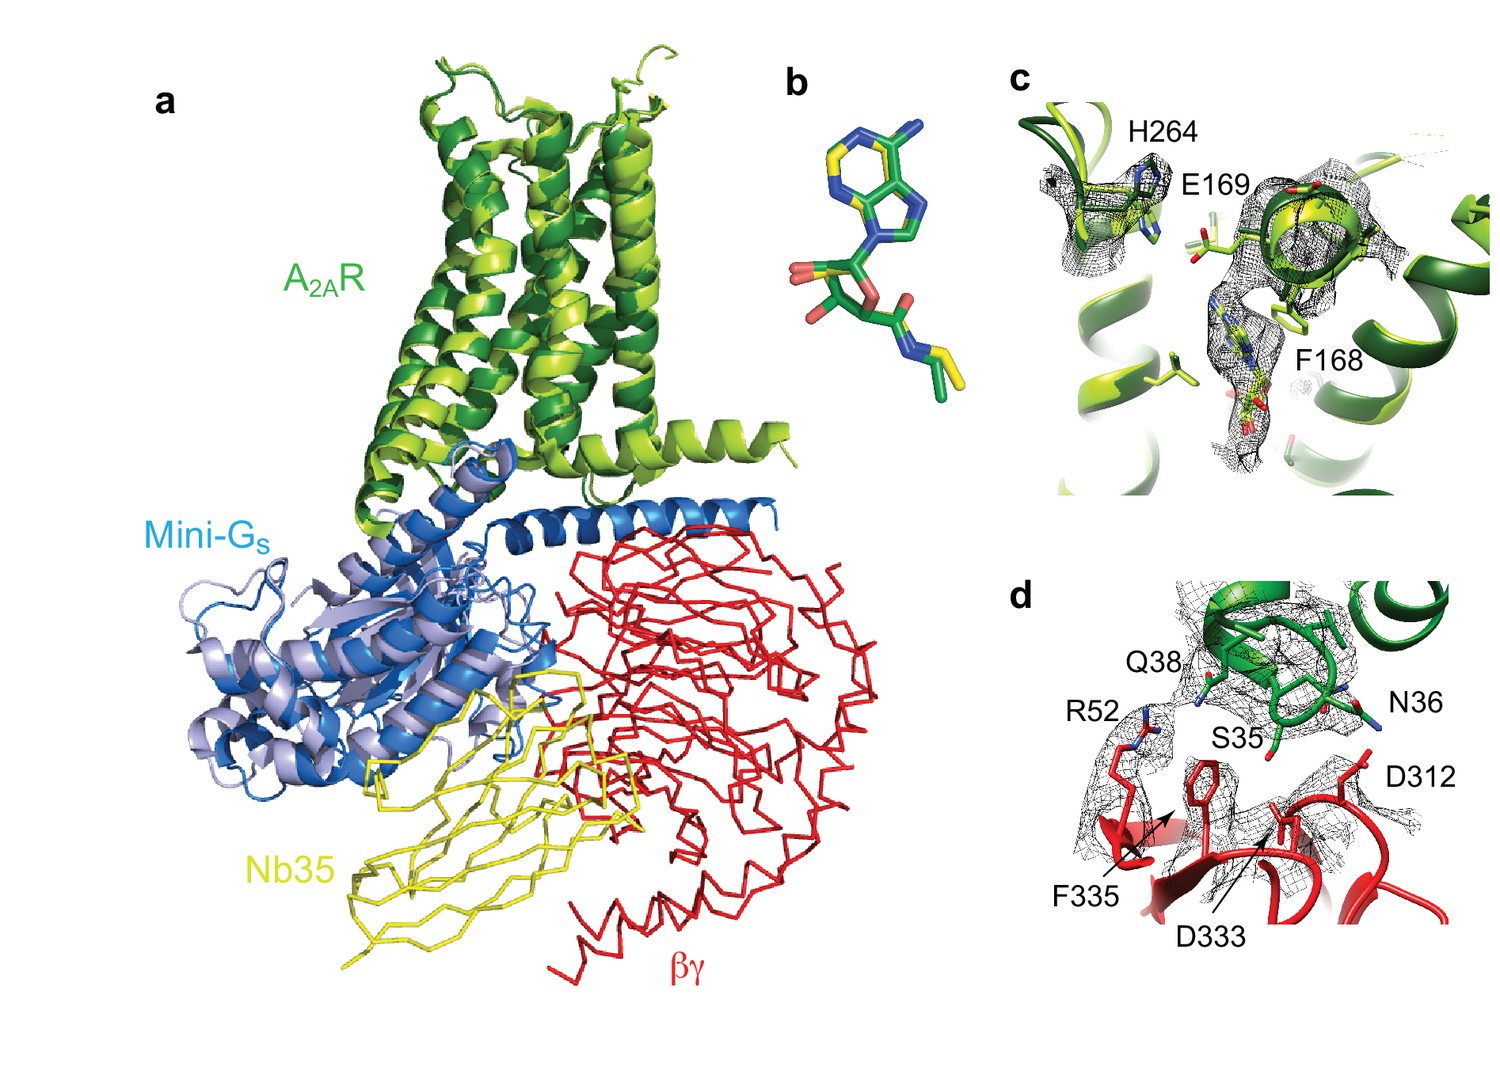
Structure of A2AR–heterotrimeric GS.
(a) Superposition of A2AR (pale green) coupled to mini-Gs (pale blue) with A2AR (dark green) coupled to mini-GS (dark blue), βγ (red) and Nb35 (yellow). (b) Superposition of NECA bound to A2AR in the cryo-EM and X-ray structures after alignment of A2AR (PyMol). (c) The position of His264 in the cryo-EM structure (dark green, density shown by black mesh), differs from its position in the X-ray structure (light green). No density is observed for the side chain of Glu169 in the cryo-EM structure, but when modelled it would be too far away to make a contact with His264. (d) The interface between ICL1 of A2AR (dark green) and the β subunit (red) is depicted, with density shown as a black mesh.
Despite the similarities between the orthosteric binding site observed in the cryo-EM and X-ray structures, small differences were found in ECL2 that forms part of the binding pocket. The C-terminal half of ECL2 in the X-ray structures forms a helical turn that caps the pocket and contributes side chains that interact with NECA (Phe168 and Glu169). In the cryo-EM structure this region is more disordered. As a consequence, there is no significant side chain density for Phe168 and Glu169 in the cryo-EM map. The fact that there is clear density for NECA and His264 excludes the possibility that the whole of this region has poor resolution that is the extracellular portion of the receptor is not moving as a rigid body. This is consistent with ECL2 being dynamic.
A second difference between the NECA-bound X-ray structures and the cryo-EM structure is a likely absence of an interaction between Glu169 and His264. This ionic bridge affects small molecule binding kinetics (Segala et al., 2016) and in most of the crystal structures caps the binding pocket. Although the cryo-EM map in the region is poorer than in the rest of the molecule, it suggests a rotamer for the imidazole group of His264 that points away from the orthosteric binding pocket (Figure 6). This might be a consequence of the pH in which the respective structures were determined. The pKa of the histidine side chain is ~6 and most crystal structures have been obtained at lower pH (~pH 5), favouring protonation of His264 and the formation of the ionic bridge. At a more physiological pH of 7.5 that was used for the cryo-EM structure, His264 would be predominantly deprotonated and unable to form the ionic bridge. Although the rotamer for Glu169 cannot be assigned in the cryo-EM map, His264 adopts a similar rotamer as seen in crystal structures obtained at higher pH, such as the complexes with caffeine, XAC and ZM241385 (~pH 8), all showing a broken ionic bridge. Therefore, it is likely that in the physiological state (represented by the cryo-EM map) this ionic bridge is also absent, unless the surrounding pH is momentarily lowered for specific functions (e.g. the release of high concentrations of glutamate in glutamatergic synapses).
Comparison of the G-protein–receptor interface between the crystal and cryo-EM structures
The interface between mini-GS in the heterotrimeric G protein and A2AR in the cryo-EM structure is very similar to the interface between mini-GS and A2AR in the X-ray structure (PDB code 5g53). The interface in the cryo-EM structure has a buried surface of 1135 Å2 compared to 1048 Å2 for the X-ray structure 5g53; the slight increase is due to interactions between ICL1 of A2AR (residues Leu110 and Asn113) and the N-terminal helix of mini-GS (residues His41 and Arg38). The near full length N-terminal helix was present in the mini-GS construct in the cryo-EM structure, because this is required for the stable interaction between the α subunit and the βγ subunits, whereas it was truncated and disordered in the X-ray structure. The main interactions between A2AR and mini-GS in both the cryo-EM and X-ray structures are made predominantly by the C-terminal α5 helix in mini-GS and amino acid residues in H3, H5, H6, H7, H8 and ICL2 of A2AR (Carpenter et al., 2016). The amino acid residues that make these interactions are identical, but the rotamers sometimes differ between the cryo-EM and X-ray structures. This may be a reflection of the different chemical environments in which the structures were determined or the slight difference in curvature of the α5 helix in mini-GS. In addition, some interactions may be transient and are captured in one structure and not another. For example, Arg291 at the intracellular end of H7 of A2AR adopts a different conformation in the cryo-EM structure compared to the crystal structure. This results in the absence of interactions between the Arg291 side chain and mini-GS, although the backbone carbonyl can still makes potential interactions with Glu392 and the adjacent residues in H8 are still sufficiently close to mini-GS to make interactions. This region is also the main difference to the β2AR-GS complex where the α5 helix in GS does not interact with H7 and H8 of the receptor (Rasmussen et al., 2011).
The major difference between the structure determined by cryo-EM of the A2AR-heterotrimeric G protein complex and the X-ray structure of the A2AR-mini-GS complex was the presence of the βγ subunit in the cryo-EM structure. No interactions were observed between A2AR and the γ subunit, but potential interactions were observed between ICL1 (residues Ser35, Asn36 and Gln38) of A2AR and the β subunit (Arg52, Asp312, Asp333 and Phe335). This interface between A2AR and the β subunit is considerably more extensive than that observed in the β2AR complex (Figure 7), where interactions occur exclusively at Asp312. However, ICL1 shows higher B-factors than the rest of the A2AR cryo-EM structure, which may suggest that the interaction is fairly weak. The recently reported cryo-EM structures of the Class B Calcitonin receptor (Liang et al., 2017) and Glucagon-like peptide-1 receptor (Zhang et al., 2017; Liang et al., 2018) bound to heterotrimerc GS also show a similar interaction between ICL1 and the β subunit where only Asp312 in the β subunit apparently interacts with ICL1 of the receptor. Therefore, the larger interface between the β subunit and A2AR appears at the moment unique to this receptor, although the physiological implications are unclear.
Figure 7
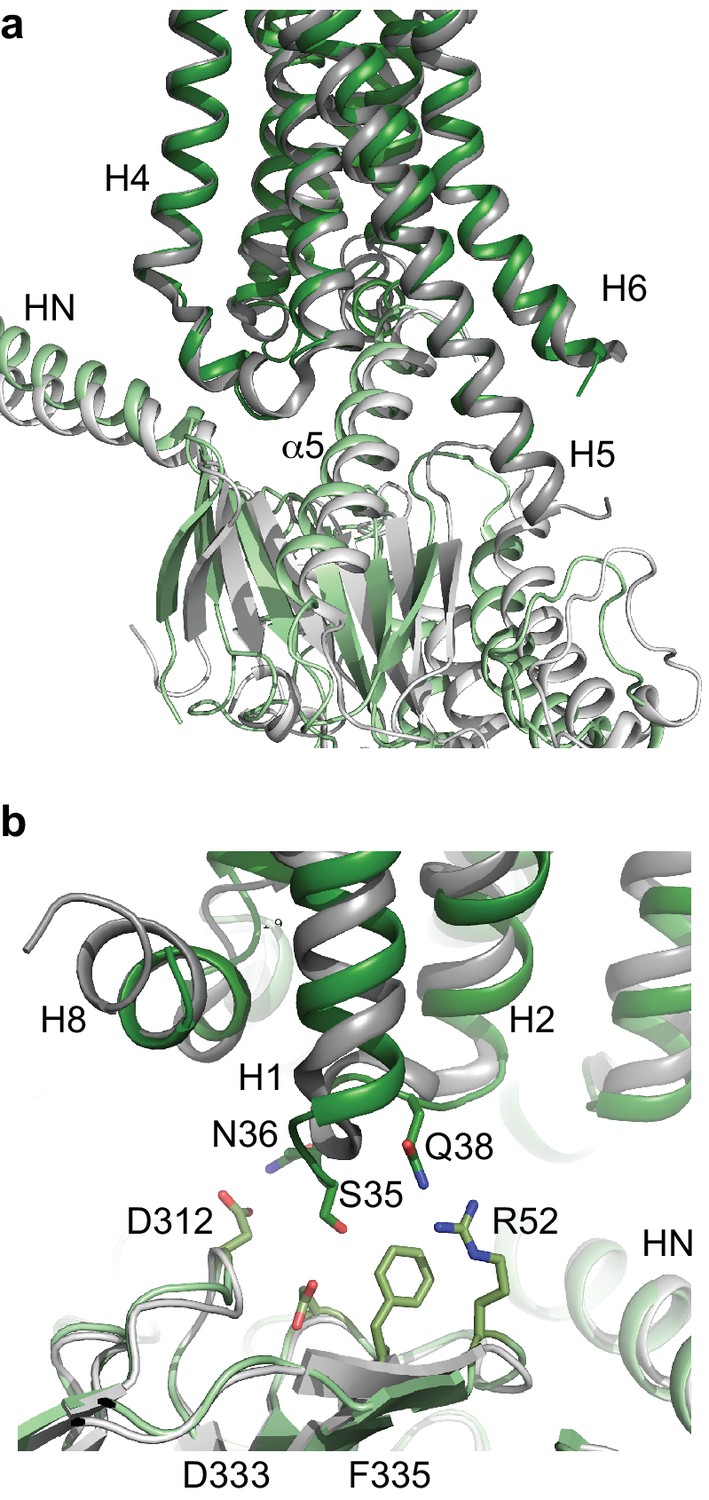
Comparison of A2AR and β2AR coupled to heterotrimeric GS.
(a) A2AR (dark green) and β2AR (dark grey) were aligned using regions of the receptors predicted to be within the cytoplasmic leaflet of the lipid bilayer. The position of mini-GS (pale green) coupled to A2AR is compared to the position of the GTPase domain of the α subunit (pale grey) coupled to β2AR. The βγ subunits and Nb35 have been omitted for clarity. (b) Transmembrane region H1 and ECL1 in A2AR (dark green) extends closer to the β subunit (pale green), whereas β2AR (dark grey) is too far away from the β subunit (pale grey) to make extensive contacts.
Discussion
The structure determination of A2AR in complex with mini-GS, β, γ and Nb35 at a physiologically relevant pH has highlighted a number of differences to the structure determined by X-ray crystallography of A2AR coupled to mini-GS (Carpenter et al., 2016). Firstly, contacts between A2AR and the heterotrimeric G protein were identified between ICL1 and the β subunit, and between ICL2 and part of the N-terminal α-helix of the α subunit; these regions of the G protein were either absent or disordered, respectively, in the crystal structure. Secondly, the difference in pH under which the cryo-EM structure was determined (pH 7.5) compared to many X-ray structures (pH <6) led to ECL2 being more dynamic, as the potential salt bridge between His264 and Glu169 was absent, and consequently Phe168 was disordered. The implications of these observations are discussed more below.
There are now two Class A receptors whose structures have been determined coupled to heterotrimeric GS, β2AR (Rasmussen et al., 2011) and A2AR, and after this work was completed, two Class B structures coupled to GS were also published (Liang et al., 2017; Zhang et al., 2017; Liang et al., 2018). As expected the overall architecture of the receptors coupled to GS are conserved, but the details differ. The biggest difference between coupling of Class A receptors to Class B receptors is that the position of H8 in the Class B receptors is angled towards the G protein by ~30˚compared to the Class A receptors. This results in extensive contacts between H8 and the G protein β subunit that are absent in Class A receptors. All the receptor structures coupled to GS show the majority of the contacts between the α5 helix of the α subunit and H3, H5 and H6 of the receptor, with receptor-dependent contacts in H2, H7 and H8. The differences may arise partially from the subtle difference in bending of the C-terminal part of the α5 helix and the different positions of the α5 helix within the receptor, both presumably arising from the different amino acid sequences of the respective receptors. The interactions observed here between A2AR and the β subunit are also observed in the Class B receptors, but are absent from the crystal structure of the β2AR-GS structure, although a shift of the β subunit by only a few ångstroms would be sufficient for interactions to occur.
The poor density of ECL2 in the cryo-EM map of A2AR coupled to the heterotrimeric G protein, suggests that this region is more dynamic than suggested from the X-ray structures, maybe due to a pH effect that breaks the salt bridge between His264 and Glu169. This salt bridge has been suggested to be highly important in modulating the kinetics of ligand binding (Segala et al., 2016). Interestingly, a recent structure (Sun et al., 2017) of A2AR bound to compound-1 was crystallised at pH 6.5, and no crystal contacts were formed by ECL2. In this structure, the N-terminal section of ECL2 lacked density as we observed in the cryo-EM map and, in the latter region, Phe168 adopts two conformations. In one conformation, Phe168 stacks against the ligand and in the other conformation Phe168 points towards the extracellular surface (Figure 6). The ionic bridge between Glu169 and His264 seems to be present in this structure, so the two conformations of Phe168 may be a consequence of the ligand. The cryo-EM structure thus adds support to the contention that ECL2 is flexible and may be important in modulating the accessibility of the orthosteric binding site to ligands.
The cryo-EM structure presented here allows for the first time a direct comparison of the structure of a GPCR bound to an identical ligand in the same conformation as determined by cryo-EM and X-ray crystallography. This is highly interesting with respect to drug discovery where tractability and speed of the structure determination are balanced by the resolution required for a particular aspect of any given project. Cryo-EM offers a relatively fast route to the structure of a GPCR in an active conformation coupled to the heterotrimeric G protein GS. The quality of most of the cryo-EM map was very similar to the electron density map from the X-ray structure, despite the reported resolutions being 4.1 Å and 3.4 Å, respectively. This highlights the importance of the local resolution vs the global resolution in cryo-EM maps. In both cases, the ligand density was unambiguous, but adenosine is an asymmetric molecule and difficulties would have been encountered if the ligand was more symmetrical, such as caffeine. However, there is no doubt that cryo-EM is preferred in terms of overall speed; extensive protein engineering is required to obtain crystals of GPCRs (Tate and Schertler, 2009), through adding fusion proteins, deletions of flexible regions, removal of post-translational modifications and thermostabilisation. In theory, none of these modifications will be required for a cryo-EM structure, particularly as mild detergents, amphipols and nanodiscs are all compatible with structure determination of membrane proteins by cryo-EM and will maintain often quite unstable membrane proteins in a functional state (Tate, 2010). However, once a crystal structure has been determined, they can often attain much higher resolution than structures of membrane proteins obtained so far, although high-resolution cryo-EM structures are possible from single molecule imaging (Bartesaghi et al., 2015). Another current advantage of X-ray crystallography is the possibility of soaking crystals to get multiple structures of a receptor bound to different ligands through molecular replacement (Rucktooa et al., 2018). Finally, there is still a size limitation of the molecule imaged by cryo-EM for structure determination (Henderson, 1995) and experimentally this is now at about 65 kDa (Khoshouei et al., 2017). However, given the continued drive towards improving the technology of cryo-EM, there is no doubt that this technique will play a pivotal role in structure-based drug design in future years (Vinothkumar and Henderson, 2016).
Materials and methods
Expression and purification of the human adenosine A2A receptor
Request a detailed protocolConstruction of the thioredoxin-A2AR fusion protein and C-terminally truncated A2AR (1-317), both containing the N154A mutation, is described elsewhere (Nehmé et al., 2017). The constructs were expressed using the baculovirus expression system as described previously (Carpenter et al., 2016; Carpenter and Tate, 2017a). Cells were harvested by centrifugation 72 hr post-infection, resuspended in hypotonic buffer (20 mM HEPES pH 7.5, 1 mM EDTA, 1 mM PMSF, cOmplete (Roche) protease inhibitor cocktail), flash-frozen in liquid nitrogen and stored at –80°C until use. The purification of the thioredoxin-A2AR fusion protein was performed in the detergent LMNG in the presence of 100 µM NECA using Ni2+-affinity chromatography followed by SEC as described previously (Carpenter et al., 2016; Carpenter and Tate, 2017a).
Preparation of mini-Gs heterotrimer
View detailed protocolThe mini-GS construct (399) used in single particle cryo-EM reconstructions is based on the construct 393 that was used in the structure determination of the A2AR- mini-GS crystal structure (Carpenter et al., 2016; Carpenter and Tate, 2016). However, unlike construct 393, mini-GS399 binds βγ (Nehmé et al., 2017). The expression and purification of the respective components and assembly to make the complex containing mini-GS-β1γ2, and the preparation of nanobody Nb35, were all performed following the protocols described previously (Carpenter and Tate, 2016; Rasmussen et al., 2011; Carpenter and Tate, 2017b).
Preparation of the A2AR-mini-GSβ1γ2-Nb35 complex
View detailed protocolThioredoxin-A2AR, mini-GS-β1γ2 and Nb35 were mixed in a molar ratio of 1:2:4, to yield a final thioredoxin-A2AR concentration of 1 mg/ml. 0.1 U of apyrase was added and the mixture was incubated overnight at 4°C. Excess G protein and nanobody were removed by SEC on a Superdex 200 Increase column (running buffer 20 mM HEPES pH 7.5, 100 mM NaCl, 0.1% LMNG, 100 µM NECA). Peak fractions with an absorbance value at 280 nm of 1.5–2 were used immediately for grid preparation or flash frozen in liquid nitrogen and stored at –80°C until use.
Radioligand binding assays
Request a detailed protocolInsect cells expressing A2AR were resuspended in 1 ml of assay buffer (25 mM HEPES pH 7.5, 100 mM KCl, 1 mM MgCl2, protease inhibitor cocktail) at a final concentration of 3 × 10⁶ cells/ml. Cells were sheared by 10 passages through a bent 26G syringe needle. Cell membranes were diluted 50-fold to 100-fold in assay buffer and aliquots prepared as appropriate. In saturation binding assays, cell membranes containing A2AR were incubated with 3H-ZM241385 (0.1–40 nM) for 2 hr at 21°C. Non-specific binding was determined in the presence of 10 µM unlabelled ZM241385. In competition binding assays, cell membranes were incubated with NECA (1 nM - 1 µM) for 2 hr at 21°C, in the presence or absence of 25 µM mini-GS393. 5 nM 3H-ZM241385 was added followed by a 2 hr incubation. Assays were terminated by filtering through PEI-treated 96-well glass fibre GF/B filter plates (Merck Millipore, Ireland) and washing with ice-cold assay buffer. Filters were dried, placed into scintillation vials and incubated overnight in 4 ml Ultima Gold scintillant (Perkin Elmer). Radioactivity was quantified by scintillation counting using a Tri-Carb counter (Perkin Elmer). Apparent KD and apparent Ki values were determined using GraphPad Prism version 6.0 (GraphPad Software, San Diego, CA).
Cryo-EM grid preparation and data collection
Request a detailed protocolCryo-EM grids were prepared by applying 3 µl of sample (total protein concentration 1 mg/ml) on glow discharged holey gold grids (Quantifoil Au 1.2/1.3 300 mesh). Excess sample was removed by blotting with filter paper for 4–5 s prior to plunge-freezing in liquid ethane using a FEI Vitrobot Mark IV at 100% humidity and 4°C. In all cases, data was collected on a FEI Titan Krios microscope at 300kV. Data without VPP and initial VPP images were acquired using a Gatan K2-Summit detector and a GIF-quantum energy filter (Gatan) with a 20 eV slit and zero loss mode to remove inelastic scattering. For the initial non-VPP dataset, EPU automatic data collection software (FEI) was used while the VPP date set of the K2-summit detector was collected using SerialEM automatic data collection software (Mastronarde, 2005).
The non-VPP data set contained a total of 2800 micrographs, collected as 40 movie frames at a dose rate of 2 e-/pixel/sec (1.25 e-/Å2 per frame) for 10 s, with a total accumulated dose of 50 e-/Å2. The magnification was 200,000x yielding 0.66 Å/pixel at the specimen level.
The K2-VPP dataset was the result of merging three datasets with slightly different collection parameters: (a) 213 micrographs collected as 40 movie frames at 5.2 e-/pixel/s over 10 s for a total dose of 40 e-/Å2; (b) 232 micrographs collected as 23 frames at 9 e-/pixel/s over 4.6 s for a total accumulated dose of 30 e-/Å2; (c) 461 micrographs collected as 30 movie frames at a dose rate of 6 e-/pixel/s over 6.5 s for a total dose of 30 e-/Å2. In all cases the magnification was set to obtain a pixel size of 1.14 Å.
One data set was acquired using a Falcon III detector in electron counting mode by recording 75 movie frames (0.8 s per frame) at a dose rate of 0.5 e-/pixel/s (0.4 e-/Å2 per frame) for a total accumulated dose of 30 e-/Å2 acquired over a period of 60 s. Pixel size at the specimen was calibrated to be 1.07 Å. A total of 827 images were incorporated into the dataset.
Data processing and model building
Request a detailed protocolAll data processing were performed using RELION-2 (Kimanius et al., 2016). Good quality images were selected manually and drift correction, beam induced motion and dose weighting was performed for each of the datasets with MotionCor2 (Zheng et al., 2017), using 5 × 5 patches and the corresponding dose per frame. CTF fitting and phase shift estimation were performed using Gctf-v0.1.06 (Zhang, 2016). In all cases, auto-picking (Scheres, 2015) was performed with a Gaussian blob as a template (Fernandez-Leiro and Scheres, 2017). Elimination of false positives or ‘bad particles’ was performed over two rounds of reference-free 2D classification. 10,000 random particles were used for ab initio model generation using the Stochastic Deepest Descent (SDG) algorithm incorporated in RELION-2.1. The resulting model was used as input for the initial 3D classification. After a single round of 3D classification, particles in quality models were pooled together for refinement. The Falcon III-VPP data was divided into three classes, where two of them presented clear structural features resembling a GPCR-G-protein heterotrimer complex. During refinement of the Falcon III + VPP data, the low-pass filter effect of the Wiener filter in the regularised likelihood optimisation algorithm was relaxed through the use of a regularisation parameter (T = 5). This allowed the refinement algorithm to consider higher spatial frequencies in the alignment of the individual particles yielding a map of higher quality. Nevertheless, both half-reconstructions were kept completely separately, and the final resolution estimate (at the post-processing stage in RELION) was based on the standard FSC between the two unfiltered half-reconstructions. Signal subtraction of the micelle was performed as described in the results section and were used only in the last iteration of refinement. Application of ‘particle polishing’ in RELION (corrects for beam induced motion and performs experimental dose-weighting) did not improve the quality of the density. Local resolution was calculated with RELION.
Model building and refinement was carried out using the CCP-EM software suite (Burnley et al., 2017). The activated A2AR and mini-GS coordinates were taken as starting models (PDB code 5g53) together with the βγ coordinated from the β2AR complex structure (Rasmussen et al., 2011). Jelly-body refinement was performed in REFMAC5 (Murshudov et al., 2011) followed by manual modification and real space refinement in Coot (Emsley and Cowtan, 2004). Refinement with restraints (generated in ProSMART [Nicholls et al., 2012]) was performed in REFMAC5 in order to maintain the secondary structure in regions with poorer map quality. Validation of the model was performed in Coot, Molprobity (Chen et al., 2010) and EMRinger (Barad et al., 2015). The goodness of fit of the model to the map was carried out using Phenix (Adams et al., 2010), using a global model-vs-map FSC correlation (Figure 3).
Data availability
Structural data have been deposited in the PDB under the accession code 6gdg and in EMDB with accession code 4390
-
Cryo-EM structure of the adenosine A2A receptor bound to a miniGs heterotrimerPublicly available at the RCSB Protein Data Bank (accession no. 6GDG).
-
Cryo-EM structure of the adenosine A2A receptor bound to a miniGs heterotrimerPublicly available at the Electron Microscopy Data Bank (accession no. EMD-4390).
-
Structure of the adenosine A(2A) receptor bound to an engineered G protein.Publicly available at the RCSB Protein Data Bank (accession no. 5g53).
References
-
PHENIX: a comprehensive Python-based system for macromolecular structure solutionActa crystallographica. Section D, Biological crystallography 66:213–221.https://doi.org/10.1107/S0907444909052925
-
Recent developments in the CCP-EM software suiteActa Crystallographica. Section D, Structural Biology 73:469–477.https://doi.org/10.1107/S2059798317007859
-
Engineering a minimal G protein to facilitate crystallisation of G protein-coupled receptors in their active conformationProtein engineering, design & selection : PEDS 29:583–593.https://doi.org/10.1093/protein/gzw049
-
MolProbity: all-atom structure validation for macromolecular crystallographyActa Crystallographica Section D Biological Crystallography 66:12–21.https://doi.org/10.1107/S0907444909042073
-
Discovery of 1,2,4-triazine derivatives as adenosine A(2A) antagonists using structure based drug designJournal of Medicinal Chemistry 55:1898–1903.https://doi.org/10.1021/jm201376w
-
Adenosine A2A receptor as a drug discovery targetJournal of Medicinal Chemistry 57:3623–3650.https://doi.org/10.1021/jm4011669
-
Coot: model-building tools for molecular graphicsActa Crystallographica. Section D, Biological Crystallography 60:2126–2132.https://doi.org/10.1107/S0907444904019158
-
A pipeline approach to single-particle processing in RELIONActa Crystallographica. Section D, Structural Biology 73:496–502.https://doi.org/10.1107/S2059798316019276
-
International union of pharmacology. XXV. nomenclature and classification of adenosine receptorsPharmacological Reviews 53:527–552.
-
Adenosine A2A antagonists in Parkinson's disease: what's next?Current Neurology and Neuroscience Reports 12:376–385.https://doi.org/10.1007/s11910-012-0279-2
-
Cryo-EM structure of haemoglobin at 3.2 å determined with the volta phase plateNature Communications 8:16099.https://doi.org/10.1038/ncomms16099
-
Molecular determinants of CGS21680 binding to the human adenosine A2A receptorMolecular Pharmacology 87:907–915.https://doi.org/10.1124/mol.114.097360
-
Agonist-bound structures of G protein-coupled receptorsCurrent Opinion in Structural Biology 22:482–490.https://doi.org/10.1016/j.sbi.2012.03.007
-
A2aR antagonists: next generation checkpoint blockade for Cancer immunotherapyComputational and Structural Biotechnology Journal 13:265–272.https://doi.org/10.1016/j.csbj.2015.03.008
-
Automated electron microscope tomography using robust prediction of specimen movementsJournal of Structural Biology 152:36–51.https://doi.org/10.1016/j.jsb.2005.07.007
-
REFMAC5 for the refinement of macromolecular crystal structuresActa Crystallographica Section D Biological Crystallography 67:355–367.https://doi.org/10.1107/S0907444911001314
-
Low-resolution refinement tools in REFMAC5Acta Crystallographica. Section D, Biological Crystallography 68:404–417.https://doi.org/10.1107/S090744491105606X
-
RELION: implementation of a bayesian approach to cryo-EM structure determinationJournal of Structural Biology 180:519–530.https://doi.org/10.1016/j.jsb.2012.09.006
-
Semi-automated selection of cryo-EM particles in RELION-1.3Journal of Structural Biology 189:114–122.https://doi.org/10.1016/j.jsb.2014.11.010
-
Controlling the dissociation of ligands from the adenosine A2A receptor through modulation of salt bridge strengthJournal of Medicinal Chemistry 59:6470–6479.https://doi.org/10.1021/acs.jmedchem.6b00653
-
Engineering G protein-coupled receptors to facilitate their structure determinationCurrent Opinion in Structural Biology 19:386–395.https://doi.org/10.1016/j.sbi.2009.07.004
-
Practical considerations of membrane protein instability during purification and crystallisationMethods in Molecular Biology 601:187–203.https://doi.org/10.1007/978-1-60761-344-2_12
-
Binding of an alpha 2 adrenergic receptor third intracellular loop peptide to G beta and the amino terminus of G alphaThe Journal of Biological Chemistry 269:27618–27624.
-
Receptor and membrane interaction sites on gbeta. A receptor-derived peptide binds to the carboxyl terminusThe Journal of Biological Chemistry 271:3336–3339.
-
Single particle electron cryomicroscopy: trends, issues and future perspectiveQuarterly Reviews of Biophysics 49:e13.https://doi.org/10.1017/S0033583516000068
-
Gctf: real-time CTF determination and correctionJournal of Structural Biology 193:1–12.https://doi.org/10.1016/j.jsb.2015.11.003
Article and author information
Author details
Christopher G Tate

Funding
Medical Research Council (U105197215)
- Christopher G Tate
European Research Council (EMPSI 339995)
- Christopher G Tate
Heptares Therapeutics
- Christopher G Tate
Pfizer UK
- Christopher G Tate
The funders had no role in study design, data collection and interpretation, or the decision to submit the work for publication.
Acknowledgements
This work was funded by a grant from the European Research Council (EMPSI 339995) Heptares Therapeutics Ltd, Pfizer and core funding from the Medical Research Council [MRC U105197215]. We thank Rishi Matadeen and Kasim Sader for their help with cryo-EM data collection, Christos Savva for his help in using the VPP and Wim Hagen for the SerialEM single-particle data collection script. We also thank Rafael Fernandez-Leiro, Sjors Scheres and Paula da Fonseca for useful discussions.
Version history
- Received: February 14, 2018
- Accepted: May 2, 2018
- Accepted Manuscript published: May 4, 2018 (version 1)
- Version of Record published: May 21, 2018 (version 2)
Copyright
© 2018, García-Nafría et al.
This article is distributed under the terms of the Creative Commons Attribution License, which permits unrestricted use and redistribution provided that the original author and source are credited.
Metrics
-
- 9,842
- views
-
- 1,655
- downloads
-
- 177
- citations
Views, downloads and citations are aggregated across all versions of this paper published by eLife.
Download links
A two-part list of links to download the article, or parts of the article, in various formats.
Downloads (link to download the article as PDF)
Open citations (links to open the citations from this article in various online reference manager services)
Cite this article (links to download the citations from this article in formats compatible with various reference manager tools)
Cryo-EM structure of the adenosine A2A receptor coupled to an engineered heterotrimeric G protein
eLife 7:e35946.
https://doi.org/10.7554/eLife.35946
Further reading
-
- Biochemistry and Chemical Biology
- Structural Biology and Molecular Biophysics
NADPH oxidases (NOX) are transmembrane proteins, widely spread in eukaryotes and prokaryotes, that produce reactive oxygen species (ROS). Eukaryotes use the ROS products for innate immune defense and signaling in critical (patho)physiological processes. Despite the recent structures of human NOX isoforms, the activation of electron transfer remains incompletely understood. SpNOX, a homolog from Streptococcus pneumoniae, can serves as a robust model for exploring electron transfers in the NOX family thanks to its constitutive activity. Crystal structures of SpNOX full-length and dehydrogenase (DH) domain constructs are revealed here. The isolated DH domain acts as a flavin reductase, and both constructs use either NADPH or NADH as substrate. Our findings suggest that hydride transfer from NAD(P)H to FAD is the rate-limiting step in electron transfer. We identify significance of F397 in nicotinamide access to flavin isoalloxazine and confirm flavin binding contributions from both DH and Transmembrane (TM) domains. Comparison with related enzymes suggests that distal access to heme may influence the final electron acceptor, while the relative position of DH and TM does not necessarily correlate with activity, contrary to previous suggestions. It rather suggests requirement of an internal rearrangement, within the DH domain, to switch from a resting to an active state. Thus, SpNOX appears to be a good model of active NOX2, which allows us to propose an explanation for NOX2’s requirement for activation.
-
- Biochemistry and Chemical Biology
- Plant Biology
Metabolism and biological functions of the nitrogen-rich compound guanidine have long been neglected. The discovery of four classes of guanidine-sensing riboswitches and two pathways for guanidine degradation in bacteria hint at widespread sources of unconjugated guanidine in nature. So far, only three enzymes from a narrow range of bacteria and fungi have been shown to produce guanidine, with the ethylene-forming enzyme (EFE) as the most prominent example. Here, we show that a related class of Fe2+- and 2-oxoglutarate-dependent dioxygenases (2-ODD-C23) highly conserved among plants and algae catalyze the hydroxylation of homoarginine at the C6-position. Spontaneous decay of 6-hydroxyhomoarginine yields guanidine and 2-aminoadipate-6-semialdehyde. The latter can be reduced to pipecolate by pyrroline-5-carboxylate reductase but more likely is oxidized to aminoadipate by aldehyde dehydrogenase ALDH7B in vivo. Arabidopsis has three 2-ODD-C23 isoforms, among which Din11 is unusual because it also accepted arginine as substrate, which was not the case for the other 2-ODD-C23 isoforms from Arabidopsis or other plants. In contrast to EFE, none of the three Arabidopsis enzymes produced ethylene. Guanidine contents were typically between 10 and 20 nmol*(g fresh weight)-1 in Arabidopsis but increased to 100 or 300 nmol*(g fresh weight)-1 after homoarginine feeding or treatment with Din11-inducing methyljasmonate, respectively. In 2-ODD-C23 triple mutants, the guanidine content was strongly reduced, whereas it increased in overexpression plants. We discuss the implications of the finding of widespread guanidine-producing enzymes in photosynthetic eukaryotes as a so far underestimated branch of the bio-geochemical nitrogen cycle and propose possible functions of natural guanidine production.


