


Abstract
The age-dependent absolute protein abundance of carboxylesterase (CES) 1 and CES2 in human liver was investigated and applied to predict infant pharmacokinetics (PK) of oseltamivir. The CES absolute protein abundance was determined by liquid chromatography-tandem mass spectrometry proteomics in human liver microsomal and cytosolic fractions prepared from tissue samples obtained from 136 pediatric donors and 35 adult donors. Two surrogate peptides per protein were selected for the quantification of CES1 and CES2 protein abundance. Purified CES1 and CES2 protein standards were used as calibrators, and the heavy labeled peptides were used as the internal standards. In hepatic microsomes, CES1 and CES2 abundance (in picomoles per milligram total protein) increased approximately 5-fold (315.2 vs. 1664.4) and approximately 3-fold (59.8 vs. 174.1) from neonates to adults, respectively. CES1 protein abundance in liver cytosol also showed age-dependent maturation. Oseltamivir carboxylase activity was correlated with protein abundance in pediatric and adult liver microsomes. The protein abundance data were then used to model in vivo PK of oseltamivir in infants using pediatric physiologically based PK modeling and incorporating the protein abundance–based ontogeny function into the existing pediatric Simcyp model. The predicted pediatric area under the curve, maximal plasma concentration, and time for maximal plasma concentration values were below 2.1-fold of the clinically observed values, respectively.
Introduction
Because clinical dose optimization studies often have not been conducted in children, a majority of the drugs used in pediatrics are prescribed off-label (Kimland et al., 2012; Laughon et al., 2014). This suboptimal practice could be unsafe because children, especially neonates and infants, may be susceptible to adverse drug effects or lack of drug efficacy due to their insufficient ability to metabolically eliminate or activate drugs (Hines et al., 2013). For example, Gray baby syndrome resulted in serious adverse effects when the antibiotic chloramphenicol was given to infants in whom immature glucuronidation resulted in reduced clearance of the drug (Sutherland, 1959). Therefore, the current approach to predicting pediatric drug dosing, which relies on empirical body weight or body surface area normalization, should also consider the developmental trajectories of processes involved in drug disposition and response. One solution is to use pediatric physiologically based pharmacokinetic (pPBPK) models, which can be developed by integrating information on relevant age-dependent physiologic differences, for dose-exposure simulations in children as an alternative to applying scaling factors to models based on adult data. In the currently available pPBPK models, different physiologic factors affecting drug disposition, such as organ size, tissue composition, pH in the gastrointestinal (GI) tract, and body fluid dynamics, are taken into consideration (Zhao et al., 2011). However, a major limitation of existing pPBPK models is the limited availability of precise developmental trajectories for major drug-metabolizing enzymes (DMEs) and transporters in the drug disposition organs. Therefore, it is critical to study the developmental expression and activity of DMEs and drug transporters (Prasad et al., 2016).
Carboxylesterases (CESs) are DMEs in the α-β hydrolase family, which metabolize many compounds, including drugs containing ester, thioester, and amide bonds and environmental toxins such as phthalates and benzoates. Cocaine (Pindel et al., 1997), heroin (Kamendulis et al., 1996), clopidogrel (Tang et al., 2006), aspirin (Tang et al., 2006), methylphenidate (Merali et al., 2014), enalapril/ramipril (Thomsen et al., 2014), oseltamivir (Shi et al., 2006), and irinotecan (Haaz et al., 1997) are some examples of drugs and prodrugs that undergo phase I metabolism by CESs, most of which are prescribed to children. In this study, hepatic CES1 and CES2 protein abundance in different pediatric age groups was determined and compared with the observed protein abundance in adults. Although ontogeny data for hepatic CES1 and CES2 have been reported previously (Yang et al., 2009; Hines et al., 2016), we used a state-of-the-art liquid chromatography-tandem mass spectrometry (LC-MS/MS)–based absolute protein quantification approach to quantify age-dependent expression of these proteins in a large cohort of well-studied pediatric and adult samples. Subsequently, the ontogeny data were incorporated into the Simcyp PBPK software (Certara, Princeton, NJ) to predict in vivo pharmacokinetics (PK) of oseltamivir in infants.
Materials and Methods
Materials.
Synthetic heavy labeled peptides (Supplemental Table 1) were obtained from Thermo Fisher Scientific (Rockford, IL). Chloroform, ethyl ether, Optima MS-grade acetonitrile, methanol, and formic acid were purchased from Thermo Fisher Scientific (Fair Lawn, NJ). Ammonium bicarbonate (98% purity) and sodium deoxycholate (98% purity) were obtained from Thermo Fisher Scientific and MP Biomedicals (Santa Ana, CA), respectively. CES1 and CES2 protein standards were procured from Abcam (Cambridge, MA) and Abnova (Walnut, CA), respectively. Oseltamivir was procured from BioTang Inc. (Waltham, MA).
Human Liver Microsomes.
Thirty-five adult and seven pediatric liver tissue samples were procured from the Liver Bank of the University of Washington School of Pharmacy (Prasad et al., 2014). Procurement and storage information as well as characteristics of these tissue samples were described previously (Paine et al., 1997). Additionally, human liver microsomal and cytosolic samples from 129 pediatric donors were obtained from the Eunice Kennedy Shriver National Institute of Child Health and Human Development Brain and Tissue Bank for Developmental Disorders at the University of Maryland; and the Liver Tissue Cell Distribution System at the University of Minnesota and the University of Pittsburgh. Additional postnatal liver samples were obtained from Vitron (Tucson, AZ) and Sekisui XenoTech, LLC (Kansas City, KS). The samples were stratified based on the following age categories: neonatal (0–27 days; n = 4), infancy (28–364 days; n = 17), early childhood (1 to <6 years; n = 30), middle childhood (6 to <12 years; n = 37), adolescence (12–18 years; n = 48), and adulthood (>18 years; n = 35) (Williams et al., 2012). The microsomal and cytosolic fractions from all samples were prepared using established protocols (Gibbs et al., 1996; Shirasaka et al., 2015; Pearce et al., 2016). Detailed donor demographic information is provided in Supplemental Table 2. Use of these tissues has been classified as nonhuman subject research by the Institutional Review Boards of the University of Washington (Seattle, WA) and Children’s Mercy Kansas City (Kansas City, MO).
Protein Denaturation, Reduction, Alkylation, Enrichment, and Trypsin Digestion.
The purified protein standards as well as microsomal and cytosolic samples were digested by trypsin, as described previously (Shirasaka et al., 2015) with few modifications. Briefly, each sample or standard was aliquoted into three tubes and individually digested using trypsin. The digested samples were processed and analyzed by LC-MS/MS on 3 different days to account for potential technical variability. The working calibration curve standards were prepared by diluting purified CES1 and CES2 proteins with 50 mM phosphate buffer (pH 7.4) to generate working concentrations ranging from 15 to 7680 pmol/ml (CES1; number of points on curve = 10) and from 3.5 to 448 pmol/ml (CES2; number of points on curve = 8). Ten microliters of the working calibration curve standards was added to 70 µl of phosphate buffer. Subsequently, 80 μl of the standard or sample (2 mg/ml) was combined with 10 μl of dithiothreitol (250 mM), 40 µl of ammonium bicarbonate buffer (100 mM, pH 7.8), and 20 μl of deoxycholic acid (10%). Ten microliters of human serum albumin (10 mg/ml for microsomal samples) or 10 μl each of human and bovine serum albumin (10 and 2 mg/ml, respectively, for cytosolic samples) were added as the protein internal standard to address sample-to-sample variability in the trypsin digestion. The mix was then incubated at 95° for 10 minutes with gentle shaking at 300 rpm. Samples were cooled to room temperature for 10 minutes before adding 20 µl of iodoacetamide (500 mM) for incubation at room temperature in the dark for 30 minutes. Five hundred microliters of ice-cold methanol, 100 µl of ice-cold chloroform, and 400 µl of cold water were added to each sample; vortex mixed; and subjected to centrifugation at 16,000g (4°C) for 5 minutes. The upper and lower layers were removed using vacuum suction, and pellets were dried at room temperature for 10 minutes. Pellets were subsequently washed with 500 µl of ice-cold methanol and subjected to centrifugation at 8000g (4°C) for 5 minutes, after which the supernatant was removed. Pellets were dried at room temperature for 30 minutes and resuspended in 60 µl of ammonium bicarbonate buffer (50 mM, pH 7.8). Twenty microliters of trypsin (0.16 µg/µl) was added for digestion (37°C, 16 hours, gentle shaking at 300 rpm). The trypsin digestion was quenched by placing samples on dry ice. Twenty microliters of heavy peptide internal standard cocktail [dissolved in acetonitrile/water 80:20 (v/v) with 0.5% formic acid] and 10 µl of acetonitrile/water 80:20 (v/v) with 0.5% formic acid were added to each sample to facilitate peptide solubility. After mixing and centrifugation at 4000g (4°C) for 5 minutes, samples were transferred to LC-MS/MS autosampler vials.
Quantitative Analysis of CESs by LC-MS/MS.
The LC-MS/MS system consisted of an Acquity UPLC System (Waters Technologies, Milford, MA) coupled to an AB Sciex Triple Quad 6500 System (Applied Biosystems, Framingham, MA) was used. Two surrogate peptides per protein were selected for the quantification of CES1 and CES2 protein abundance (Supplemental Table 1) following a previously established protocol (Prasad and Unadkat, 2014). Peptide separation was achieved on an Acquity UPLC column (HSS T3 1.8 μm; 2.1 × 100 mm; Waters Technologies). Mobile phases A and B consisted of water with formic acid 0.1% (v/v) and acetonitrile with formic acid 0.1% (v/v), respectively. Peptides were eluted under gradient conditions at a flow rate of 0.3 ml/min (Supplemental Table 1). Multiple reaction monitoring (MRM) conditions for targeted analysis of CES1 and CES2 surrogate peptides are provided in Supplemental Table 1. Peak integration and quantification were performed using Analyst software (version 1.6; Mass Spectrometry Toolkit version 3.3; SCIEX, Framingham, MA).
In Vitro Metabolic Stability of Oseltamivir.
Because of the limited availability of pediatric samples, the oseltamivir depletion activity assay was only performed in a small subset of adult (n = 7) and pediatric (n = 8) samples. Oseltamivir (100 nM) was incubated at 37°C with 50 μl microsomal sample (total protein concentration, 100 μg/ml) diluted in 50 mM phosphate buffer (pH 7.4). Samples were pre-incubated at 37°C for 5 minutes before the reaction was initiated by adding 5 μl of 1 µM oseltamivir (100 nM, final concentration). The concentration of acetonitrile used to prepare oseltamivir stock solution in the in vitro metabolic stability assay was below 0.5% (v/v). To terminate the reaction, samples were transferred to a tube with 50 μl ice-cold acetonitrile containing internal standard diazepam (∼5 ng/ml). Oseltamivir was also incubated in 50 μl of phosphate buffer at 37°C as a control for chemical degradation in the same manner. Reaction mixtures were centrifuged at 5000 × g (4°C) for 5 minutes to remove precipitated protein and supernatants transferred to LC-MS/MS autosampler vials. All in vitro metabolic stability assays were done in triplicate and the observed results are presented as the mean of the three analyses ± standard deviation.
LC-MS/MS Method Optimization and Quantification of Oseltamivir.
LC-MS/MS system consisting of an Acquity UPLC (Waters Technologies) coupled to an AB Sciex Triple Quad 6500 System (Applied Biosystems) was used to quantify metabolic depletion of oseltamivir. An Acquity UPLC BEH C18 1.7 μm, 2.1 × 50 mm column was used with a flow rate of 0.3 ml/min and a gradient program shown in Supplemental Table 1. The column temperature was set to 25°C. The MRM parameters for oseltamivir were m/z values of 313.3 → 208.2 (collision energy (CE)/declustering potential (DP), 19/56), 166.2 (CE/DP, 25/56), and 120.2 (CE/DP, 45/56). The MRM parameters for the internal standard diazepam were m/z values 285.1 → 193 and 285.1 → 154.0 (CE/DP, 40/100). Peak integration and quantification were performed using Analyst software (version 1.6; Mass Spectrometry Toolkit version 3.3).
PBPK Model Development and Validation for Oseltamivir PK in Adults.
The PBPK model for oseltamivir was developed using Simcyp Simulator (version 15; Simcyp, Sheffield, UK). System-dependent PBPK model parameters like organ weight, body composition, and blood flow rates were already integrated into the software, whereas drug-dependent parameters and CES1 developmental trajectory were added to the model (Table 1). The permeability was predicted in Simcyp using the lipophilicity and polar surface area of oseltamivir. The advanced dissolution, absorption, and metabolism model was applied in the PBPK model. For the distribution of oseltamivir, the minimal PBPK model was used. The tissue plasma partition coefficient for liver was obtained using the prediction method of Poulin and Theil (2002). The distribution volume at steady state was estimated by fitting the model to available in vivo data in adults (Hu et al., 2014). For oseltamivir, CES1 was considered to be the only metabolic pathway in the model. The intrinsic clearance (CLint) was extrapolated from reported in vitro data (Nishimuta et al., 2014). After simulation in Simcyp, the mean concentration-time profile was compared with profiles constructed from adult in vivo data for oseltamivir (Wattanagoon et al., 2009; Hu et al., 2014).
Physicochemical properties, absorption, distribution, and elimination characteristsics used for oseltamivir PBPK model development
Extension of Adult PBPK Model to Predict Oseltamivir PK in Infants (0–1 Year of Age).
Since oseltamivir is a selective CES1 substrate (Laizure et al., 2013), the validated adult parameters were run in the Simcyp pediatric model with the addition of age-dependent CES1 protein abundance data from this study (Table 1). A nonlinear regression equation (Table 1) was used to fit the ontogeny data, as described previously (Johnson et al., 2006). Since CES1 is functionally active in both microsomal and cytosolic fractions, the ontogeny equation was derived based on the total microsomal plus cytosolic abundance of CES1 per gram of liver tissue. To do so, reported values of milligrams of microsomal and cytosolic proteins per gram of liver tissue (39.8 and 80.7 mg/ml, respectively) were used to first obtain microsomal and cytosolic CES1 abundance per gram of liver tissue (Nishimuta et al., 2014). Then, the total microsomal plus cytosolic abundance of CES1 per gram of liver tissue was derived by adding the two values. Finally, the Simcyp input values (i.e., adult normalized fractional values) were derived by considering a maximum average relative protein abundance (Adultmax) equal to 1. The pediatric simulated mean concentration profile for oseltamivir was compared with in vivo data from infants (Kamal et al., 2014). Visual inspection and statistical analyses were conducted to assess the performance and accuracy of the pPBPK model. The pPBPK model predictions were determined to be successful if the predicted mean plasma concentration overlapped the observed in vivo values from the literature between the predicted 5th and 95th percentile intervals of the plasma concentrations for oseltamivir. The mean PK parameters prediction was determined to be successful if the predicted/observed ratio for the mean PK parameters were within the 0.5–2 ratio window.
Statistical Analysis.
Nonparametric tests were used to test age or genotype dependence. For individual categories (neonates to adults), age-dependent data analysis was performed using the Kruskal-Wallis test followed by the Dunn multiple-comparison test. To compare two groups (e.g., the effects of sex, ethnicity, or variant alleles) the Mann-Whitney test was used. A nonlinear regression model with baseline protein abundance (Table 1) (GraphPad Prism; GraphPad, San Diego, CA) was fitted to the continuous ontogenic protein abundance data. The goodness of model fit was evaluated by visual inspection, 95% confidence intervals (CIs) of the parameter estimates and residual plots. Weights of 1/Y2 were used. For correlation analysis, the nonparametric Spearman regression test was used because the data were asymmetrically distributed. A P value <0.05 was considered to be statistically significant. The observed data were illustrated in graphs and tables using Microsoft Excel (version 14; Microsoft, Redmond, WA) and GraphPad Prism (GraphPad).
Results
Age-Dependent Protein Abundance of CES1 and CES2
Two different peptides of both CES1 and CES2 showed excellent correlation (r2 > 0.9), indicating the robustness of absolute protein quantification by LC-MS/MS (Fig. 1). The lower limits of quantification for CES1 and CES2 were 0.15 and 0.35 fmol (on column), respectively. Both the absolute abundance and interindividual variability of CES1 in liver tissue were higher than CES2. For example, CES1 was 9.6-fold higher than CES2 in adult human liver microsomes (1664.4 ± 781.7 and 174.1 ± 105.7 pmol/mg microsomal protein, respectively; Table 2). CES1 abundance was more variable (25.4–4015.4 pmol/mg microsomal protein; 158.1-fold variability) compared with CES2 (15.6–527.3 pmol/mg microsomal protein; 33.8-fold variability). To investigate the factors affecting the protein abundance of CES1 and CES2, the data were stratified and analyzed based on age, sex, and ethnicity. Nonlinear regression of the microsomal protein abundance data revealed that the expression of CES1 and CES2 protein was 50% of the values observed in adults by approximately 7.4 months (0.62 years) and 3 weeks (0.06 years), respectively. The exponential factor (n, arbitrary units) describing the developmental curve for CES1 and CES2 was similar (0.53 vs. 0.59, respectively). Stratifying by age as a categorical variable, the microsomal CES1 protein abundance was 5.3-fold (P < 0.0001) higher in adults compared with neonates (Fig. 2; Table 2). Similarly, neonatal CES1 abundance was significantly lower compared with that observed in early childhood, middle childhood, and adolescence (Fig. 2). Furthermore, microsomal CES1 abundance was lower in infants compared with early childhood, middle childhood, adolescence, and adulthood. The average absolute cytosolic content of CES1 (in picomoles per milligram of protein) was 3.2-fold lower than the microsomal abundance across the entire age range (Fig. 3A; Table 2). Cytosolic hepatic CES1 expression levels were also age dependent, as evidenced by the 3.1-fold difference between neonatal and adult samples (Fig. 3B). Because of the limited availability of pediatric samples, the esterase activity assay was conducted only in a subset of samples. A 2.4-fold difference (P < 0.05) in oseltamivir biotransformation was observed among adult (n = 7) and pediatric samples (n = 8) (relative rate of elimination of 61.7 ± 32.9 and 25.9 ± 22.3/min, respectively) (Fig. 4). A correlation was observed between CES1 protein abundance and hepatic esterase activity (r = 0.64; Spearman correlation, P < 0.05). CES2 expression was also found to be age dependent, although the difference was observed only between the neonate and adolescent age groups. No significant difference in CES2 protein abundance was observed between other groups (Fig. 2). Together, the relative CES1/CES2 ratio in liver microsomes increases during human development with relative percentages of 84:16 (neonates and infants) to 91:9 (adults) (Supplemental Fig. 1). No effect of sex or ethnicity was observed on CES1 and CES2 protein abundance (Supplemental Fig. 2). The CES2 peptides could not be reliably quantified in the cytosolic fractions because of low protein abundance.

Correlation between two peptides for CES1 (A) and CES2 (B) used for absolute protein quantification (in picomoles per milligram microsomal proteins).
Age-dependent protein abundance (pmol/mg total protein, mean ± SD) of CES1, CES2 and total CES1 plus CES2 in human liver microsomes and cytosols

Hepatic microsomal CES1 and CES2 protein abundance during human development [categorical (A) and continuous (B)]. Age classification: neonatal (0–27 days), infancy (28–364 days), early childhood (1 to <6 years), middle childhood (6 to <12 years), adolescence (12–18 years), and adulthood (>18 years). The number of subjects in each age category is indicated in parentheses on the x-axis of categorical data. Dot plots are displayed with mean protein abundance as the horizontal line. The error bar displays the SD, with individual maximum and minimum values shown in the dot plot. *, **, and *** indicate P values of <0.05, <0.001, and <0.0001, respectively.

Hepatic cytosolic CES1 protein abundance in different age categories (A) and correlation of microsomal (Fig. 2) and cytosolic CES1 protein abundance (B). Age classification: neonatal (0–27 days), infancy (28–364 days), early childhood (1 to <6 years), middle childhood (6 to <12 years), adolescence (12–18 years), and adulthood (>18 years). Dot plots are displayed with mean protein abundance as the horizontal line. The error bar displays the SD, with individual maximum and minimum values shown in the dot plot. * and *** indicate P values of <0.05 and <0.0001, respectively.

Oseltamivir activity in representative adult (n = 7) and pediatric (n = 8) samples. CES1 activity was determined using oseltamivir metabolism to the corresponding carboxylate.
Correlation of CES1 and CES2 Protein Abundance
CES1 and CES2 protein abundances were significantly correlated across the entire pediatric and adult cohorts (r2 = 0.49; Spearman correlation, P < 0.05). As shown in Fig. 5, higher CES1 protein abundance was associated with higher CES2 protein abundance, suggesting that CES1 and CES2 expression may be coregulated. Interestingly, the correlation between these proteins was stronger in the younger age groups compared with adults (Supplemental Fig. 3). The slopes were slightly different between age groups; however, a larger number of samples is needed to confirm the age-related differences in the regulation of CES1 and CES2.

Correlation of CES1 and CES2 protein abundance in human liver microsomes. The correlation was determined to be significant by a Spearman correlation test (P < 0.0001).
pPBPK Modeling Predictions for Oseltamivir Disposition in Adults and Infants
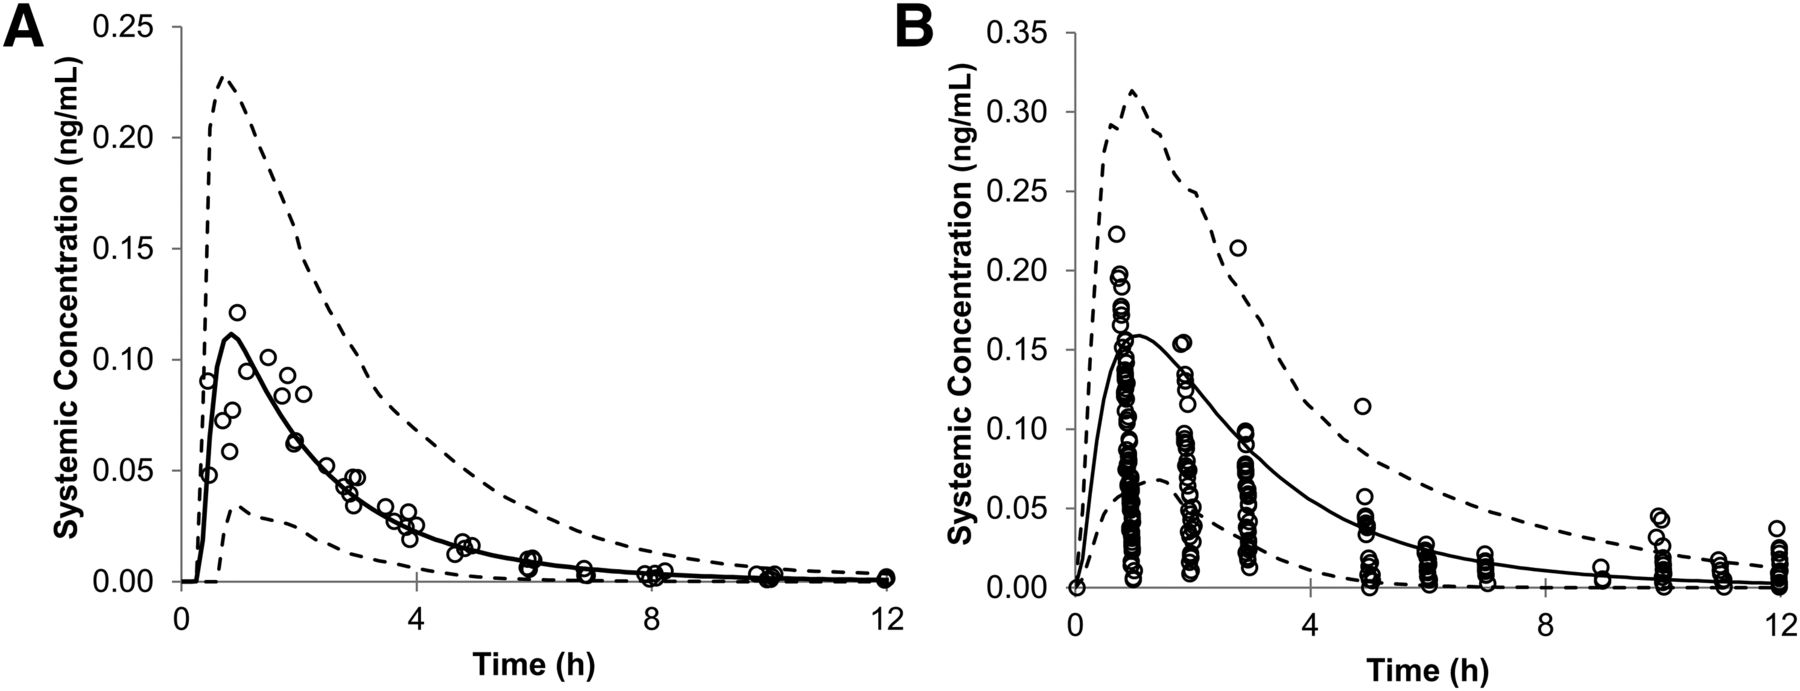
The predicted mean plasma concentration of oseltamivir in adults and infants after 150 mg and 3 mg/kg oral administration are shown in Fig. 6, A and B, respectively. These predicted curves were similar to those previously observed in clinical data (Wattanagoon et al., 2009; Hu et al., 2014; Kamal et al., 2014). The prediction of the mean PK parameters, area under the curve& (AUC), maximal plasma concentration (Cmax), and time for Cmax (Tmax) were within a 0.5- to 2.1-fold window of the observed data (Table 3).

Mean predicted systemic concentration of oseltamivir (black line) in adults after 150-mg oral administration (A) and in infants after 3 mg/kg oral administration (B) with the predicted 5th and 95th percentile CIs (dotted lines) plotted. The circles represent the observed in vivo values from the literature. The observed in vivo values were inside the predicted 5th to 95th percentile interval for adults. Some of the observed pediatric values are below the 5th percentile and above the 95th percentile of the predicted values.
The virtual clinical trials design and observed and predicted mean PK parameters for oseltamivir in adults and infants
Discussion
Although CES1 and CES2 protein expression data have been reported previously (Yang et al., 2009; Hines et al., 2016), our data present absolute protein quantification by LC-MS/MS methodology in a large cohort of well-characterized pediatric as well as adult subjects. Compared with traditional immunoquantification, LC-MS/MS proteomics has emerged as a superior protein quantification method (Aebersold et al., 2013). LC-MS/MS proteomics offers many advantages, such as selectivity, precision, accuracy, and short analysis time. Additionally, the correlation between multiple peptides per protein indicates the robustness of this method. At an absolute level, CES1 was found to be one of the most highly expressed DMEs in the liver. For example, CES1 abundance in the liver is ∼20- to 30-fold higher than the most abundant adult cytochrome P450 enzyme, CYP3A4 (Achour et al., 2014). Interestingly, although the absolute abundance values of CES1 and CES2 presented in this study are consistent with those reported by other LC-MS/MS proteomics studies (Sato et al., 2012; Wang et al., 2016), the values reported by Hines et al. (2016) are significantly lower, which might be due to the methodological differences (i.e., LC-MS/MS proteomics versus immunoblotting).
Irrespective of the absolute values, our results are consistent with reported data regarding an age-related relative increase of CES1 and CES2. Hines et al. (2016) recently reported that the expression of CES1 and CES2 increases rapidly after birth, with median microsomal CES1 content lower among samples from subjects younger than 3 weeks of age (n = 36) compared with subjects older than 3 weeks to 18 years of age (6.27 vs. 17.5 pmol/mg microsomal protein, respectively). Similarly, CES2 microsomal content was reported as 1.8, 2.9, and 4.2 pmol/mg microsomal protein, in samples from donors younger than 3 weeks, 3 weeks to 6 years, and 6–18 years of age, respectively, using classification tree analysis to determine the age-related breakpoints in the developmental trajectories (Hines et al., 2016). The 319-fold and 55-fold lower mRNA expression levels, respectively, of CES1 and CES2 were observed in fetal compared with adult liver samples (Yang et al., 2009). In a limited number of liver tissue samples from children between 0 and 10 years of age, the observed CES1 protein expression was 4-fold lower than that in adult samples (Yang et al., 2009). Consistent with our data, Shi et al. (2011) and Chen et al. (2015) have also reported age-dependent relative changes in CES1 and CES2 hepatic activity. The suggested variability in age-dependent CES1 protein expression level is confirmed in this study and compared with the adult data. However, the combination of absolute protein quantitation and a relatively large sample number together with nonlinear regression analysis allowed us to investigate in more detail the actual developmental trajectory for postnatal CES expression, with the microsomal CES1 expression reaching levels half that observed in adults by approximately 7 months of age, and CES2 expression reaching the same level much earlier (at 3 weeks of age). Since there was no association between sex or ethnicity and CES1 and CES2 protein abundance, these factors are unlikely to confound data interpretation.
The correlation of CES1 and CES2 protein abundances suggests that the expression of these enzymes is likely to be coregulated, where these enzymes are either induced or suppressed by at least one similar molecular mechanism. The coregulation mechanisms of CES gene expression is still unknown. However, both genes are located in close proximity to one another on chromosome 16 (CES1 on Ch16q12.2 and CES2 at Ch16q22.1) (Langmann et al., 1997; Merali et al., 2014), which might explain the coregulation of the expression of the two CES proteins. Knowledge about the coregulated expression of DMEs is important for PBPK modeling (Achour et al., 2014).
The protein abundance data of CES1, when integrated into a pPBPK model, predicted the majority of oseltamivir PK data in infants. Such an ontogeny-based approach has been successfully used recently to predict pediatric drug disposition of acetaminophen (Jiang et al., 2013). Together, the CES1 absolute ontogeny data presented here show a difference in the prodrug-metabolizing capacities of neonates and infants versus those of older children and adults. CES ontogeny-based pPBPK models can be used to predict the first-in-child dose of prodrugs and ester/amide drugs to minimize the risk of toxicities and avoid unnecessary drug exposure in this vulnerable population. In general, esters are prone to penetration across the blood-brain barrier compared with their acid metabolites. Therefore, a better understanding of CES ontogeny can predict adverse neurologic effects in children, as reported in the case of oseltamivir (Dalvi et al., 2011). Moreover, ontogeny-based pPBPK models can also be used to predict exposure and detoxification mechanisms for ester- or amide-based environmental toxins, such as pesticides and flame retardants.
Our study has a few limitations. For instance, neonatal data should be interpreted with caution because we were only able to obtain four samples from the age group up to 27 days of age. Further studies are also warranted to investigate the mechanisms coregulating CES1 and CES2 protein expression and to determine its biologic significance. Finally, some of the observed data points (Fig. 6B) were below the 5% or above the 95% CI, suggesting that a pPBPK model based on sparse activity data is inadequate to model oseltamivir PK in this age group. It is also possible that other esterase pathways may be involved in oseltamivir elimination, or CES1 or CES2 expression in extrahepatic tissues may contribute to oseltamivir clearance.
In summary, CES1 is a major esterase enzyme in the liver with 9.6-fold higher abundance than CES2. CES1 is also more variable than CES2, and the ontogeny is one of the significant contributors to the observed variability. These data will be useful to derive scaling factors to predict age-dependent hepatic clearance of CES substrates via pPBPK modeling and simulations.
Acknowledgments
We thank Prachi Jha, Department of Pharmaceutics, University of Washington, for assistance with the LC-MS/MS data analysis.
Authorship Contributions
Participated in research design: Boberg, Vrana, Pearce, Gaedigk, Leeder, and Prasad
Conducted experiments: Boberg, Vrana, Mehrotra, Bhatt, and Prasad
Performed data analysis: Boberg, Vrana, Mehrotra, Bhatt, and Prasad
Wrote or contributed to the writing of the manuscript: Boberg, Vrana, Mehrotra, Pearce, Gaedigk, Bhatt, Leeder, and Prasad
Footnotes
- Received July 22, 2016.
- Accepted November 22, 2016.
M.B. and M.V. contributed equally to this work.
The study was supported by the Eunice Kennedy Shriver National Institute of Child Health and Human Development (NICHD) of the National Institutes of Health [NIH; Grant R01-HD-081299]. The project, entitled “Laboratory of Developmental Biology,” was supported by an award from the Eunice Kennedy Shriver NICHD of the NIH [Award 5R24-HD-0008836]. Human liver microsomal and cytosolic samples from pediatric donors were obtained from the Eunice Kennedy Shriver NICHD Brain and Tissue Bank for Developmental Disorders at the University of Maryland [funded by NIH Contract HHSN275200900011C, reference number N01-HD-9-0011]; and from the Liver Tissue Cell Distribution System [funded by NIH Contract N01-DK-7-0004/HHSN267200700004C] at the University of Minnesota and the University of Pittsburgh.
↵
 This article has supplemental material available at dmd.aspetjournals.org.

Abbreviations
- Adultmax
- adult maximum average relative protein abundance
- AUC
- area under the curve
- CES
- carboxylesterase
- CI
- confidence interval
- CLint
- intrinsic clearance
- Cmax
- maximal plasma concentration
- DME
- drug-metabolizing enzyme
- LC-MS/MS
- liquid chromatography-tandem mass spectrometry
- MRM
- multiple reaction monitoring
- m/z
- charge/mass ratio
- pPBPK
- pediatric physiologically based pharmacokinetic
- PK
- pharmacokinetics
- Tmax
- time for maximal plasma concentration
- Copyright © 2017 by The American Society for Pharmacology and Experimental Therapeutics


