


Abstract
We describe a simple method for calculating the pharmacological activity of an agonist (A) relative to a standard agonist (S) using only the concentration-response curves of the two agonists. In most situations, we show that the product of the ratios of maximal responses (E max − A/E max − S) and potencies (EC50 − S/EC50 − A) is equivalent to the product of the affinity and intrinsic efficacy of A expressed relative to that of S. We refer to this term as the IRA value of A. In a cooperative system where the concentration-response curve of the standard agonist is steep and that of the test agonist is flatter with a lower maximal response, the simple calculation of IRA described above underestimates agonist activity; however, we also describe a means of correcting the IRA in this situation. We have validated our analysis with modeling techniques and have shown experimentally that the IRA values of muscarinic agonists for stimulating contractions in the guinea pig ileum (M3 response) are in excellent agreement with those measured in the phosphoinositide assay on Chinese hamster ovary cells expressing the M3 muscarinic receptor.
When characterizing responses mediated through receptors, selective antagonists are usually the drugs of choice. This preference is based on the widespread appreciation of the power of competitive inhibition, which enables the dissociation constants of antagonists (K B values) to be estimated through functional antagonism. By comparing theK B values of a handful of selective antagonists with their respective binding affinities (K D values) measured in cell lines expressing recombinant receptors, it should be possible to identify the receptor subtype mediating a particular response in a tissue with a high degree of certainty.
In contrast, the interaction of agonists with receptors is complex. There are two elements to consider, the affinity and the intrinsic efficacy of the agonist-receptor complex, either of which can provide the basis for discrimination among receptor subtypes. Unfortunately, the estimation of these parameters can be difficult and laborious. Furchgott’s method (Furchgott, 1966; Furchgott and Bursztyn, 1967) of partial receptor inactivation is appropriate for estimating the observed dissociation constant of an agonist provided that a single subtype of the receptor elicits the response. Knowing the observed affinities of a group of agonists, it is possible to establish their occupancy-response relationships and, thus, to estimate their relative efficacies. Alternatively, the affinity of an agonist for a G protein-coupled receptor might be deduced from its binding properties measured in the presence of a high concentration of GTP. Such conditions are analogous to those of the intact cell where GTP is abundant in the cytosol. Thus, binding methods in combination with concentration-response measurements can be used to establish the occupancy-response relationship of agonists. This approach has been used to show that the selective muscarinic agonist, McN A-343, has greater relative efficacy at M4 and M1 receptors compared with M2 and M3 receptors (Ehlert and Yamamura, 1995).
Although plausible, the methods described above are cumbersome and not always readily applicable to various receptor systems. A facile approach for estimating pharmacological activity would be one that only required the concentration-response curve of an agonist. To consider such an approach, it is necessary to account for the variation in the sensitivity of different responses mediated by the same receptor in the same or different tissues. Comparison of the potency of an agonist relative to that of a standard agonist (equipotent molar ratio) should be appropriate in situations where the agonists elicit the same maximal response. However, agonists often differ in their maximal responses, and until recently, there has been no simple means of using the components of potency and maximal response to calculate a quantitative measure of agonist activity. Our laboratory has recently described such a measure termed the “equiactive molar ratio” (EAMR), and we have calculated the EAMR values of the enantiomers of the muscarinic agonist, aceclidine (Ehlert et al., 1996). We found excellent agreement between guinea pig ileum and Chinese hamster ovary (CHO) cells expressing M3 receptors with regard to the EAMR values of R- and S-aceclidine.
In the present report, we have modified our measure of agonist activity, and we now call it the “intrinsic relative activity ” (IRA), which is essentially equal to the reciprocal of our prior EAMR value. We show that, for a group of muscarinic agonists, their IRA values for the phosphoinositide response of CHO cells expressing M3 receptors are in excellent agreement with those measured for contraction in the guinea pig ileum, an M3 response. This agreement was observed, although most of the agonists behaved as potent, full agonists in the contractile assay and less potent, partial agonists in the phosphoinositide assay. We also show through modeling techniques that the IRA value of an agonist is equivalent to the product of its affinity (reciprocal of the equilibrium dissociation constant; i.e., 1/K D) and intrinsic efficacy, expressed relative to a standard agonist. This activity ratio can be envisioned as the theoretical equipotent molar ratio that would be observed in a highly sensitive assay where both the agonist and the standard agonist would behave as full agonists and elicit the same maximal response (100%). Our simple method for estimating IRA values is a powerful technique for characterizing the activity of agonists at different receptor subtypes.
Materials and Methods
Cell Culture.
CHO cells expressing the human M3 muscarinic receptor were grown in Dulbecco’s modified Eagle’s medium supplemented with fetal calf serum and antibiotics as described previously (Ehlert et al., 1996). Experimental assays were conducted in minimum essential medium (MEM) in 24-well culture plates at 37°C and in the presence of 5% CO2.
Phosphoinositide Hydrolysis.
Muscarinic receptor stimulated [3H]inositolphosphate accumulation was measured in CHO cells labeled with [3H]inositol as described previously (Ehlert et al., 1996). Briefly, growth media were removed from confluent CHO cell monolayers, and the cells were washed with an aliquot (0.5 ml) of MEM and incubated with MEM (0.5 ml) containing [3H]myo-inositol (0.2 μM; 23 Ci/mmol) for 18 h at 37°C in an incubator gassed with CO2 (5%). After [3H]inositol incorporation, cells were washed once with MEM (0.5 ml), followed by two 10-min incubations at 37°C with MEM, first in the absence and then in the presence of LiCl (10 mM). Phosphoinositide hydrolysis was initiated with the addition of MEM (0.5 ml) containing LiCl (10 mM) plus various concentrations of muscarinic agonists. The assay was stopped after 30 min by aspirating the media and adding 0.31 ml of methanol. [3H]Inositolphosphates in the methanol extract were collected by a modification of the method of Berridge et al. (1982) as described previously (Ehlert et al., 1996).
Guinea Pig Ileum.
Guinea pigs were euthanized with CO2, and a section of ileum (2–3 cm) ∼10 cm rostral to the cecum was removed. The ileum was washed clean with Krebs-Ringer bicarbonate (KRB) buffer (124 mM NaCl, 5 mM KCl, 1.3 mM MgSO4, 26 mM NaHCO3, 1.2 mM KH2PO4, 1.8 mM CaCl2, and 10 mM glucose) and mounted longitudinally in an organ bath containing KRB buffer. Isometric contractions were measured with a force-displacement transducer and polygraph. The ileum was allowed to incubate for 40 min, and then three test doses of the muscarinic agonist, oxotremorine-M, were added to ensure that the contractions were reproducible and of sufficient magnitude. The ileum was washed and allowed to rest for 5 min between each test dose. Before measuring the concentration-response curve of an agonist, the KRB buffer was replaced with potassium-deficient KRB buffer (KRB buffer minus 5 mM KCl), and the ileum was allowed to equilibrate for 5 min. To measure the concentration-response curve of an agonist, 7 to 10 concentrations of the agonist were added to the bath in a cumulative fashion, with each concentration being spaced 0.32 log units.
Calculations.
The EC50 value (concentration of agonists causing a half-maximal response) andE
max value (maximal response) of an agonist were calculated from the concentration-response data by fitting a logistic equation to the data by nonlinear regression analysis as described previously (Candell et al., 1990). The IRA value of an agonist was calculated relative to carbachol using the following equation:
Pharmacological activity of muscarinic agonists for stimulation of phosphoinositide hydrolysis in CHO cells and for stimulation of contractions in the isolated guinea pig ileum
Modeling of Concentration-Response Curves.
To investigate the validity of our IRA analysis, we constructed theoretical concentration-response curves for agonists of varying affinities and intrinsic efficacies and for responses showing high and low sensitivities. High sensitivity refers to a response for which the EC50 value of the agonist is much lower (i.e., more potent) than its K D value, whereas low sensitivity refers to a response for which the EC50 value andK D are approximately the same. Others have used the terms “high” and “low receptor reserve” to denote these situations.
Theoretical agonist concentration-response curves were calculated from an equation similar to the operational model of Black et al. (1985). We made two fundamental assumptions corresponding to eqs. 2 and 3 below. The first is that the stimulus (S) generated by an agonist (X) is equivalent to the product of receptor occupancy and intrinsic efficacy (ε) [see Furchgott and Bursztyn (1967)]:

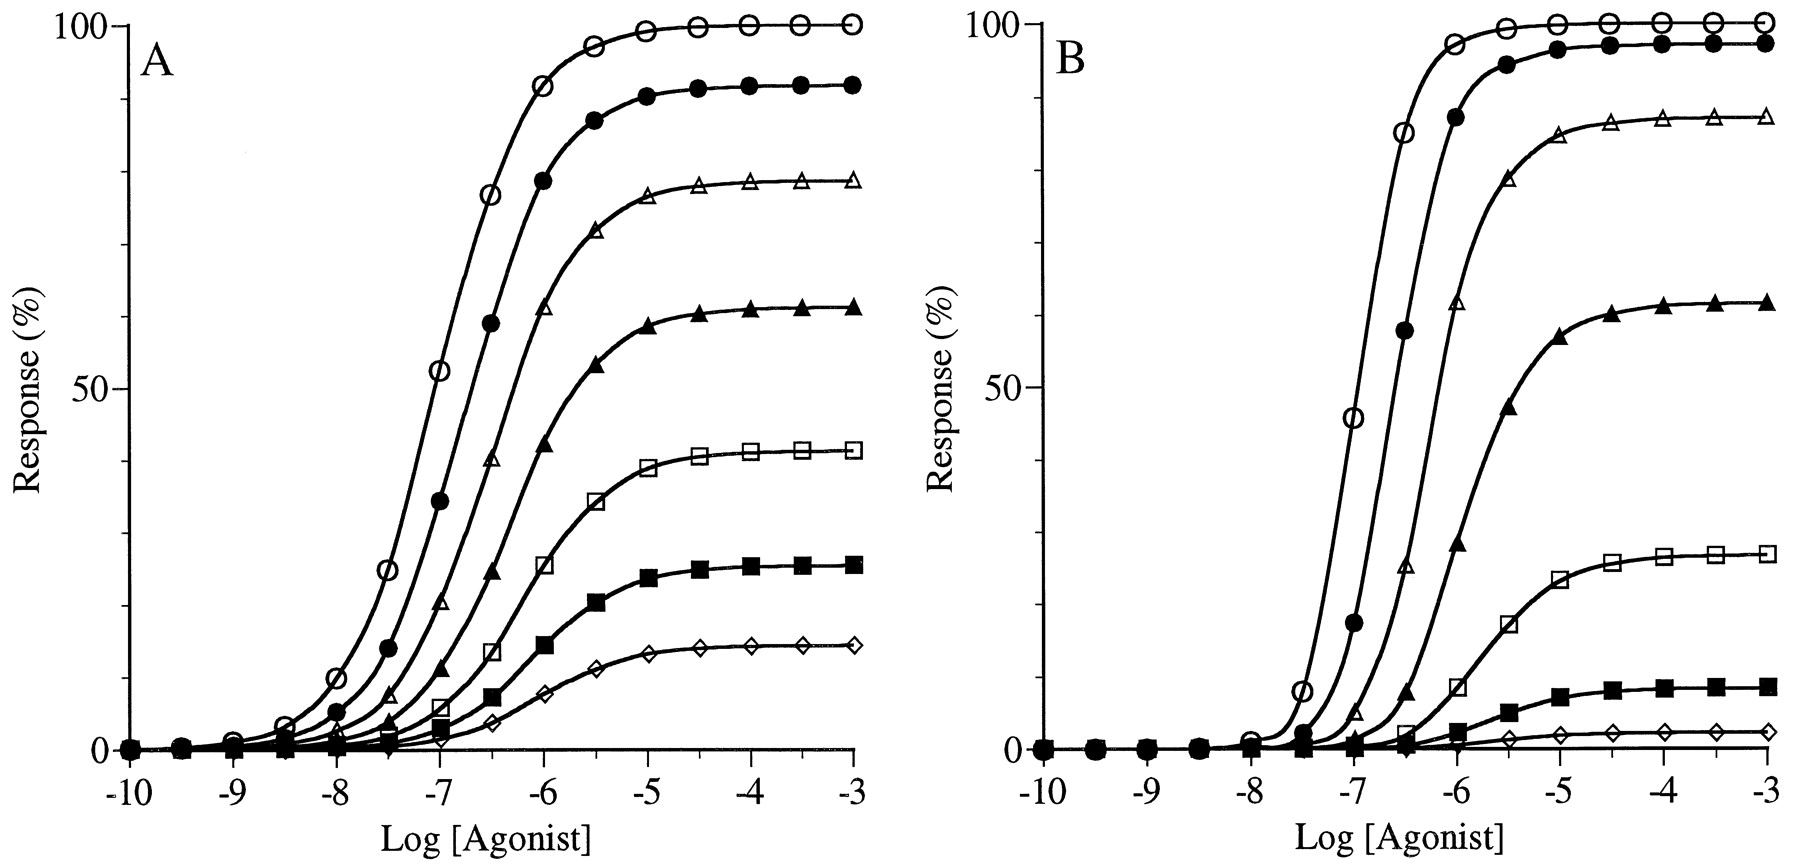
Simulation of the concentration-response curves of agonists in a noncooperative system. Curves are shown for a standard agonist (○), for agonist W with 20-fold lower affinity (●), for agonist X with 20-fold lower intrinsic efficacy (▵), for agonist Y with both 20-fold lower affinity and intrinsic efficacy (▴), and for agonist Z with 100-fold higher affinity and 20-fold lower intrinsic efficacy (▪). A, a highly sensitive noncooperative system withK = 0.01 and n = 1. B, a less sensitive noncooperative system with K = 1 andn = 1. For all of the simulationsR T = 1, and K D = 1 and ε = 10 for the standard agonist. The parameters are defined in eq. 4.

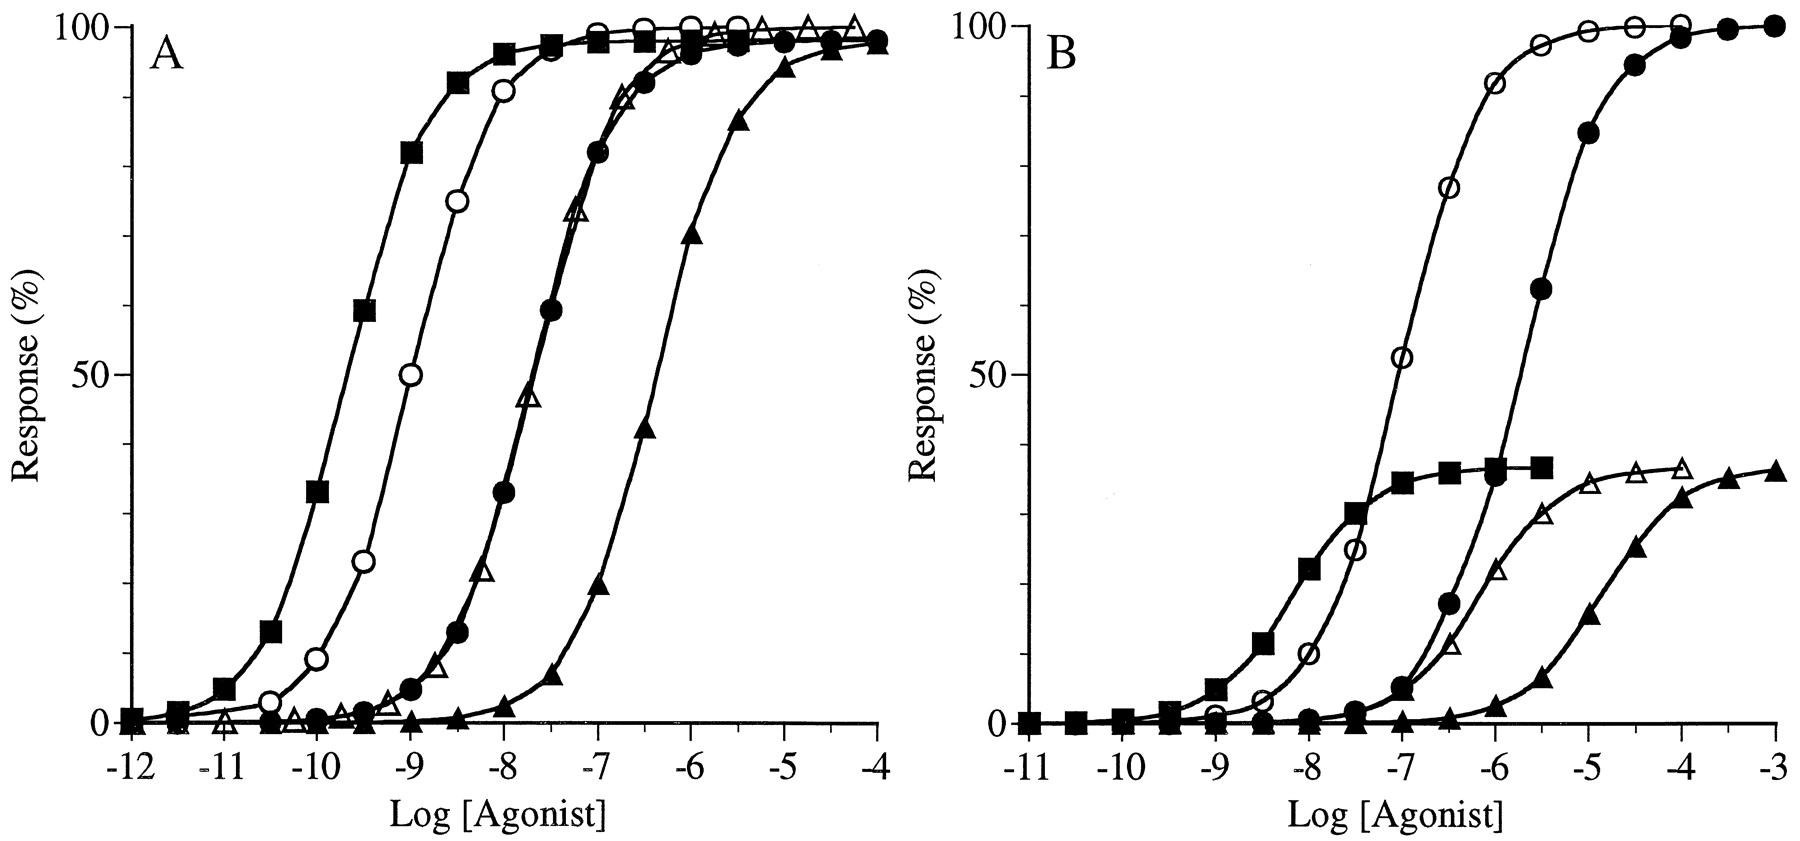
Simulation of the concentration-response curves of agonists in a cooperative system. Curves are shown for a standard agonist (○), for agonist W with 20-fold lower affinity (●), for agonist X with 20-fold lower intrinsic efficacy (▵), for agonist Y with both 20-fold lower affinity and intrinsic efficacy (▴), and for agonist Z with 100-fold higher affinity and 20-fold lower intrinsic efficacy (▪). A, a highly sensitive cooperative system withK = 0.01 and n = 2. B, a less sensitive cooperative system with K = 1 andn = 2. For all of the simulationsR T = 1, and K D = 1 and ε = 10 for the standard agonist. The parameters are defined in eq. 4.
Results
Theoretical Concentration-Response Curves.
To investigate the accuracy of our analysis, we calculated a series of theoretical agonist concentration-response curves and then determined whether ourIRA analysis yielded results consistent with the affinities and intrinsic efficacies of the agonists. In this analysis, concentration-response curves are shown for the standard agonist (K
D = 1.0, ε = 10), for agonist W having 20-fold lower affinity (K
D = 20, ε = 10), for agonist X having 20-lower intrinsic efficacy (K
D = 1.0, ε = 0.5), for agonist Y having both 20-fold lower affinity and intrinsic efficacy (K
D = 20, ε = 0.5), and for agonist Z having 100-fold higher affinity and 20-fold lower intrinsic efficacy (K
D = 0.01;ε = 0.5). The activity of each agonist relative to the standard agonist can be calculated as the product of the relative affinity and relative intrinsic efficacy as shown in the following equation:
IRA values calculated from the simulated agonist concentration-response curves shown in Fig. 1A
IRA values calculated from the simulated agonist concentration-response curves shown in Fig. 2B
Figure 1 shows results for a system where the concentration-response curves have Hill coefficients of 1 (i.e., n = 1; eq.3). Figure 1A shows the results for a highly sensitive system (i.e.,K = 0.01; eq. 3). It can be seen that all of the agonists have sufficient intrinsic efficacy to elicit the maximum response of the system. Relative to the standard agonist (open circles]), a 20-fold reduction in either affinity (agonist W; filled circles) or intrinsic efficacy (agonist X; open triangles) caused a 20-fold increase in the EC50 value, and a combination of both effects (agonist Y; filled triangles) caused a 400-fold increase in the EC50 value. This latter shift represents the product of the two 20-fold reductions in affinity and intrinsic efficacy. A 100-fold increase in affinity combined with a 20-fold reduction in intrinsic efficacy (agonist Z; filled squares) caused a 5-fold increase in potency (decrease in EC50 value). This latter shift represents the product of the increase in affinity (100-fold) and decrease in intrinsic efficacy (0.05). Using eq. 1, we calculated theIRA values of the agonists relative to the standard agonist. In situations where the agonist and standard agonist elicit the same maximal response, the IRA value is essentially equal to the ratio of EC50 values. The IRA values of agonists W, X, Y, and Z are 0.05, 0.05, 0.0025, and 5.0, respectively (i.e., 1/20, 1/20, 1/400, and 100/20). Thus, there is perfect agreement between the IRA values and the relative activities of the agonist. These results are summarized in Table1.
Figure 1B shows the concentration-response curves of the same agonists in a system that also exhibits curves with Hill coefficients of 1 but has lower sensitivity (i.e., K = 1; eq. 3) as compared with the responses shown in Fig. 1A. Compared with the standard agonist (open circles), agonist W (filled circles) has 1/20 the affinity, and its concentration-response curve is shifted to the right 20-fold with no change in the maximal response. Agonist X (open triangles) has 1/20 the intrinsic efficacy of the standard agonist, and its concentration-response curve is shifted to the right 7.34-fold with a 63.3% reduction in the maximal response. The concentration-response curve of agonist Y (filled triangles) is shifted to the right 147-fold and has a 63.3% reduction in the maximal response as compared with the standard agonist. This behavior is the result of 20-fold reductions in both affinity and intrinsic efficacy. Finally, the concentration-response curve of agonist Z (filled squares) is shifted to the left 13.6-fold and has a 63.3% reduction in the maximal response. This behavior is the result of a 100-fold increase in affinity combined with a 20-fold reduction in intrinsic efficacy. It can be seen that in this less sensitive system, a reduction in intrinsic efficacy is associated with a decrease in the maximal response. IRA values were calculated from the EC50 values and maximal responses of the agonists using eq. 1, and these values were found to be in agreement with those calculated above for Fig. 1A (i.e., W, 0.05; X, 0.05; Y, 0.0025; and Z, 5.0). Thus, the IRA value accurately reflects the relative activity of the agonists in this system, whereas the ratio of EC50 values (relative potency, Table2) does not. These results are summarized in Table 2.
IRA values calculated from the simulated agonist concentration-response curves shown in Fig. 1B
Figure 2 shows the calculations when the stimulus-response function displays cooperativity (i.e., n = 2; eq. 3). This property causes the concentration-response curves to exhibit Hill coefficients as high as two, even though agonist occupancy obeys simple mass-action behavior. Figure 2A shows the results for a highly sensitive system (i.e., K = 0.01; eq. 3) where agonists with low intrinsic efficacy are capable of eliciting the maximal response of the system. As observed in Fig. 1A, all of the agonists elicited the same maximal response and a given decrease in affinity or intrinsic efficacy or both leads to an equivalent decrease in potency. With regard to agonist Z, the 100-fold increase in affinity is offset by a 20-fold decrease in intrinsic efficacy, resulting in only a 5-fold increase in potency (i.e., 100/20 = 5). In contrast to Fig. 1, all of the concentration-response curves of Fig. 2A have Hill coefficients of ∼2.0. IRA values were calculated for the data shown in Fig. 2A using eq. 1, and these values are listed in Table3. Once again, there was excellent agreement between the IRA values and the relative activities of the agonists. Also, in this system of high sensitivity where all of the agonists behave as full agonists, there is agreement between theIRA and relative potency values (see Table 3).
IRA values calculated from the simulated agonist concentration-response curves shown in Fig. 2A
Figure 2B shows the concentration-response curves of agonists in a system that also has a cooperative stimulus-response function (i.e.,n = 2; eq. 3) but exhibits lower sensitivity (i.e.,K = 1; eq. 3) as compared with the responses shown in Fig. 2A. Under these conditions, agonists with low intrinsic efficacy behave as partial agonists and do not elicit the maximal response of the system. Also, agonists with high intrinsic efficacy exhibit steep concentration-response curves (Hill coefficient >1), whereas partial agonists exhibit curves with lower slopes. In this system, the standard agonist had a Hill coefficient of 1.80. Compared with the standard (open circles), the curve for agonist W (filled circles) is shifted to the right 20-fold with no change in the maximal response or Hill coefficient. This behavior is consistent with the 20-fold greaterK D value of W compared with the standard agonist. The curve for agonist X (open triangles) is shifted to the right 18.6-fold with an 80% reduction in the maximal response and a decrease in the Hill coefficient to a value of 1.25. These changes were the result of a 20-fold decrease in intrinsic efficacy. The curve of agonist Y (filled triangles) is shifted to the right 372-fold and has an 80% reduction in the maximal response with a decrease in the Hill coefficient to a value of 1.25. This behavior is the result of 20-fold reductions in both affinity and intrinsic efficacy. Finally, the concentration-response curve of agonist Z (filled squares) is shifted to the left 5.38-fold with an 80% reduction in the maximal response. These changes were the result of a 100-fold increase in affinity combined with a 20-fold reduction in intrinsic efficacy. Using eq. 1, the IRA values for agonists W, X, Y, and Z were calculated to be 0.05, 0.0107, 0.000536, and 1.08, respectively. It can be seen that for agonists X, Y, and Z, which have low intrinsic efficacy (i.e., 1/20 that of the standard), the simpleIRA calculation (eq. 1) underestimates their activity by a factor of about 5. These data are summarized in Table4.
To identify the conditions where the IRA value begins to underestimate the activity of agonists, we further examined the behavior of a series of agonists under the conditions of Fig. 2B. These conditions correspond to a cooperative stimulus-response system (i.e.,n = 2; eq. 3) with low sensitivity (i.e.,K = 1; eq. 3). For purposes of comparison, we also examined the behavior of agonists in a system with low sensitivity (K = 1), but with a noncooperative stimulus-response function (n = 1). The theoretical agonists all have the same affinity as the standard agonist (K D = 1) but progressively lower intrinsic efficacies. Although the standard agonist has an intrinsic efficacy of 10, agonists A–F have intrinsic efficacies of 5.0, 2.5, 1.25, 0.6, 0.3, and 0.15, respectively. It can be seen in Fig.3 that there is a progressive shift to the right and a decrease in the maximal response as intrinsic efficacy decreases. For the noncooperative system, all of the concentration-response curves have Hill coefficients of 1 (see Fig.3A). However, for the cooperative system, there is a progressive decrease in the Hill coefficient as intrinsic efficacy decreases (see Fig. 3B). These data are summarized in Tables5 and 6. When the stimulus-response function is noncooperative, theIRA value is an accurate estimate of the relative activity of the agonist (see Table 5). When the stimulus-response function is cooperative, the IRA value is a reasonable approximation of relative activity as long as the maximal response is at least 50% that of the standard. When the maximal response is less, the IRAvalue underestimates the relative activity by more than 2-fold (see Table 6).
The effect of changing intrinsic efficacy (ε) on the concentration-response curves of agonists. The concentration-response curves are shown for the standard agonist (○;ε = 10), for agonist A (●; ε = 5), for agonist B (▵; ε = 2.5), for agonist C (▴;ε = 1.25), for agonist D (■; ε = 0.6), for agonist E (▪; ε = 0.3), and for agonist F (⋄; ε = 0.15). A, an insensitive, noncooperative system with K = 1 and n = 1. B, an insensitive cooperative system with K = 1 andn = 2. For all of the simulationsR T = 1, and K D = 1 and ε = 10 for the standard agonist. The parameters are defined in eq. 4.
IRA values calculated from the simulated agonist concentration-response curves shown in Fig. 3A
IRA values calculated from the simulated agonist concentration-response curves shown in Fig. 3B
From eq. 4, it can be seen that intrinsic efficacy (ε) affects the agonist concentration-response curve in exactly the same way as the receptor concentration (R T). For example, a 90% reduction in intrinsic activity has exactly the same effect as a 90% decrease in the receptor concentration. Therefore, for the partial agonists shown in Fig. 3, it should be possible to estimate their intrinsic efficacies relative to the standard agonist by Furchgott analysis. We analyzed the standard curve in combination with each curve for agonists A–F by Furchgott analysis (Furchgott, 1966) as described previously (Ehlert, 1987). This analysis was done for the data in both A and B of Fig. 3. The estimates of the “apparent proportion of residual receptors after receptor inactivation” were 0.5, 0.25, 0.125, 0.06, 0.03, and 0.015 for agonists A–F, respectively, in both A and B of Fig. 3. It can be seen that these estimates are in perfect agreement with the intrinsic efficacies of the agonists relative to the standard agonist, whereas the ratio of EC50 values (relative potency, Tables 5 and 6) are not. These data are summarized in Tables 5 and 6. The estimate of the “apparent proportion of residual receptors” is listed in these tables as the “corrected IRA value.” This analysis also yields an estimate of the dissociation constant (K D) of the test agonist. For each agonist, the estimate of K D was equivalent to that (1.0 μM) used in eq. 3 to calculate the theoretical curves (Fig. 3).
The analysis of Fig. 3 suggests that it might be possible to estimate the relative activity of a partial agonist by a method akin to Furchgott’s analysis in situations were the simple IRAcalculation (eq. 1) has significant experimental error (i.e., in the analysis of a partial agonist with a maximal response <50% in a cooperative system). In the , we describe the mathematical basis for doing so. We also show that this technique is appropriate provided that the EC50 value of the test agonist is about 10-fold greater than that of the standard agonist and the efficacy of the test agonist is lower than that of the standard agonist. This latter criterion does not introduce any limitations, because the simple IRA calculation (i.e., eq.1) is only erroneous with partial agonists in cooperative systems. We analyzed the concentration-response curves for agonists X and Y in Fig.2B by the method outlined in the . This analysis yielded estimates of 0.05 and 0.0025 for the IRA values of Y and Z, respectively. We refer to these estimates as the correctedIRA values, and they are listed in Table 4. These estimates are in perfect agreement with the relative activities of X and Y (0.05 and 0.0025, respectively). Because the EC50value of agonist Z was less than that of the standard agonist, it was not possible to correct its IRA value under the conditions of Fig. 2B.
In the analyses described in Figs. 1 to 3, we investigated alterations in the sensitivity of the stimulus-response function by changing the value of the sensitivity constant, K (see eq. 3). We repeated this analysis keeping the value of K constant but changing the total receptor concentration (R T). Increasing the receptor concentration increased the sensitivity of the system and had the same effect as reducing the sensitivity constant. The results of this latter analysis were otherwise similar to those described above.
Phosphoinositide Hydrolysis in CHO Cells.
To assess our analysis further, we compared the activity of a group of agonists in two different functional assays that are known to be mediated by the same receptor subtype. The first of these was agonist-stimulated phosphoinositide hydrolysis in CHO cells transfected with the human M3 subtype of the muscarinic receptor. We measured complete concentration-response curves for arecoline, bethanechol, carbachol, McN-A343, pilocarpine, oxotremorine and oxotremorine-M (see Fig. 4). The data were analyzed by nonlinear regression to estimate the EC50 value, maximal response (E max) and Hill coefficient of each agonist for eliciting phosphoinositide hydrolysis. EC50 values varied 50-fold from the most potent agonist, oxotremorine-M (EC50, 0.33 μM) to the least potent agonist, bethanechol (EC50, 17.3 μM).E max values varied from 51-fold stimulation over basal (oxotremorine-M) to 6.8-fold stimulation (McN-A343). Hill coefficients did not differ much from 1 and ranged between 1.06 and 1.25. These data are summarized in Table7, together with some data published previously from our laboratory on the enantiomers of aceclidine (Ehlert et al., 1996).

Effects of muscarinic agonists on phosphoinositide hydrolysis in CHO cells. ○, Oxotremorine-M; ●, oxotremorine; ▵, carbachol; ▴, arecoline; ♦, S-aceclidine; ×,R-aceclidine; ■, pilocarpine; ▪, bethanechol; ⋄, McN-A343. The data points represent the mean values of four experiments, each done in triplicate. The data for the enantiomers of aceclidine are from Ehlert et al. (1996). The average S.E.M. was 1.05-fold.
Guinea Pig Ileum.
The second functional assay that we examined was the muscarinic contractile response of the guinea pig ileum, which is known to be mediated by the M3 receptor (Eltze et al., 1993; Eglen, 1997; Ehlert et al., 1997). Complete concentration-response curves were measured for the agonists described above, and these are shown in Fig. 5. The data were analyzed by nonlinear regression to estimate the EC50 value, maximal response (E max), and Hill coefficient of each agonist. The EC50 values varied 172-fold from a low value of 31.6 nM (oxotremorine-M) to a high value of 5.42 μM (McN-A343). Most of the agonists behaved as full agonists and exhibited similar maximal responses ranging from 85 to 126% that of carbachol. In contrast, the maximum responses for pilocarpine (75%) and McN-A343 (57%) were systematically lower. The Hill coefficients of all of the agonists except McN-A343 were similar, ranging from 1.74 to 2.14. The average Hill coefficient of McN-A343 was lower (1.65); however, it exhibited a relatively large standard error (0.31). This variation was due primarily to one large value of 2.96. When this latter value was omitted from the analysis, the average Hill coefficient of McN-A343 was 1.32 with a standard error of 0.10. Thus, compared with the phosphoinositide response of CHO cells, the guinea pig ileum behaves like a more sensitive response with a cooperative stimulus response relationship (n = 2; eq. 3) like that shown in Fig. 2. For such a system, full agonists exhibit Hill coefficients close to 2, whereas partial agonists, like McN-A343, exhibit lower Hill coefficients. The data for the guinea pig ileum are summarized in Table 7, together with some data published previously for the enantiomers of aceclidine (Ringdahl et al., 1982).

Effects of muscarinic agonists on the contractile response of the guinea pig ileum. ○, Oxotremorine-M; ●, oxotremorine; ▵, carbachol; ▴, arecoline; ■, pilocarpine; ▪, bethanechol; ⋄, McN-A343. The data points represent the mean values of 21 experiments for carbachol, 5 experiments for McN-A343, and 6 experiments for the other agonists. The average S.E.M. was 5.7%.
IRA Calculations.
We calculated theIRA values of the agonists from their EC50 andE max values for the phosphoinositide response and the contractile response using eq. 1. These values are expressed relative to carbachol and are listed in Table 7. It can be seen that there is excellent agreement between the CHO cells and the guinea pig ileum with regard to agonist IRA values, despite the large difference in the sensitivities of the two assays. All of the concentration-response curves in the CHO cells had Hill coefficients close to 1, indicating a lack of cooperativity in the stimulus-response function. This situation is analogous to the model shown in Fig. 1, where it was observed that the IRA value, calculated according to eq. 1, gave a reliable estimate of the relative activity of the agonist. As described in the preceding paragraph, the contractile response behaved like the cooperative system described in Figs. 2B and 3B. In such a system, the IRA value underestimates the activity of partial agonists, like pilocarpine and McN A343. Inspection of the IRA values for pilocarpine and McN-A343 shows that the values obtained in the guinea pig ileum are 2- to 3-fold lower than those measured in CHO cells, suggesting that the ileal values are erroneously low. Consequently, we used the method outlined in the to estimate the IRAvalues of pilocarpine and McN-A343 relative to carbachol in the guinea pig ileum. These new estimates are listed as “correctedIRA values” in Table 7. These corrected values in the guinea pig ileum for pilocarpine and McN-A343 (0.138 and 0.0174) are in good agreement with those calculated in CHO cells (0.150 and 0.0194). The excellent agreement between CHO cells and guinea pig ileum with regard to IRA values is shown in Fig.6.

Discussion
We contend that the product of affinity (1/K D) and intrinsic efficacy (ε) is a useful means of characterizing the activity of an agonist at a receptor. We now show that the IRA value of an agonist is equivalent to the product of its affinity and intrinsic activity expressed relative to the that of a standard agonist. We also show this parameter can be calculated from the agonist concentration-response curve. In most instances, estimates of EC50 and maximal response (E max) are all that is necessary.
The foregoing implies that the product of affinity and intrinsic efficacy is related to the graphical parameters of an agonist concentration-response curve. This interesting relationship is outlined in Fig. 7, which shows the concentration-response relationships for two agonists, A and B. Responses are plotted against the agonist concentration on a linear scale instead of the usual log scale. Assuming an operation model (i.e., eq. 4), it can be shown that the ratio of the initial slope of the concentration-response curve of agonist B divided by that of agonist A is equal to (ε B K A /ε A K B)n, where K A andK B denote the dissociation constants of A and B, and n denotes the exponent the in stimulus-response relationship (see eq. 3). Thus, the ratio of initial slopes is equivalent to IRA n.

Relationship between the initial slopes of two concentration-response curves and the dissociation constants (K a and K b) and intrinsic efficacies (εa and εb) of two agonists (A and B). The parameters are defined in eq. 4.
It is not possible to dissect out the individual components of affinity and intrinsic efficacy from the IRA value; it is only possible to measure their product. However, this limitation is mitigated by two significant points: 1) whereas measurements of affinity and intrinsic efficacy are somewhat cumbersome and not widely tackled, the estimation of IRA only requires the measurement of a concentration-response curve; and 2) a considerable amount of pharmacology occurs at low levels of stimulus, and under these conditions, the behavior of an agonist is governed entirely by the product of its affinity and intrinsic efficacy. This concept can be appreciated by taking the limit of the stimulus function as the agonist concentration approaches zero (see eq. 2). It can be shown that this limit is equal to the product of the agonist concentration and the expressionεR T /K D. This latter expression is equivalent to the initial slope of the stimulus function for the agonist. When this slope is normalized with respect to the corresponding value of another agonist, the IRA value is obtained. The initial slope of an output function is a common means of assessing the sensitivity of a variety of transducers in electronics. Accordingly, the IRA value is a useful means of assessing the sensitivities of agonists. For a highly sensitive response, where most of the agonists behave as full agonists, differences in pharmacological activity are measured entirely by the EC50 values of agonists. Under these conditions, the EC50 value of an agonist divided by that of the standard agonist is equal to the IRAvalue. The same IRA value would be obtained in a less sensitive system, even if the agonist exhibited a lower maximal response than that of the standard agonist. In contrast, the potency ratio of the agonist (agonist EC50 value divided by that of the standard) may change with the sensitivity of the system (e.g., see Fig. 1). The constancy of the agonist IRAvalue across systems of different sensitivities (i.e., differentKs, see eq. 3) illustrates its advantage over the agonist potency ratio.
Because affinity and intrinsic efficacy are probably unique properties of a given agonist-receptor complex, then the IRA value is also probably diagnostic of the particular agonist-receptor complex. Thus, the IRA value of an agonist is most likely constant when estimated from different responses mediated by the same receptor subtype. It should be possible to estimate the IRA values of agonists by examining their ability to trigger second messenger response in cell lines transfected with a specific receptor subtype. By comparing their respective IRA values in the cell line with those measured in a native tissue, it should be possible to deduce which receptor mediates the response of the tissue, provided that sufficiently selective agonists are used. In the present study, we noted exceptional agreement between IRA values calculated for M3 receptors in CHO cells and guinea pig ileum (see Fig. 6). Just as we are comfortable assuming that the pA2 value of an antagonist is a reliable measure of its affinity for a particular receptor subtype, we might also consider that the IRA value of an agonist is an equally reliable measure of agonist activity at a particular receptor subtype. In other words, the IRA value is a powerful tool for characterizing the activity of agonists at different receptor subtypes. An exception to this rule could occur if there are different active states of the agonist receptor complex that show different selectivities for different G proteins. Under such conditions, the pharmacological profile of an agonist could change depending upon the G protein with which it interacts (Leff et al., 1997). Regardless, ourIRA analysis would be a useful means of determining whether such a phenomenon occurs. For example, the IRA values of agonists for eliciting responses in different cell lines expressing the same receptor but different G proteins could be calculated to determine whether receptor-G protein coupling affects agonist activity.
If the IRA value of an agonist is dependent mainly on the receptor subtype, then it should be relatively constant for all responses mediated through the same receptor. To get some idea of the how well this hypothesis holds true, we calculated the IRAvalues of selected agonists relative to carbachol from a variety of published studies in which the EC50 values and maximal responses were measured in functional assays for the M1, M2, and M3 subtypes of the muscarinic receptor. The most complete sets of data that we examined were those of Eltze et al. (1993), Lazareno et al. (1993), and Richards and van Giersbergen (1995). Eltze et al. (1993) measured the ability of agonists to stimulate contractions of the guinea pig ileum (M3) and to inhibit the electrically stimulated rabbit vas deferens (M1) and guinea pig atria (M2). The other investigators measured responses in cell lines transfected with subtypes of the muscarinic receptor. These responses were agonist-stimulated GTPase activity [Lazareno et al. (1993)] and agonist-mediated phosphoinositide hydrolysis and inhibition of cAMP accumulation [Richards and van Giersbergen (1995)]. We also examined the data of Mei et al. (1991) on the phosphoinositide response in fibroblasts transfected with the M1 receptor, those of Schwartz et al. (1993) on the phosphoinositide response in CHO cells transfected with the M1 receptor, and those of McKinney et al. (1991)on inhibition of cAMP accumulation in CHO cells transfected with the M2 receptor. Figure8 shows the results of these calculations plotted as a scatter graph. Also included are the data from the present report. The average standard deviation for the IRA values of an agonist at a receptor subtype represented a 1.9-fold variation. The average IRA values at the M1, M2, and M3 receptors were 0.98, 0.84, and 0.71 for arecoline; 10.2, 8.8, and 3.0 for oxotremorine; and 0.61, 0.24, and 0.24 for pilocarpine. Therefore, these agonists did not discriminate markedly among the M1, M2, and M3 subtypes of the muscarinic receptor. In contrast, the IRA value of McN-A343 at M1 receptors (0.70) was 43-fold greater than that observed at M2 receptors (0.016) and 46-fold greater than that measured at M3 receptors (0.015). This M1 selectivity can account for the ability of McN-A343 to activate ganglionic muscarinic receptors (M1) while having little action on muscarinic receptors in the heart (M2) or smooth muscle (M3) (Roszkowski, 1961; Jones, 1963). It has been shown that the selective action of McN-A343 is due to its greater intrinsic efficacy at M4 and M1 receptors as compared with M2 and M3 receptors (Ehlert and Yamamura, 1995).

Comparison of the IRA values of selected agonists estimated from published EC50 andE max values. The IRA values relative to carbachol were calculated using eq. 1 and the published EC50 and E max values of the agonists in a variety of different studies. The data are fromEltze et al. (1993) (○), Lazareno et al. (1993) (▵), Richards and van Giersbergen (1995) (●), Mei et al. (1991) (■), Schwartz et al. (1993) (▴), McKinney et al. (1991) (▪), and the present study, CHO cells (⋄) and guinea pig ileum (♦). The details of the assays for M1, M2, and M3 muscarinic receptors are given in the text.
The variance of our simple IRA estimate appears to be similar to that of the more commonly used potency ratio. In fact, we found that the average standard deviation of the log IRAvalue (0.0778; i.e., 1.20-fold) was a little less than that of the log potency ratio (0.0959; i.e., 1.25-fold). It is interesting to compare the source of variation in the estimate of IRA and potency ratio. This variance includes the variation within the population (s p 2) and the error in estimation (s e 2), so that the total variance (s 2) of each parameter is equal to the sum of itss p 2 ands e 2 (i.e.,s 2 =s p 2 +s e 2). Because the simple IRA calculation (eq. 1) includes four parameters (EC50, EC50 − Carb, E max, andE max − Carb), whereas the potency ratio only includes two (EC50and EC50 − Carb), then the population variation of the IRA(IRA-s p 2) should be greater than that of the potency ratio (potency ratio-s p 2). This conclusion is based on the assumption that each parameter contributes to the total s p 2. However, the greaterIRA-s p 2 is offset by the lower error in the estimation of IRA (i.e., smallers e 2). In considering the source of the error in estimation (s e 2), it is useful to express the log potency ratio as log EC50 − Carb − log EC50 and the logIRA as log (E max/EC50) − log (EC50 − Carb /E max − Carb). Because errors in the estimation of EC50 andE max are correlated, there should be less error in the estimation of the ratio EC50 /E max compared with the error in EC50 alone. For example, if EC50 is overestimated, so will beE max such that the ratio (EC50 /E max) will have less error than that of EC50 alone. Consequently, the error in the estimation of IRA(IRA-s e 2) should be less than that of the potency ratio (potency ratio-s e 2). In summary, the IRA value should exhibit greater variation within the population as compared with the potency ratio; however, the error in the estimation of IRA should be less than that of the potency ratio. As a result, we would expect little difference in the variances of IRA and potency ratio. As described above, we actually observed a slightly lower variance for IRA as compared with the potency ratio.
Our IRA value also provides the basis for calculation of the relative efficacy of an agonist provided that the dissociation constants of the agonist and the standard agonist are known. Because the IRA value represents the product of the affinity and efficacy of an agonist expressed relative to that of a standard agonist, it should be possible to factor out the affinity component to estimate relative efficacy. A simple method for doing so is described in the (see eqs. EA11 and EA12).
In summary, we have described a simple and novel means of calculating the product of the affinity and intrinsic efficacy of an agonist expressed relative to that of a standard agonist. This product (IRA) can be estimated from a single concentration-response curve of an agonist. The simplicity of the IRA calculation contrasts with the more tedious, conventional means of estimating affinity and relative efficacy, which require measuring responses before and after partial receptor inactivation or measuring binding properties in addition to the functional response. Although more tedious, the latter approach does provide separate estimates of affinity and relative efficacy, whereas our IRA value only provides an estimate of their product. Nevertheless, the IRAvalue is superior to the potency ratio when full and partial agonists are compared with one another (see Tables 1B and 5-7). TheIRA calculation can be applied to previously published EC50 andE max values so that the product of affinity and intrinsic efficacy can be extracted from literature already published (see Fig. 8). Most importantly, the IRAvalue can be used to address a variety questions that depend on knowledge of the affinity and intrinsic efficacy of an agonist. Some of these applications include: 1) the potency ratios of agonists in a highly sensitive system can be predicted from their IRAvalues in a less sensitive system (e.g., the phosphoinositide response of a cloned receptor in a cell line). Because a recombinant receptor is totally defined and the physiological responses of intact tissues are often highly sensitive, the IRA calculation provides a powerful means of predicting the activity of agonists from their behavior in cell lines transfected with recombinant receptors; 2) theIRA value can be used to determine what receptor mediates a given response; and 3) the IRA value can be used to determine whether agonist receptor activity is altered by the nature of the G protein with which the receptor interacts. In each of these applications, all that is required are the concentration response curves of agonists.
Estimation of Corrected IRA Values.
This describes a method for estimating theIRA value of an agonist under conditions where the simple calculation (i.e., eq. 1) is erroneous. This situation arises when the stimulus-response function exhibits cooperativity (e.g., see Figs. 2B and 3), and the agonist has much lower intrinsic efficacy than the standard agonist. These conditions are manifest by a steep concentration-response curve (Hill coefficient >1) for the standard agonist, whereas the partial agonist has a less steep curve with a maximal response less than that of the standard agonist.
For this analysis, it is assumed that the responses of the standard agonist Y and the test agonist X are a function (f) of the stimulus, with the stimulus being equal to the product of receptor occupancy and intrinsic efficacy. The response toX is described by:
In summary, our rules for calculating IRA are as follows. For noncooperative systems (i.e., Hill coefficients of standard and test agonists are approximately equal to 1), the IRA value can be calculated using eq. 1, regardless of a difference in maximal responses. For cooperative systems, eq. 1 can also be used provided that the maximal responses of the standard agonist and test agonist are approximately the same. However, if the Hill coefficient and maximal response of the test agonist are lower than those of the standard agonist, then eq. 1 is erroneous, and eq. EA7 must be used. To use eq.EA7, the EC50 value of the test agonist (X) must be ∼10-fold greater than that of the standard agonist (Y) if the standard agonist is a full agonist. To estimate the relative activity (p) of X, equiactive concentrations of X and Y are determined by interpolating on the concentration-response curve ofY to obtain concentrations of Y that correspond to responses equivalent to those elicited by the various concentrations of X. The resulting pairs of agonist concentrations are fitted to the log form of eq. EA7 by nonlinear regression analysis:
Estimation of Relative Efficacy.
Because the IRAvalue represents the product of the affinity (1/K
D) and intrinsic efficacy of an agonist expressed relative to that of a standard agonist, it should be possible to factor out the affinity component to yield an estimate of relative efficacy provided that the dissociation constants of the agonists are known. To illustrate this calculation, we begin with the following equation, which illustrates that the IRA value, as defined by eq. 1, is equivalent to the product of the affinity and efficacy of an agonist (X) expressed relative to that of a standard agonist (Y):
Footnotes
-
Send reprint requests to: Frederick J. Ehlert, Ph.D., Department of Pharmacology, College of Medicine, University of California–Irvine, Irvine, CA 92697-4625. E-mail:fjehlert{at}uci.edu
-
↵1 This work was supported by National Institutes of Health Grant NS30882.
- Abbreviations:
- CHO
- Chinese hamster ovary
- EAMR
- equiactive molar ratio
- Emax
- maximal response
- IRA
- intrinsic relative activity
- KRB
- Krebs-Ringer bicarbonate
- McN A-343
- 4-(m-chlorophenylcarbamoyloxy)-2-butynyltrimethylammonium
- MEM
- minimum essential medium
- Received July 29, 1998.
- Accepted December 30, 1998.
- The American Society for Pharmacology and Experimental Therapeutics


