


Abstract
The binding of allosteric modulators to G protein-coupled receptors (GPCRs) is often described by an equilibrium allosteric ternary complex model (ATCM). This study evaluated the effects of three modulators on the binding of [3H]N-methylscopolamine ([3H]NMS) to the human M2 muscarinic acetylcholine receptor (mAChR). The binding of each modulator was more complex than predicted by the ATCM; the inhibitors heptane-1,7-bis-(dimethyl-3-phthalimidopropyl)-ammonium bromide and gallamine yielded biphasic curves that were described empirically by a two-site binding model, whereas the enhancer alcuronium yielded a bell-shaped curve. Radioligand dissociation assays revealed that the modulators retarded [3H]NMS kinetics such that the system never attained equilibrium. Subsequent application of a kinetic ATCM accommodated and quantified all experimental observations. Our findings confirm and extend previous studies on the use of a kinetic ATCM for mAChR allosteric enhancers, but also highlight how complex curves displayed by allosteric inhibitors can be misinterpreted in terms of multisite orthosteric binding. It is possible that similar behavior of other allosteric modulators at GPCRs may reflect nonequilibrium binding artifacts rather than deviation from an ATCM.
G protein-coupled receptors (GPCRs) comprise the largest family of all receptors, and drugs that target GPCRs represent the major proportion of all therapeutic agents (Drews, 2000). Traditionally, GPCR-based drug discovery has been driven by the targeting of receptor orthosteric sites, that is, the site on the GPCR recognized by its endogenous agonist (Christopoulos, 2002). However, many GPCR families possess allosteric binding sites that can be targeted by natural or synthetic ligands to modulate orthosteric ligand binding and/or receptor function through allosteric interactions (Christopoulos and Kenakin, 2002; see Discussion). In the present study, we define an “allosteric interaction” as one that occurs between two topographically distinct binding sites on the one GPCR.
An advantage of allosteric ligands is the potential for greater selectivity of action at receptors that show high sequence homology within the orthosteric binding domain across subtypes, because allosteric domains tend to show less sequence conservation across receptor subtypes (Christopoulos, 2002; Christopoulos and Kenakin, 2002). The muscarinic acetylcholine receptors (mAChRs) are a prime example and are arguably the best-studied GPCR model system with respect to the phenomenon of allosteric modulation (Lee and El-Fakahany, 1991; Waelbroeck, 1994; Tuček and Proska, 1995; Birdsall et al., 1996; Ellis, 1997; Christopoulos et al., 1998; Holzgrabe and Mohr, 1998). Given the current paucity of sufficiently subtype-selective orthosteric mAChR ligands, allosteric modulators of mAChRs are potentially useful alternatives in the therapy of disorders that involve an mAChR component, such as cognitive dysfunction, schizophrenia, and a variety of pain states (Felder et al., 2000).
The simplest mechanism that can describe allosteric interactions at GPCRs is the allosteric ternary complex model (ATCM; Fig. 1) (Stockton et al., 1983; Ehlert, 1988), which quantifies the effects of a modulator in terms of its affinity for the allosteric site on the unoccupied receptor and the magnitude of cooperativity between allosteric and orthosteric sites when each is occupied by their respective ligand. Of all GPCRs studied to date, the M2 mAChR has been the most extensively investigated in terms of the ATCM, because there are many modulators that show high selectivity for this receptor and exhibit behaviors consistent with the model (Ellis, 1997; Christopoulos et al., 1998). There are examples in the literature, however, where the ATCM has been deemed either inappropriate or insufficient to accommodate experimental observations with certain allosteric ligands (Christopoulos, 2002; Christopoulos and Kenakin, 2002). Although this conclusion may be valid for some GPCR-modulator combinations, it is likely premature for others; a hallmark of many allosteric modulators of GPCRs is the ability to alter the kinetics of orthosteric ligand-receptor interaction, leading to nonequilibrium binding artifacts that can be misinterpreted in terms of more complex reaction schemes than the ATCM (Proska and Tuček, 1994; Lazareno and Birdsall, 1995).

An ATCM, where A represents orthosteric ligand; B represents allosteric ligand; KA and KB represent equilibrium dissociation constants for the binding of ligands A and B, respectively; and α represents the cooperativity factor for the allosteric interaction between ligand B and ligand A. In this model, α > 1 denotes positive cooperativity (allosteric enhancement), α < 1 denotes negative cooperativity (allosteric inhibition), and α = 1 denotes neutral cooperativity.
Given the propensity for many allosteric modulators to modify orthosteric ligand binding kinetics, it is important to detect and use kinetic phenomena in the evaluation of mechanisms underlying actions of such modulators before proposing more complex schemes than the ATCM to explain the data. For the mAChRs, a kinetic ATCM has been applied successfully to quantify the actions of positive and neutral allosteric modulators, which exert their kinetic effects over the same concentration range as that typically investigated in equilibrium-type binding assays and thus yield binding isotherms that are incompatible with the equilibrium ATCM (Lazareno and Birdsall, 1995). However, it has been suggested that the use of a kinetic ATCM is unlikely to be necessary for negative allosteric ligands, because their kinetic effects are most pronounced only at very high modulator concentrations (Lazareno and Birdsall, 1995; Ellis, 1997).
In the present study, we have undertaken a rigorous investigation of the nonequilibrium binding properties of two prototypical negative allosteric modulators of the mAChRs, using the M2 mAChR as a model system, and compared them to the binding of a prototypical mAChR allosteric enhancer. Although we have found agreement with previous observations regarding the concentration dependence of kinetic binding artifacts of mAChR modulators, we also demonstrate how negative allosteric ligands that slow orthosteric ligand kinetics yield complex binding isotherms that can be misinterpreted in terms of multisite, rather than allosteric, binding. We also demonstrate the usefulness of an underused statistical approach for comparing different types of models that is based on information theory rather than standard hypothesis testing. Our findings are particularly pertinent to the characterization of modulator effects in tissues that are known to express a mixture of GPCR subtypes.
Materials and Methods
Materials. [3H]N-Methylscopolamine methyl chloride ([3H]NMS) was purchased from PerkinElmer Life Sciences (Boston, MA). Dulbecco's modified Eagle's medium and geneticin were purchased from Invitrogen (Carlsbad, CA). Fetal bovine serum was purchased from ThermoTrace (Melbourne, VIC, Australia). Heptane, 1,7-bis-(dimethyl-3′-phthalimidopropyl)-ammonium bromide (C7/3-phth) was synthesized by the Institute for Drug Technology (IDT, Boronia, VIC, Australia). Alcuronium chloride was a generous gift from F. Hoffmann-La Roche (Basel, Switzerland). All other materials were purchased from Sigma-Aldrich (St. Louis, MO).
Cell Culture. Chinese hamster ovary (CHO-K1) cells, stably transfected with the human M2 mAChR (M2 CHO cells), were kindly provided by Dr. M. Brann (University of Vermont Medical School, Burlington, VT). Cells were grown and maintained in Dulbecco's modified Eagle's medium containing 20 mM HEPES, 10% fetal bovine serum, and 50 μg/ml geneticin and were grown for 4 days at 37°C in a humidified incubator containing 5% CO2, 95% O2. Cells were then harvested by trypsinization followed by centrifugation (300g, 3 min) and resuspension of the pellet in HEPES buffer (110 mM NaCl, 5.4 mM KCl, 1.8 mM CaCl2, 1 mM MgSO4, 25 mM glucose, 50 mM HEPES, 58 mM sucrose; pH 7.4), repeated twice.
Cell Membrane Preparation. For membrane-based radioligand binding assays, M2 CHO cells were grown, harvested, and centrifuged as described above, with the final pellet resuspended in 5 ml of ice-cold homogenization buffer (50 mM HEPES, 2.5 mM MgCl2, 2 mM EGTA) and then homogenized using a Polytron homogenizer for three 10-s intervals at maximum setting with 30-s cooling periods used between each burst. The homogenate was centrifuged (1000g, 10 min, 25°C), the pellet discarded and the supernatant was recentrifuged at 30,000g for 30 min at 4°C. The resulting pellet was resuspended in 5 ml of HEPES buffer, and protein content was determined using the method of Bradford (1976). The homogenate was then aliquoted into 1-ml amounts and either used immediately or stored frozen at -80°C until required for radioligand binding assays.
Saturation Binding Assays. M2 CHO cell membranes (20-30 μg/ml) or intact M2 CHO cells (105 cells/ml) were incubated in 1-ml total volume of HEPES buffer containing concentrations of [3H]NMS ranging from 0.02 to 5 nM, for 60 min at 37°C. Nonspecific binding was defined using 10 μM atropine. Incubation was terminated by rapid filtration through Whatman GF/C filters using a Brandell cell harvester (Gaithersburg, MD). Filters were washes three times with 3-ml aliquots of ice-cold HEPES buffer and dried before the addition of 5 ml of scintillation cocktail (Ultima Gold; Packard Bioscience, Meriden, CT). Vials were then left to stand until the filters became uniformly translucent before radioactivity was determined using scintillation counting.
Nonequilibrium Binding Assays. M2 CHO cell membranes (20-30 μg/ml) or intact M2 CHO cells (105 cells/ml) were incubated in 1-ml total volume of HEPES buffer containing either 0.2 or 2 nM [3H]NMS (as indicated under Results) and a range of concentrations of the allosteric modulators gallamine (1 nM-10 mM), alcuronium (1 nM-0.3 mM), or C7/3-phth (1 nM-10 mM), at 37°C for different times as indicated under Results. Determination of nonspecific binding, termination of reaction, and determination of radioactivity were performed as described above.
Dissociation Kinetic Assays. In initial experiments designed to investigate the time course of [3H]NMS dissociation, M2 CHO cell membranes (20-30 μg/ml) or intact M2 CHO cells (105 cells/ml) were equilibrated with 0.5 nM [3H]NMS in 1-ml total volume of HEPES buffer for 60 min at 37°C. Atropine (10 μM), either alone or together with 100 μM of the indicated allosteric modulator, was then added at various time points to prevent radioligand reassociation. In subsequent, membrane-based experiments designed to investigate the effects of a range of modulator concentrations on [3H]NMS dissociation rate, a “three-point kinetic” experimental paradigm was used, where the effect on radioligand dissociation of each test ligand was determined at 0 min and two other time points (3 and 6 min). This simplified approach to the determination of radioligand dissociation rate constants is valid when the dissociation characteristics of the radioligand are found to be monophasic in the absence and presence of any of the modulators tested (Lazareno and Birdsall, 1995; Kostenis and Mohr, 1996), as found for [3H]NMS in the present study (see Results). Determination of nonspecific binding, termination of reaction, and determination of radioactivity were performed as described above.
Data Analysis. Data sets of total and nonspecific binding obtained from each saturation binding assay were analyzed according to the following equation using Prism 4.0 (GraphPad Software Inc., San Diego, CA): 
where Bmax denotes the maximal density of binding sites, KA is the radioligand equilibrium dissociation constant, and NS is the fraction of nonspecific binding. The hyperbolic term in eq. 1 was not used when fitting the nonspecific binding data, whereas the parameter NS was shared between both total and nonspecific binding data sets.
Simulations according to an equilibrium ATCM (Fig. 1) were performed with Prism 4.0 using the following equations (Ehlert, 1988; Lazareno and Birdsall, 1995; Christopoulos and Kenakin, 2002): 
and 
where Y/Ymax denotes fractional receptor occupancy, [B] denotes the concentration, and KB the equilibrium dissociation constant for the allosteric modulator, respectively, and α is the “cooperativity factor” for allosteric interaction between radioligand and modulator. This factor is a thermodynamic measure of the strength of allosteric interaction between two sites on the same GPCR and is defined as the ratio of affinity of one ligand for the free receptor to its affinity for the receptor when the latter is occupied by the other ligand. Values of α > 1 denote positive cooperativity (allosteric enhancement), whereas values of α < 1 denote negative cooperativity (allosteric inhibition). [A] and KA are as defined above for eq. 1. It can be seen that, in the absence of allosteric modulator ([B] = 0), eqs. 2 and 3 define a standard mass-action (hyperbolic) binding equation for orthosteric ligand A. In the presence of modulator ([B] ≠ 0), these equations predict that the midpoint location (KApp) of the occupancy curve for ligand A will be shifted to the right or the left as a function of [B], KB, and α. It should also be noted that the ATCM does not predict any effects on the maximal binding capacity of either ligand. Although the interaction between the two sites is noncompetitive, binding is assumed to be reversible, saturable, and surmountable in all instances.
Dissociation kinetic data were fitted to the following equation for monoexponential decay using Prism 4.0: 
where Bt denotes the specific binding of radioligand at time t, B0 denotes the specific binding of radioligand at equilibrium (time = 0), and koffobs denotes the observed radioligand dissociation rate constant. Concentration-effect data for the ability of each modulator to retard the dissociation rate constant of [3H]NMS were fitted to the following three-parameter Hill equation using Prism 4.0:  where Y denotes the fractional effect, Emax denotes the maximal asymptotic fractional effect of the modulator on the radioligand's dissociation rate constant, nH denotes an empirical slope factor, EC50 denotes the concentration of modulator that is able to retard the radioligand dissociation rate constant to half the Emax, and [B] denotes modulator concentration. If nH is not significantly different from unity, then it is constrained as such and the EC50 parameter becomes a measure of KB/α in the simple ATCM (Ellis, 1997; Buller et al., 2002; Christopoulos and Kenakin, 2002; Lazareno et al., 2002)
Nonequilibrium binding data were fitted to equations based on a kinetic, rather than equilibrium, ATCM. These equations are as derived by Lazareno and Birdsall (1995), with the only modification being that the affinity constants in the original equations were recast as equilibrium dissociation constants (Christopoulos and Kenakin, 2002).  where
where 
 and
and 
Equation 6 is the standard equation defining a monoexponential association of orthosteric ligand, A, with the receptor; the parameter, BAB denotes the specific binding of the radioligand in the presence of modulator at equilibrium, and t denotes time. The apparent monoexponential rate constant for this reaction is denoted by konobs. This rate constant is, in turn, a composite parameter (as indicated in eq. 7) that is determined not only by the rate of association of A with the receptor (kon = 1 + [A]/KApp) but also by its dissociation from the receptor, which is given by the parameter koffobs. If the binding kinetics of the modulator are rapid relative to the radioligand and the modulator rapidly achieves equilibrium with the allosteric site upon addition, then the fractional occupancy of the receptor by the modulator remains constant as the radioligand-receptor complex dissociates (Lazareno and Birdsall, 1995). This means that the observed dissociation is also a monoexponential function of koff (the dissociation rate constant of A from receptors not occupied by modulator), koffB (the dissociation rate constant of A from receptors already occupied by modulator), and the fractional occupancy of the receptor by modulator (which is determined by [B], KB and α). The relationship between these parameters and koffobs is given by eq. 8. Finally, eq. 9 is the standard equation representing the equilibrium occupancy of radioligand, A, in the presence of modulator. This equation is mathematically identical to eq. 2 (equilibrium ATCM), with the exception of a Bmax parameter that is added to eq. 9, rather than expressing the model in terms of fractional receptor occupancy (eq. 2). More explicit directions on the programming of GraphPad Prism according to these equations are described in Christopoulos (2000) and in the Appendix to this article.
The two required assumptions of rapid modulator binding kinetics (relative to radioligand binding kinetics) and rapid equilibrium for modulator binding upon addition have been shown to be valid for many mAChR modulators (Lazareno and Birdsall, 1995; Tränkle et al., 2003); otherwise, a more complex model is needed to fit nonequilibrium modulator binding data (Lazareno and Birdsall, 1995). Importantly, the validity of these assumptions can also be tested experimentally by confirming that the dissociation of radioligand in the absence and presence of a high concentration of modulator is monoexponential (see Results).
In some instances, the negative allosteric modulator nonequilibrium binding data were also fitted empirically to standard, one- or two-site orthosteric (competitive) binding models (Motulsky and Christopoulos, 2003) for comparative purposes. In all cases, potency, affinity and cooperativity factors were estimated as logarithms (Christopoulos, 1998). For curve-fitting based on eqs. 6 to 9, global nonlinear regression was performed whenever possible, whereby model parameters were constrained to be shared across multiple data sets. Results are expressed as mean ± standard error of the mean. Statistical significance was determined by unpaired t test, or by one-way analysis of variance, followed by Newman-Keuls post testing, using Prism 4.0. Where appropriate, comparisons between nested models were performed using an F test (extra-sum-of-squares test) in Prism 4.0. However, this test is invalid for comparisons between non-nested models (e.g., orthosteric versus allosteric). Therefore, these latter comparisons were performed by Prism 4.0 using the Akaike's Information Criterion (AIC) method. This underused method of model comparison is based on information theory, rather than hypothesis testing, and is briefly outlined below.
When fitting models to data, the Principle of Parsimony dictates that the smallest number of model parameters is used that provides an adequate representation of the experimental data. In statistical terms, this can be viewed as a trade-off between decreasing bias and increasing variance with increased model complexity (e.g., increased parameters), and underlies both the hypothesis testing (e.g., F test) and information theory approaches to model selection. Conceptually, information theory assesses the “distance” between two models. The AIC approach is based on the Kullback-Liebler (K-L) “distance” or “information” between two models, which itself is an extension of Shannon's earlier work on the “entropy” of information in communication theory [see Burnham and Anderson (2002) for historical development]. Briefly, the K-L distance is defined as the information that is “lost” when a chosen model is used to approximate reality (the “true” model). In practice, one never knows the true underlying biological model. However, Akaike provided a way to estimate a relative K-L distance between models using the maximized log-likelihood of each model for the data. The AIC method, therefore, combines information theory with maximum likelihood theory, the latter providing a mathematical basis for calculating the likelihood of the data given the model, a set of parameters and the scatter of the data (Press et al., 1992).
The AIC method uses the same input as traditional hypothesis testing for its calculations, i.e., the number of parameters and the associated variance in the model fit to calculate an AIC value: 
where N is the number of data points, K is the number of model parameters being fitted plus one, and SS is the sum of the squares of the vertical distances of the data points from the fitted curve. Unlike traditional hypothesis testing, however, AIC values can be calculated for as many models (nested and non-nested) as the researcher chooses to investigate. The model with the lower AIC value is more likely to be correct. Unfortunately, when the number of data points is small relative to the number of parameters, the AIC value is not very accurate. In biology, it is common to see relatively small data sets (<40 points) fitted to biological models. In this case, a “corrected AIC value” (AICC) has been shown to be more accurate: 
However, it is not sufficient to calculate only the absolute AICC (or AIC) value for each model; the difference in AICC values between models is more important, because this difference can then be used to calculate an evidence ratio of probabilities that one model is more correct relative to another: 
where ΔAICC is the difference between AICC scores. For example, if the AICC scores differ by 5, then the evidence ratio equals 12.18, i.e., the model with the lower AICC score is 12.18 times more likely than the other model. For a ΔAICC of 10, the evidence ratio is 148. In the present study, Prism 4.0 was used to calculate AICC values and associated evidence ratios [see Motulsky and Christopoulos (2003) for further details]. It should be noted, however, that no method of model comparison can overcome a lack of common sense; models should be chosen that are biologically sensible (whether nested or non-nested), and neither the hypothesis testing approaches nor the AIC approach can decide whether a given model is “wrong”.
For all analyses, a probability (p) value of 0.05 was taken to indicate statistical significance.
Results
Characterization of the Binding Profile of Three Allosteric Modulators at the M2 mAChR. The simulations in Fig. 2 illustrate the predicted effects of an allosteric enhancer (α = 10) and an allosteric inhibitor (α = 0.1) on the binding of a single concentration (KA) of an orthosteric radioligand according to the ATCM of allosteric interaction. At equilibrium (eqs. 2 and 3 under Materials and Methods), the model predicts monophasic sigmoid curves (Fig. 2A). In contrast, complex binding curves are predicted for the same simulation parameters if time is included as an explicit parameter in the model and the modulator is able to significantly retard the dissociation of the radioligand such that the binding is observed under nonequilibrium conditions (eqs. 6-9 under Materials and Methods). As shown in Fig. 2B, an allosteric enhancer under these conditions is expected to yield a bell-shaped curve, whereas an allosteric inhibitor yields a biphasic curve.

Theoretical simulations depicting the effects of an allosteric enhancer (dashed line) and an allosteric inhibitor (solid line) on the percentage of specific binding of a fixed concentration of orthosteric radioligand under equilibrium conditions (A), modeled using eqs. 2 and 3 under Materials and Methods, and nonequilibrium conditions (B), modeled using eqs. 6 to 9 under Materials and Methods. For both panels, the following parameters were used: log[A] = log KA; log KB = -6; α (enhancer) = 10; and α (inhibitor) = 0.1. For the simulations in B, additional model parameters were as follows: koff = 0.5 min-1, koffB = 0 min-1, and incubation time = 90 min.
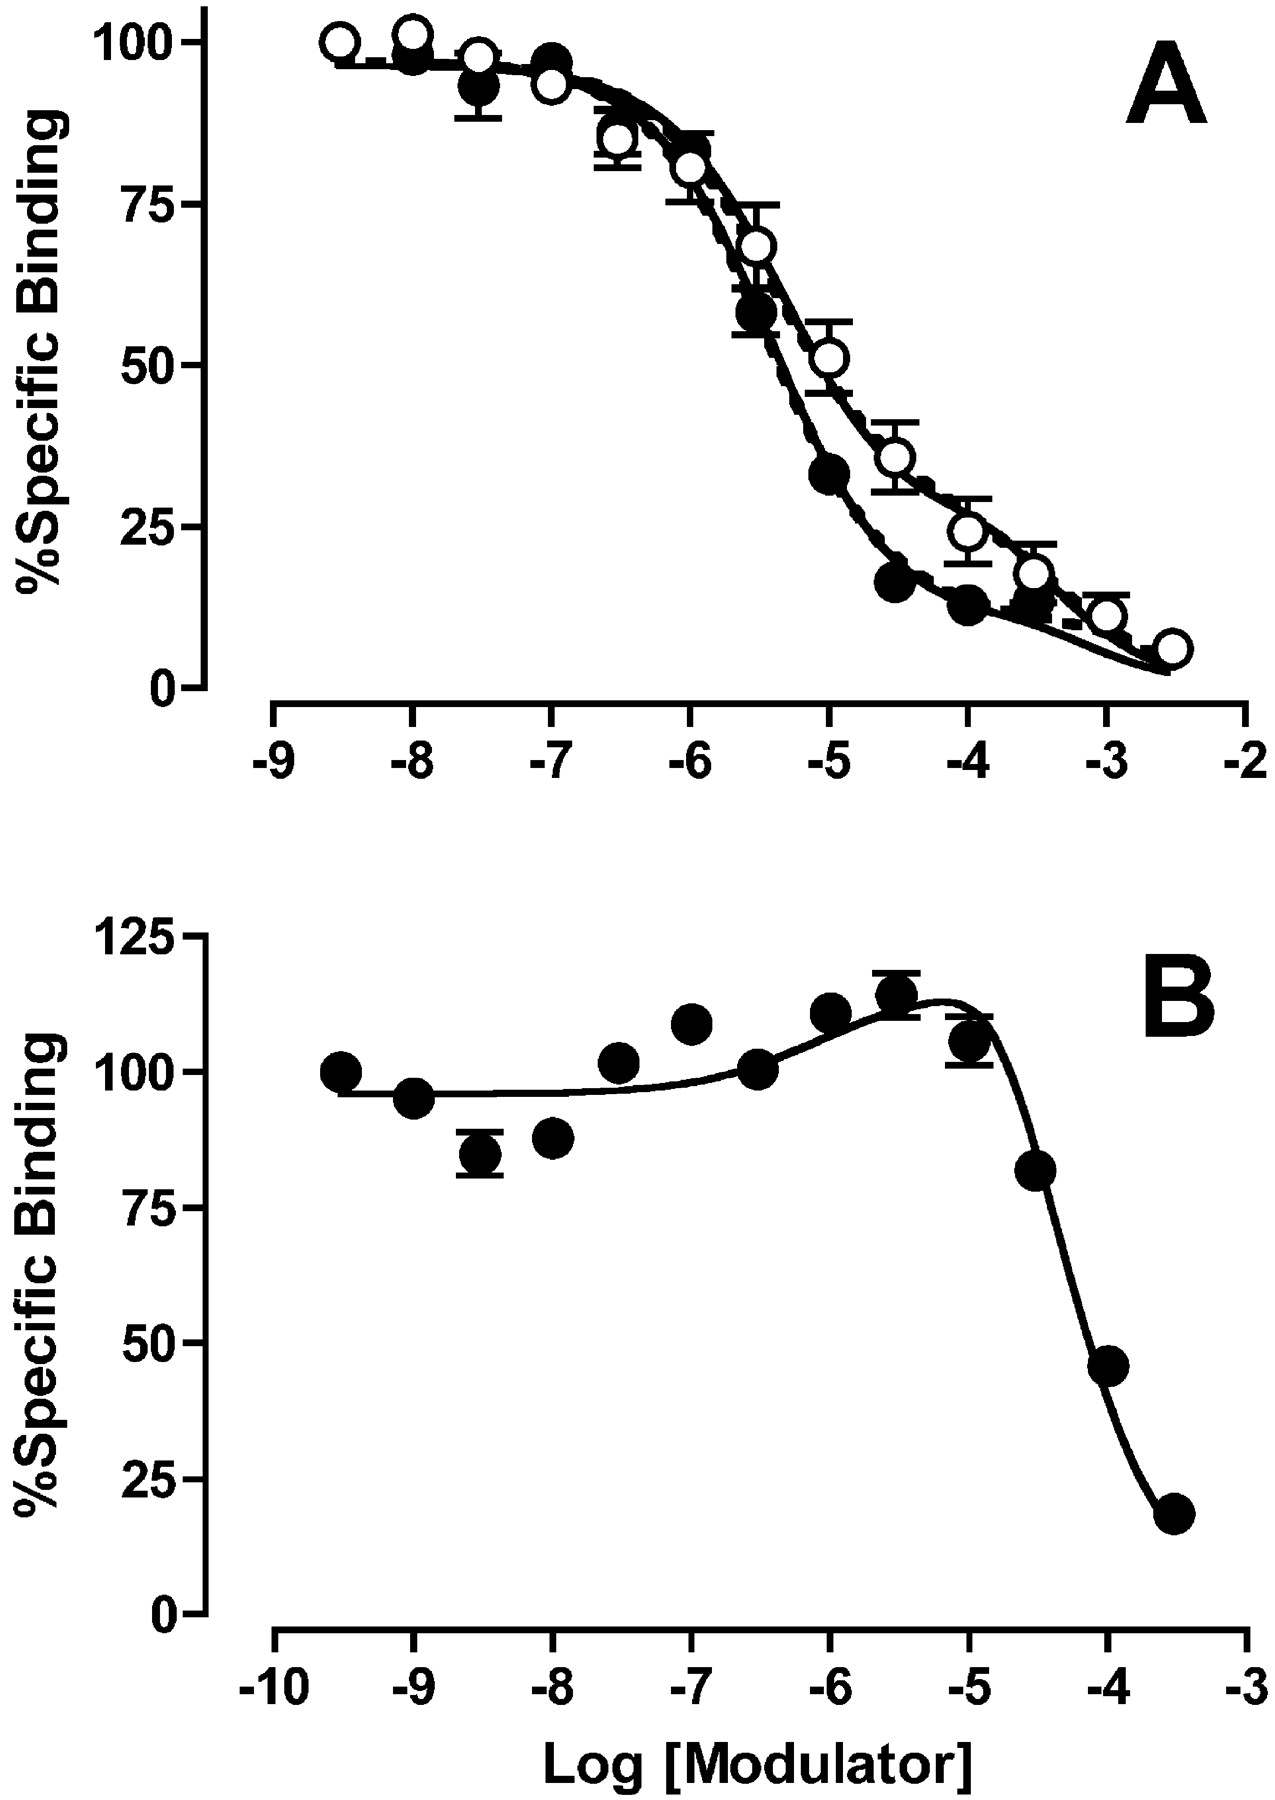
Experiments were performed to characterize the binding properties of the allosteric inhibitors gallamine and C7/3-phth and the enhancer alcuronium using [3H]NMS as the radioligand. Initial [3H]NMS saturation assays in membranes yielded the following parameters: log KA = -9.34 ± 0.08, Bmax = 2099 ± 437 fmol/mg protein (n = 4); similar experiments in intact cells yielded the following values: log KA = -9.61 ± 0.01, Bmax = 4.49 fmol/105 cells (n = 3). When tested against [3H]NMS, all the modulators exhibited complex binding curves (Figs. 3 and 4) that are not in accord with the simple (equilibrium) ATCM. Qualitatively, the binding profile of each ligand was similar between membranes and intact cells, and seemed concordant with the predictions of the kinetic (nonequilibrium) ATCM. However, the binding isotherms of the negative allosteric modulators could also be described empirically in terms of a standard two-site orthosteric binding model (dashed curves, Figs. 3 and 4), and a comparison between the models using the AICC method found only a slight preference, if any, for the kinetic ATCM model over the empirical two-site orthosteric model. For C7/3-phth in CHO membranes, the evidence ratio of probabilities was 2.60 in favor of the kinetic ATCM, that is, the kinetic ATCM had a 2.6-fold greater probability of being correct than an empirical two-site orthosteric model. For gallamine, this finding was even more modest, with an evidence ratio of only 1.35 in favor of the kinetic ATCM in the membrane experiments (Fig. 3) and 1.31 in the intact cell studies (Fig. 4). Interestingly, a comparison between allosteric and orthosteric models for the C7/3-phth binding data obtained in intact cells (Fig. 4) actually found an evidence ratio of 5.60 in favor of the two-site orthosteric model rather than the kinetic ATCM. Thus, without additional mechanistic insights into the mode of action of the inhibitors, it is objectively difficult to differentiate a nonequilibrium allosteric model from a multisite inhibition binding model.
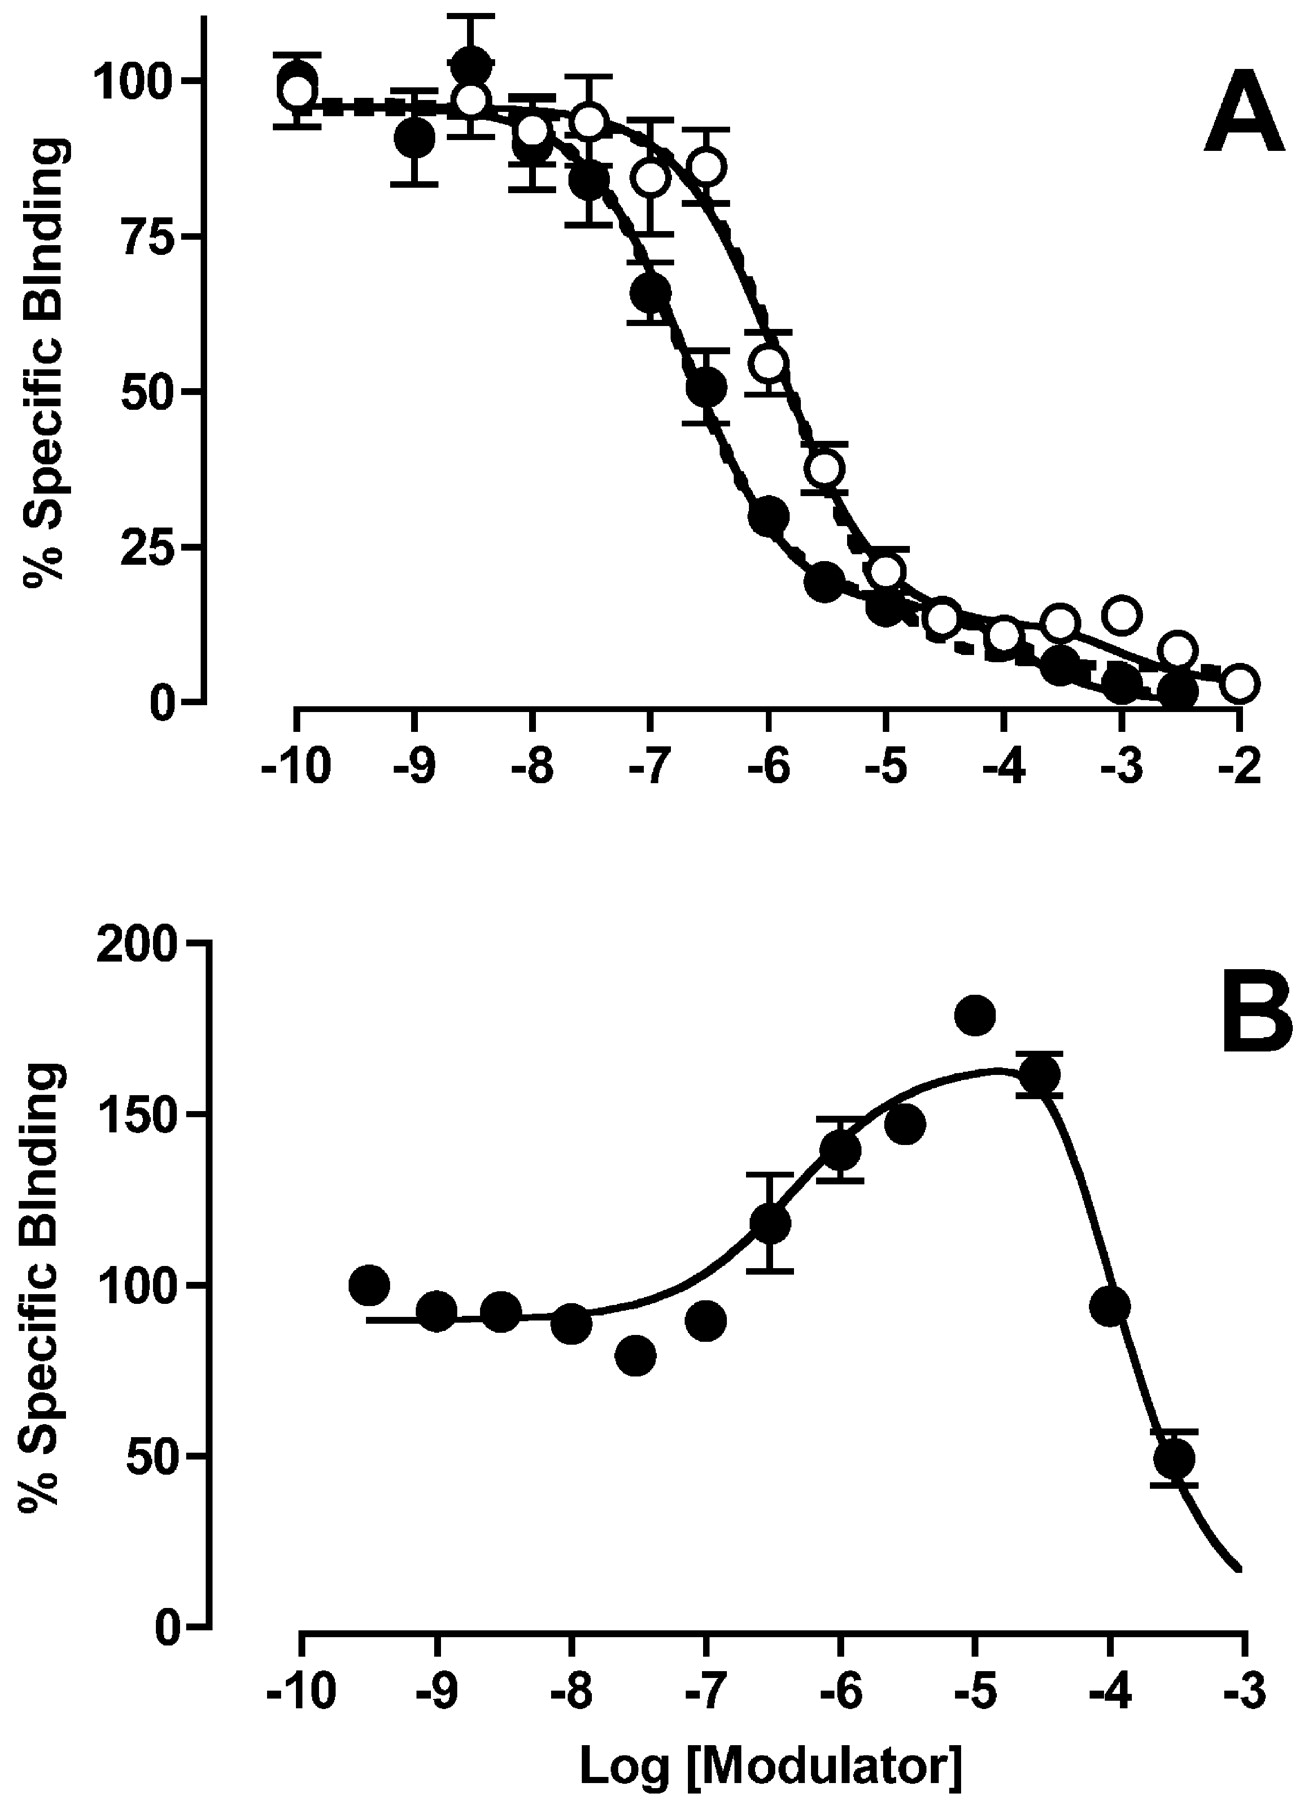
Effects of C7/3-phth (•) and gallamine (○) (A) and alcuronium (B), on the binding of 0.2 nM [3H]NMS at human M2 mAChRs expressed in CHO cell membranes. Incubations were for 60 (A) or 90 min (B) at 37°C. Data points represent the mean ± standard error of the mean of three experiments conducted in triplicate. Nonspecific binding was defined using 10 μM atropine. The solid curves through the points represent the best fit of a kinetic ATCM (eqs. 6-9 under Materials and Methods). The following parameter values were constrained in the analysis: koff = 0.84 min-1 (Table 1); koffB = 0 min-1. The dashed curves represent the best fit of an empirical, two-site, mass action orthosteric binding model.

Effects of C7/3-phth (•) and gallamine (○) (A) and alcuronium (B) on the binding of 0.2 nM [3H]NMS at human M2 mAChRs expressed in intact CHO cells. All other details as for Fig. 3, with the exception that the parameter koff was constrained to a value of 0.33 min-1 (Table 1) for the nonlinear regression analysis.
Characterization of Allosteric Modulator Effects on [3H]NMS Dissociation. To confirm the allosteric properties of each of the chosen ligands and gain further insight into their effects on radioligand kinetics, [3H]NMS dissociation kinetic experiments were undertaken. As shown in Fig. 5A, 100 μM of each modulator was able to cause a significant retardation of radioligand dissociation (Table 1), irrespective of whether the modulator was an inhibitor or an enhancer. Similar findings were noted in intact cell studies (Table 1), although the observed dissociation rate constant for [3H]NMS was significantly slower than that found in the membrane studies (Table 1). In all instances, the radioligand dissociation curves were monoexponential.

A, dissociation of [3H]NMS in the absence (•) or presence of 100 μM gallamine (○), C7/3-phth (□), or alcuronium (▵) from human M2 mAChRs expressed in CHO cell membranes. Homogenates were equilibrated with 0.5 nM [3H]NMS for 60 min at 37°C before dissociation was revealed by the addition of 10 μM atropine. Data points represent the mean ± standard error of the mean of three experiments conducted in duplicate. Nonspecific binding was defined using 10 μM atropine. Curves represent the best fit of a monoexponential decay model (eq. 4 under Materials and Methods) using nonlinear regression. B, concentration-effect curves for the gallamine (○), C7/3-phth (□), or alcuronium (▵) in retarding the observed dissociation rate constant for [3H]NMS at human M2 mAChRs expressed in CHO cell membranes. Data represent the mean ± standard error of the mean of three experiments conducted in duplicate and are normalized to the percentage of the true dissociation rate constant (koff) measured in the absence of modulator. Curves represent the best fit of the Hill equation (eq. 5 under Materials and Methods) to the data with the slope factor (nH) constrained to unity.
Dissociation rate constants (min−1) for [3H]NMS at human M2 mAChRs in CHO cells, determined in the absence or presence of 100 μM of the indicated allosteric modulatora
Because the dissociation curves of [3H]NMS remained monophasic in the presence of modulator as well as its absence, subsequent experiments were performed using fewer time points but with a wide range of modulator concentrations. The results of these “three-point” kinetic assays are shown in Fig. 5B, where it can be seen that each of the modulators was able to concentration dependently retard the dissociation rate of [3H]NMS to a value not significantly different from zero (p > 0.05; extra-sum-of-squares test). In terms of the ATCM, this finding means that the value of the parameter koffB in eq. 8 approaches 0 min-1 for each of the modulators. Moreover, the slopes of the concentration-effect curves were not significantly different from unity (p > 0.05; extra-sum-of-squares test); according to the ATCM, the midpoint location parameter of such curves under these circumstances represents the affinity of the modulator for the radioligand-occupied receptor (i.e., KB/α; see Materials andMethods). The experimentally determined values of log(KB/α) are shown in Table 2.
Ternary complex model binding parameters for various allosteric modulators against [3H]NMS at human M2 mAChRs expressed in CHO cell membranes
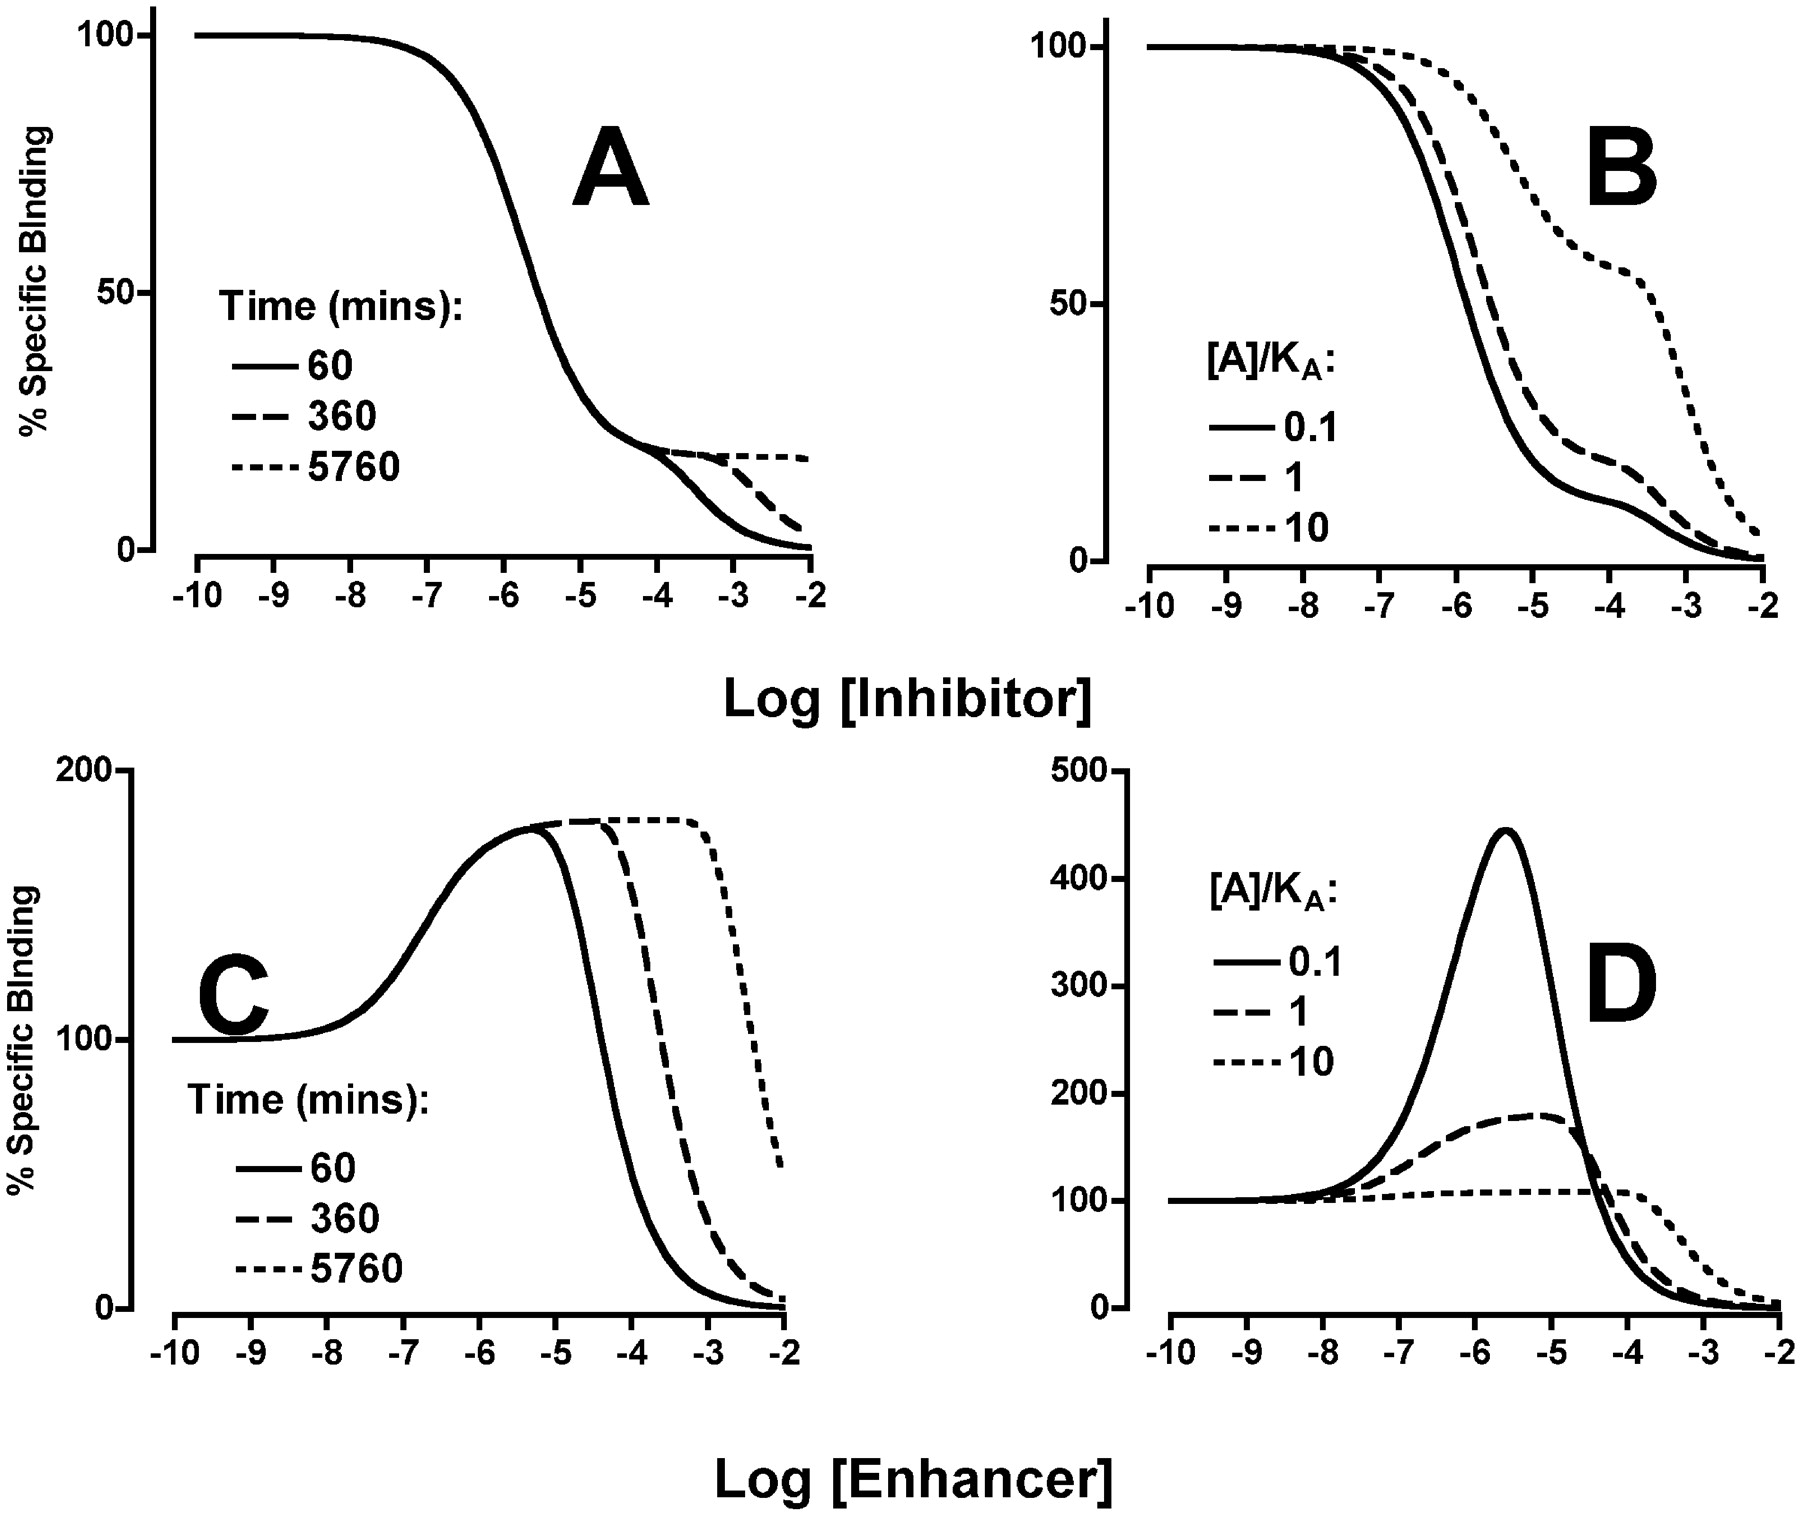
Verifying the Predictions of a Kinetic ATCM of Allosteric Interaction. The finding that each modulator is able to completely prevent the dissociation of [3H]NMS when used at high concentrations supports the hypothesis that complex binding curves noted for both negative and positive allosteric modulators that cause this kinetic effect are due to a nonequilibrium state, rather than to some other mode of ligand-receptor interaction. To further test and validate the predictions of the kinetic ATCM, simulations were performed to inform the design of additional experiments. The salient features of the simulations are illustrated in Fig. 6; the kinetic ATCM predicts that increasing incubation time leads to a progressive loss of biphasic binding for negative allosteric modulators (Fig. 6A), or a loss in bell-shaped binding for allosteric enhancers (Fig. 6C). If orthosteric ligand concentration is increased, the most striking effect is a change in the apparent proportion of the two phases of binding for allosteric inhibitors (Fig. 6B); a reduction in the stimulatory phase of the curve for allosteric enhancers is also predicted (Fig. 6D).

Theoretical simulations according to a kinetic model of allosteric interactions (eqs. 6-9 under Materials and Methods) depicting the effects of an allosteric inhibitor (α = 0.1) (A and B) or an allosteric enhancer (α = 10) (C and D) on the percentage of specific binding of an orthosteric radioligand under conditions of varying incubation time (A and C) or varying radioligand concentration (B and D). The model parameters koff = 0.5 min-1 and koffB = 0 min-1 were constant for all the simulations. For A and C, the value of log[A] = log KA; for B and D, the time = 60 min. Other parameters are as indicated in each panel.
Experiments performed to test these predictions of the kinetic ATCM (Figs. 7 and 8) were in excellent agreement with the simulations shown in Fig. 6. Because the most noticeable effect on allosteric inhibitors, according to the simulations, was observed when orthosteric ligand concentration was altered, we performed binding assays where the concentration of [3H]NMS was altered by a factor of 10. As shown in Fig. 7, both gallamine and C7/3-phth yielded biphasic curves where the proportion of the two phases differed with radioligand concentration. The data were globally fitted to the kinetic ATCM (eqs. 6-9 under Materials and Methods), yielding the curves shown in Fig. 7 and parameter values in Table 2.

Effects of gallamine (A) and C7/3-phth (B) on the binding of 0.2 nM [3H]NMS (•) or 2 nM [3H]NMS (○) at human M2 mAChRs expressed in CHO cell membranes. Incubations were for 60 min at 37°C. Data points represent the mean ± standard error of the mean of three experiments conducted in triplicate. Nonspecific binding was defined using 10 μM atropine. The curves through the points represent the best global fit of a kinetic ATCM (eqs. 6-9 under Materials and Methods), with the parameters LogKB and Logα constrained to be shared between both data set pairs in each panel. All other details as for Fig. 3.

A, effects of alcuronium on the binding of 0.2 nM [3H]NMS at human M2 mAChRs expressed in CHO cell membranes. Incubations were for 90 min (•) or 180 min (○) at 37°C. B, effects of alcuronium on the binding of 0.2 nM (•) or 2 nM (○) [3H]NMS at human M2 mAChRs expressed in CHO cell membranes. Incubations were for 90 min at 37°C. All other details as for Fig. 7.
For alcuronium, both types of experimental manipulations were performed, i.e., changing incubation time (Fig. 8A) or radioligand concentration (Fig. 8B). As shown in Fig. 8, excellent agreement was again found between the predictions of the kinetic ATCM and the experimental findings. Global nonlinear regression analysis based on the kinetic ATCM yielded the curves superimposed on the data points in Fig. 8; the parameter values obtained for the interaction are shown in Table 2.
Importantly, the dissociation kinetic experiments described previously (Fig. 5) allowed for an independent check on the reliability of the model parameters derived from fitting the nonequilibrium binding data to the kinetic ATCM (Figs. 7 and 8). Specifically, the quotient of the values of KB and α determined by application of the kinetic ATCM to the nonequilibrium binding data should be theoretically identical to the composite parameter (KB/α) determined in the dissociation kinetic studies. As shown in Table 2, the parameter values obtained using the two different types of experimental paradigms were not significantly different from one another (p > 0.05); the ATCM is thus sufficient to accommodate all experimental observations noted in the present study. Subsequent analysis of the intact cell binding data (Fig. 4) according to the kinetic ATCM yielded the parameter values shown in Table 3.
Ternary complex model binding parameters for various allosteric modulators against [3H]NMS at human M2 mAChRs expressed in intact CHO cells
Discussion
This study provides further support for a kinetic ATCM to explain and quantify complex binding isotherms of mAChR allosteric modulators. In particular, we have illustrated for the first time how multiphasic curves displayed by negative allosteric inhibitors as a consequence of nonequilibrium binding can seem practically indistinguishable from multisite orthosteric binding. In addition, we have demonstrated how a novel method for model comparison that is based on information theory, rather than hypothesis testing, can be used to compare pharmacological models. Our findings are particularly relevant to drug discovery targeting tissues that expresses multiple GPCR subtypes, many of which possess allosteric binding sites (see below).
The ATCM is mathematically identical to the more widespread ternary complex model that has previously been applied to the allosteric interaction between agonists, GPCRs and G proteins (De Lean et al., 1980; Ehlert, 1985), with one important difference: the G protein ternary complex model can lead to shallow binding curves if G protein is limiting, whereas the ATCM does not, because allosteric modulator ligands are invariably present in excess relative to the concentration of receptor. At equilibrium, therefore, the ATCM predicts monophasic, sigmoid curves for both positively and negatively cooperative interactions. Early studies with alcuronium, however, revealed the impact of kinetic artifacts on allosteric enhancer binding curves. Tuček et al. (1990) showed that low concentrations of alcuronium enhanced [3H]NMS binding to native rat M2 mAChRs, whereas higher concentrations reduced binding. This finding was originally interpreted in terms of a mechanism where the modulator bound to the M2 mAChR allosteric site with high affinity but also recognized the orthosteric site with lower affinity. However, Proska and Tuček (1994) subsequently demonstrated that the phenomenon was an artifact related to the ability of the modulator to slow the binding kinetics of the radioligand. Indeed, preequilibration of radioligand with receptor before addition of modulator, coupled with extended equilibration times (>24 h), have revealed a conversion of the bell-shaped curves of alcuronium versus [3H]NMS to monophasic sigmoid curves, as predicted by the equilibrium ATCM (Jakubík et al., 1995). Additional studies by Lazareno and Birdsall (1995) extended the findings of Tuèek and colleagues to demonstrate the general nature of the kinetic effects of allosteric modulators at mAChRs, and how these effects can be used to derive quantitative information regarding the equilibrium binding properties of the modulators, even when the experimental data are obtained under nonequilibrium conditions.
As shown in the present study, the kinetic ATCM provides an internally consistent explanation for the effects of alcuronium against [3H]NMS in both membranes and intact cells (Figs. 3B and 4B), and under conditions of varying incubation time or radioligand concentration (Fig. 8). The ability to experimentally test the predictions of a model in this manner is essential if the model is to be used to provide quantitative parameter estimates (KB and α values) that are incorporated into structure-activity studies aimed at developing novel modulator compounds. These experiments reiterate the need to rigorously test mechanistic proposals regarding the actions of ligands that yield bell-shaped binding curves. This is relevant beyond the mAChR family, because bell-shaped binding curves for allosteric enhancers have also been described at other GPCRs, such the A1 adenosine receptor (Bruns and Fergus, 1990) and the 5-hydroxytryptamine2C receptor (Im et al., 2003); the possible impact of kinetic artifacts in these systems has yet to be rigorously explored.
A more common observation than bell-shaped curves in radioligand binding assays is the biphasic inhibition binding isotherm, and it is this issue in particular that the present study aimed to address with respect to the actions of negative allosteric modulators of the mAChRs. In the simplest case, biphasic inhibition curves are usually ascribed to the presence of two noninterconverting binding sites for which the inhibitor has different affinities, for example, if the tissue of interest expressed two subtypes of the same receptor (Kenakin, 1997). However, even in tissues where the GPCR of interest is expressed alone, as is usually the case for recombinant expression systems, biphasic inhibition binding curves may still arise due to ligand-mediated interconversion of the receptor between high- and low-affinity states associated with receptor coupling to other cellular proteins, such as G proteins (De Lean et al., 1980; Christopoulos and El-Fakahany, 1999). Other reasons include desensitization-related processes in intact cell binding assays (Insel et al., 1983; Toews et al., 1983; Toews and Perkins, 1984) or cooperative interactions between receptor oligomers (Wregget and Wells 1995).
Given the number of possible mechanisms to account for multiphasic binding curves, it is important to assess experimental occurrences of the phenomenon in terms of the most parsimonious model possible. In the pharmacological literature, the most common approaches to comparing different models are based on hypothesis testing; tests such as the F-test or extra-sum-of-squares test are almost invariably used to determine whether an increase in the complexity of a given model (increase in parameters) is worth the ensuing loss of degrees of freedom (Christopoulos and Lew, 2000). However, these tests are limited to nested models, i.e., models that are special cases of a related general model (e.g., one-site versus two-site fit). Our present study highlights the alternative situation, i.e., the need to compare an experimental data curve-fit in terms of totally different mechanistic models. The AIC approach we have adopted is one that has, to our knowledge, not been used widely in pharmacological analyses but is common in other biological sciences (Burnham and Anderson, 2002). Rather than being based on hypothesis testing, the AIC approach is based on information theory and assesses the likelihood of a given model. Importantly, the calculation of AIC values and associated evidence ratios is based on the same types of information utilized by the F test, namely, the change in degrees of freedom associated with a change in model parameters. The use of a corrected AIC method (AICC), which is particularly suited to sample sizes commonly collected in pharmacological studies (Motulsky and Christopoulos, 2003), thus allowed us to directly compare a two-site orthosteric model to a kinetic ATCM as mechanistic descriptors of the allosteric inhibitor binding data.
In the present case, the kinetic ATCM was deemed the simplest model able to accommodate all experimental observations. For example, in addition to the predicted effects on the binding of allosteric enhancer (outlined above), the kinetic ATCM predicts a change in the proportion of apparent “high-” and “low-” affinity “states” for an allosteric inhibitor with a change in radioligand concentration (Figs. 6B and 7). This is due to the fact that the first phase of the curve (lower concentrations of modulator) represents an interaction that is essentially at equilibrium and indicative of the true degree of negative cooperativity between radioligand and modulator, whereas the second phase of the curve (higher concentrations of modulator) reflects a lack of adequate equilibration. In contrast, a two-site orthosteric binding model does not predict a change in the proportion of apparent affinity states with changing concentrations of a nonsubtype-selective orthosteric radioligand, such as [3H]NMS. Thus, an experimental design that incorporates two different concentrations of orthosteric radioligand can assist in the differentiation between the two modes of ligand-receptor interaction.
Importantly, the ATCM lends itself to two independent experimental approaches with which to check its consistency. The first is the nonequilibrium assay, which provides individual estimates of KB and α. The second approach is the dissociation kinetic assay, which begins with an equilibrated [3H]NMS-receptor complex and monitors the effects of the (subsequently) added modulator on the dissociation of this complex. Provided that the addition of modulator leads to rapid equilibration with the allosteric site, then the observed effect of the modulator on radioligand dissociation is proportional to the occupancy of the allosteric site on the [3H]NMS-occupied receptor, and the assay can thus be used to derive a composite measure of KB/α (Lazareno and Birdsall, 1995; Ellis, 1997). As shown in Table 2, the two different approaches yield essentially identical results, providing strong evidence for the use of the kinetic ATCM in quantifying both negative and positive allosteric modulator effects.
It can be argued that kinetic artifacts in the interaction between orthosteric and negative allosteric ligands are not as severe as those involving positive or neutral allosteric ligands; truncated modulator inhibition isotherms (i.e., removal of the points defining the effects of the highest concentrations of modulator so as to yield a monophasic curve) can be fitted to the equilibrium ATCM to derive reasonable estimates of KB and α (not shown). However, we believe that this practice is unnecessary from a practical point of view and potentially misleading from a mechanistic point of view. If prior knowledge exists that the inhibitor is an allosteric modulator that can retard orthosteric ligand kinetics, then the kinetic ATCM can be fitted to all the data points without the need to truncate the curve. This increases the degrees of freedom associated with the analysis and parameter estimates. More importantly, if there is no a priori reason to suspect that the inhibitor is an allosteric modulator, then an appreciation of the kinetic effects of such ligands is important on diagnostic grounds, and truncating such curves removes valuable information.
Drug discovery programs are increasingly identifying potent allosteric ligands, many of which exhibit negative cooperativity with orthosteric ligands, and it is thus possible that the initial characterization of such compounds in routine binding assays can be misinterpreted if the modulator exhibits complex binding. This is particularly the case when targeting tissues, such as the central nervous system, which expresses multiple GPCRs known to possess allosteric binding sites, including the mAChRs, adrenoceptors, dopamine, serotonin, adenosine, metabotropic glutamate, and GABAB receptors (Christopoulos and Kenakin, 2002). The ability to differentiate allosteric from orthosteric, and equilibrium from nonequilibrium effects, is therefore highly relevant to the development of more selective and effective GPCR-targeting ligands.
Appendix
Shown below is the programming that can be typed as a user-defined equation for fitting experimental data to eqs. 6 to 9 using the Prism program (GraphPad Software, Inc.):
KA = 10^LogKA
KB = 10^LogKB
B = 10^X
alpha = 10^Logalpha
KApp = KA* (1 + B/KB)/(1 + alpha*B/KB)
koffobs = ((B*koffB/(KB/alpha)) + koff)/(1 + (B/(KB/alpha)))
konobs = koffobs* (1 + FixedHot/KApp)
Bab = (Bmax* (FixedHot/KApp))/(1 + (FixedHot/KApp))
Y = Bab* (1 - exp (-time*konobs))
The parameters LogKA, LogKB, and Logalpha denote the logarithms of the KA, KB, and α parameters, respectively, in the ATCM (Fig. 1); the parameter FixedHot denotes the concentration of radioligand (M). This equation can be used as written above in any version of the Prism program to fit single modulator binding curves obtained under nonequilibrium conditions and, in theory can yield estimates of Bmax, log KA, koff, koffB, log KB, and log α. The value of FixedHot is set as a constant, and the value of time is also fixed to the time of the incubation. Of course, if the data cannot define the model well, all of these parameters may not be reliably estimated in a single fit. However, some of them can be determined in other types of experiments and then set as constants when fitting the above model. Specifically, a) Bmax and log KA may be fixed to values determined previously from saturation experiments. Alternatively, log KA can be fixed to a previously determined value, and Bmax may be estimated from the model fit (this is preferable to fixing Bmax and estimating log KA; Lazareno and Birdsall (1995); b) interactions characterized by neutral cooperativity may necessitate fixing the value of koff (control radioligand dissociation rate) to that determined from separate kinetic experiments. This is because of the high degree of correlation between koff and log KB in the curve fitting procedure; and c) if the modulator exerts a maximal or close to maximal slowing of radioligand dissociation at high modulator concentrations, the parameter koffB may need to be fixed to a value of or near zero.
Footnotes
-
This work was supported by Project Grant 251538 of the National Health and Medical Research Council of Australia (NHMRC). A.C. and P.S. are Senior Research Fellows of the NHMRC. V.A. and L.M. are recipients of a Melbourne Research Scholarship.
-
DOI: 10.1124/jpet.103.059840.
-
ABBREVIATIONS: GPCR, G protein-coupled receptor; mAChR, muscarinic acetylcholine receptor; ATCM, allosteric ternary complex model; [3H]NMS, [3H]N-methylscopolamine; C7/3-phth, heptane, 1,7-bis-(dimethyl-3′-phthalimidopropyl)-ammonium bromide; CHO, Chinese hamster ovary; AIC, Akaike's Information Criterion; K-L, Kullback-Liebler.
- Received September 10, 2003.
- Accepted November 26, 2003.
- The American Society for Pharmacology and Experimental Therapeutics


