


Abstract
The human ATP-binding cassette (ABC) transporter ABCG2 (BCRP/MXR1/ABCP) plays a critical role in cellular protection against xenobiotics as well as pharmacokinetics of drugs in our body. In the present study, we aimed to analyze the quantitative structure-activity relationship (QSAR) latently residing in ABCG2-drug interactions. We first established standard methods for expression of human ABCG2 in insect cells, quality control of plasma membrane samples by using electron microscopy techniques, and high-speed screening of ABCG2 inhibition with test compounds. Plasma membrane vesicles prepared from ABCG2-expressing Sf9 cells were used as a model system to measure the ATP-dependent transport of [3H]methotrexate (MTX). Forty-nine different therapeutic drugs and natural compounds were tested for their ability to inhibit ABCG2-mediated MTX transport. Based on their inhibition profiles, we performed QSAR analysis using chemical fragmentation codes deduced from the structures of test compounds. Multiple linear regression analysis delineated a relationship between the structural components and the extent of ABCG2 inhibition, allowing us to identify one set of structure-specific chemical fragmentation codes that are closely correlated with the inhibition of ABCG2 transport activity. Based on the QSAR analysis data, we predicted the potency of gefitinib to inhibit ABCG2. The validity of our QSAR-based prediction for gefitinib was examined by actual experiments. Our kinetic analysis experiments suggest that the ABCG2-ATP complex binds gefitinib. The present study provides a new strategy for analyzing ABCG2-drug interactions. This strategy is considered to be practical and useful for the molecular designing of new ABCG2 modulators.
Accumulating evidence suggests that ATP-binding cassette (ABC) transporters play pivotal roles in determining the pharmacokinetic profiles of drugs and, by extension, their overall pharmacological effects and drug concentration at the target site. Human ABCG2 (ABCP/BCRP/MXR) belongs to the ABC transporter family (Allikmets et al., 1998; Doyle et al., 1998; Miyake et al., 1999) and transports a wide variety of compounds, including cytotoxic agents (mitoxantrone, topotecan, flavopiridol, and methotrexate) (Maliepaard et al., 1999; Jonker et al., 2000; Litman et al., 2000; Kim et al., 2002; Volk et al., 2002; Chen et al., 2003; Mitomo et al., 2003), fluorescent dyes (e.g., Hochest 33342) (Kim et al., 2002), and different toxic compounds found in normal food (e.g., 2-amino-1-methyl-6-phenylimidazo[4,5-β]pyridine) (van Herwaarden et al., 2003). Overexpression of ABCG2 reportedly confers cancer cell resistance to anticancer drugs, such as mitoxantrone, topotecan, and 7-ethyl-10-hydroxycamptothecin (SN-38: active metabolite of irinotecan). SN-38-selected PC-6/SN2–5H human lung carcinoma cells were shown to overexpress ABCG2 with reduced intracellular accumulation of SN-38 and its glucuronide metabolite (Kawabata et al., 2001). We have recently demonstrated that plasma membrane vesicles prepared from those cells ATP-dependently transported both SN-38 and SN-38-glucuronide (Nakatomi et al., 2001; Yoshikawa et al., 2004), and our results strongly suggested that ABCG2 is involved in the active extrusion of SN-38 and its metabolite from cancer cells.
ABCG2 is expressed not only in cancer cells, but also endogenously in placental trophoblast cells, in the epithelium of the small intestine and liver canalicular membrane, as well as in ducts and lobules of the breast. In particular, apical localization of ABCG2 in the epithelium of the small intestine and colon indicates its possible role in the regulation of the uptake of p.o. administered drugs and xenobiotics. It has been demonstrated that mouse Abcg2 protects against pheophorbide a, a major chlorophyll-derived dietary phototoxin (Jonker et al., 2002). Mouse Abcg2 is considered to be involved in exportation of chlorophyll and porphyrin metabolites in the small intestine, thereby preventing phototoxicity in light-exposed skin. In addition, high expression of human ABCG2 in placental trophoblast cells suggests that ABCG2 is responsible for protecting the fetus from toxic xenobiotics and/or removing toxic metabolites from the fetal blood supply (Doyle and Ross, 2003; Sarkadi et al., 2004). On the other hand, Jonker et al. (2005) have recently provided important evidence that mouse Abcg2 plays a role in concentrating drugs (e.g., topotecan and cimetidine) and carcinogenic xenotoxins (e.g., 2-amino-1-methyl-6-phenylimidazo[4,5-β]pyridine) into milk. These findings suggest that human ABCG2 in the mammary gland epithelium can enhance the risk of long-term exposure to environmental and dietary toxins in infants.
As described above, human ABCG2 exhibits broad substrate specificity toward structurally diverse compounds, as do other ABC transporters, such as ABCB1 (P-glycoprotein/MDR1), ABCC1 (MRP1/GS-X pump), and ABCC2 (MRP2/cMOAT). Hitherto, several research groups have investigated the quantitative structure-activity relationship (QSAR) of ABCB1 substrates (Klopman et al., 1997; Schmid et al., 1999; Ekins et al., 2002; Stouch and Gudmundsson, 2002; Ishikawa et al., 2004) and tried to establish theoretical calculation methods. However, at the present time, little information is available regarding QSARs in the substrate specificity of ABCG2.
To gain insight into the relationship between the molecular structure of compounds and the ABCG2-mediated transport activity, we have recently developed a high-speed screening method for analyzing the substrate specificity of ABCG2 (Ishikawa et al., 2005). In the present study, we have established standard methods for expression of human ABCG2 in Sf9 insect cells, quality control of plasma membrane vesicle by using electron microscopy techniques, and high-speed screening of ABCG2 function. Furthermore, we have developed an algorithm that analyzes QSARs to evaluate ABCG2-drug interactions. Based on both experimental results and computational QSAR analysis data, we herein propose a hypothetical mechanism underlying ABCG2-mediated drug transport and its interaction with gefitinib (Iressa), a potent epidermal growth factor receptor inhibitor, and other drugs.
Materials and Methods
Chemicals and Biochemicals. The following compounds and therapeutic drugs were purchased from the commercial sources indicated in parentheses: ATP, adenosine 5′-(β,γ-imido)triphosphate (AMP-PNP), epinephrine, norepinephrine, serotonin, meratonin, nifedipine, bepridil, fendiline, prenylamine, nicardipine, dexamethasone, prednisolone, cortisone, pinacidil, acetylsalicylic acid, indomethacin, acemetacin, ibuprofen, naproxen, mepirizole, vinblastine, etoposide, doxorubicin, daunorubicin, paclitaxel, 5-fluorouracil, quinidine, p-aminohippuric acid, penicillin G, novobiocin, hemin, hematoporphyrin, and pheophorbide a (Sigma-Aldrich Japan KK, Tokyo, Japan); glutamic acid, dopamine, GABA, histamine, verapamil, diltiazem, betamethasone, nicorandil, actinomycin D, mitoxantrone, prazosin, estrone-3-sulfate, reserpine, and methotrexate (Wako Pure Chemicals, Osaka, Japan); glutaraldehyde, performaldehyde, glycine, quercetin, creatine kinase, creatine phosphate, EGTA, EDTA, Tris, Hepes, and the cacodylate buffer solution (Nacalai Tesque, Inc., Kyoto, Japan); and tacrolimus (Calbiochem, Darmstadt, Germany). SN-38 and gefitinib were generously provided by Yakult Honsha Co., Ltd. (Tokyo, Japan) and AstraZeneca (Alderley Park, Cheshire, UK), respectively. All other chemicals were of analytical grade.
Expression of ABCG2 in Sf9 Insect Cells. The cDNA of human ABCG2 (wild type) was prepared as described previously (Mitomo et al., 2003) and inserted into the pFastBac1 vector at the restriction enzyme EcoRI site. Recombinant baculoviruses to express the above-mentioned variant forms of ABCG2 in insect cells were generated with the Bac-to-Bac Baculovirus Expression System (Invitrogen, Carlsbad, CA) according to the manufacturer's instructions. Insect Spodoptera frugiperda Sf9 cells (1 × 10⁶ cell/ml) were infected with the recombinant baculoviruses and cultured in EX-CELL 420 insect serum-free medium (JRH Bioscience, Levexa, KS) at 26°C with gentle shaking. The expression of ABCG2 in Sf9 cells increased during the incubation. Three days after the infection, cells were harvested by centrifugation. Cells were subsequently washed with phosphate-buffered saline at 4°C, collected by centrifugation, and stored at –80°C until used.
Preparation of the Plasma Membrane Vesicles from Sf9 Cells. Plasma membrane vesicles were prepared from ABCG2-expressing Sf9 cells as described previously (Ishikawa et al., 2005). The frozen cell pellet was thawed quickly, diluted 40-fold with a hypotonic buffer (0.5 mM Tris-Hepes, pH 7.4, 0.1 mM EGTA, and 1 μM leupeptin), and then homogenized with a Potter-Elvehjem homogenizer. After centrifugation at 2000g, the supernatant was further centrifuged at 100,000g for 30 min. The resulting pellet was suspended in 0.25 M sucrose containing 10 mM Tris-Hepes, pH 7.4, and 1 μM leupeptin. The crude membrane fraction was layered over 40% (w/v) sucrose solution and centrifuged at 100,000g for 30 min. The turbid layer at the interface was collected, suspended in 0.25 M sucrose containing 10 mM Tris-Hepes, pH 7.4, and centrifuged at 100,000g for 30 min. The membrane fraction was collected and resuspended in a small volume (150–250 μl) of 0.25 M sucrose containing 10 mM Tris-Hepes, pH 7.4. After the protein concentration was measured by the BCA Protein Assay Kit (Pierce Chemical, Rockford, IL), the membrane solution was stored at –80°C until used.
Immunological Detection of ABCG2 Expression in Plasma Membrane. Expression of ABCG2 in Sf9 cell membranes was determined by immunoblotting with BXP-21 (Signet Laboratories, Dedham, MA), a specific antibody to human ABCG2, where membrane proteins were pretreated with or without mercaptoethanol. Briefly, proteins of the isolated plasma membrane were separated by electrophoresis on 7.5% SDS-polyacrylamide slab gels, and the proteins were electroblotted onto Hybond ECL nitrocellulose membranes (Amersham, Buckinghamshire, UK). Immunoblotting was performed by using BXP-21 (1:250 dilution) as the first antibody and an anti-mouse IgG-horseradish peroxidase conjugate (Cell Signaling Technology, Beverly, MA) (1:3000 dilution) as the second antibody. Horseradish peroxidase-dependent luminescence was developed by using Western Lighting Chemiluminescent Reagent Plus (PerkinElmer Life and Analytical Sciences, Boston, MA) and detected by a Lumino Imaging Analyzer FAS-1000 (Toyobo, Osaka, Japan).
Electron Microscopy. The cultured Sf9 cells were fixed with Karnovsky's fixative [5% (w/v) glutaraldehyde, 80 mM cacodylate buffer, pH 7.4, and 4% (w/v) performaldehyde], postfixed with 2% osmium tetroxide at 4°C for 2 h and 0.05% ruthenium tetroxide at room temperature for 5 min in the dark, and then prepared as described previously (Osumi et al., 1995). After being dried by t-butyl freeze-drying, the specimens were coated with magnetron sputtering (platinum, 2 nm) and viewed with a high resolution scanning electron microscope, S-4300 (Hitachi, Tokyo, Japan) at an acceleration voltage of 2 kV. Otherwise, the specimens were coated with 2-nm-thick platinum-carbon in a High Vacuum Freeze-Etch Unit BAF 301 by using an Electron Gun EK522 (Balzers, Liechtenstein) before observation and viewed with an ultra-high resolution-low-voltage scanning electron microscope S-900LV commercially available as model S-900H (Hitachi) at an acceleration voltage of 2 kV. The plasma membrane vesicles were fixed with 2% (w/v) glutaraldehyde, 0.1 M cacodylate buffer, pH 7.4, containing 0.4 M sorbitol for 1 h at 4°C. The specimens were viewed with an UHR-SEM 5200 (Hitachi, Japan) at an acceleration voltage of 2 kV. To observe the ultrastructure of vesicles, the specimens prepared with negative staining were observed by a transmission electron microscope JEM 1200EX (JEOL, Tokyo, Japan) at an acceleration voltage of 80 kV. Negative staining was done with a 3% aqueous solution of uranyl acetate (Osumi et al., 1989).
High-Speed Screening of ATP-Dependent [3H]Methotrexate Transport Mediated by ABCG2. The frozen stocked membrane was thawed quickly at 37°C, and vesicles were formed by passing the membrane suspension through a 27-gauge needle. The standard incubation medium contained plasma membrane vesicles (50 μg of protein), 200 μM [3′,5′,7′-3H]MTX (Amersham, Buckinghamshire, UK), 0.25 M sucrose, 10 mM Tris-Hepes, pH 7.4, 10 mM MgCl2, 1 mM ATP, 10 mM creatine phosphate, and 100 μg/ml creatine kinase in a final volume of 100 μl. The incubation was carried out at 37°C. After a specified time (20 min for the standard condition), the reaction medium was mixed with 1 ml of ice-cold stop solution (0.25 M sucrose, 10 mM Tris-Hepes, pH 7.4, and 2 mM EDTA) to terminate the transport reaction. Subsequently, aliquots (280 μl/well) of the resulting mixture were transferred to MultiScreen plates (Nihon Millipore KK, Tokyo, Japan). Under aspiration, each well of the plate was rinsed with the 0.25 M sucrose solution containing 10 mM Tris-Hepes, pH 7.4, for four times (four 200-μl rinses for each well) in an EDR384S system (BioTec, Tokyo, Japan). [3H]MTX thus incorporated into the vesicles was measured by counting the radioactivity remaining on the filter of MultiScreen plates, as described previously (Ishikawa et al., 2005).
QSAR Analysis Using Chemical Fragmentation Codes. To execute the QSAR analysis for the natural compounds and drugs tested in this study, we generated their chemical fragmentation codes by using the Markush TOPFRAG program (http://scientific.thomson.com/support/patents/patinf/terms/) (Derwent Information Ltd., London, UK). The chemical fragment codes are a set of alphanumeric symbols, each representing a fragment of a chemical structure. The Markush TOPFRAG program is a tool for searching the chemical structures and structure information in Derwent's online databases (http://scientific.thomson.com/support/patents/patinf/terms/). In the present study, we have formulated the extent of ABCG2-mediated MTX transport as a linear combination of chemical fragmentation codes, each of which was weighted by the corresponding coefficient as follows:  where the symbol (i) designates a specific chemical fragmentation. The “score” means the presence or absence of the corresponding chemical fragmentation code (i) in the chemical structure of a test compound. Based on the chemical fragmentation codes thus obtained and in comparison with the observed inhibition of transport activity for each test compound, we have calculated chemical fragmentation coefficients, C(i), by multiple linear regression analysis.
Calculation of ClogP. The ClogP values of the natural compounds and drugs tested in this study were calculated by using ChemDraw software version 8.0. The ClogP algorithm incorporated in the ChemDraw software is licensed from BioByte Corporation (http://www.biobyte.com) and has been extensively tested and peer-reviewed as providing accurate results (http://www.biobyte.com/bb/prod/40manual.pdf).

Characterization of Sf9 cells infected with ABCG2-recombinant baculovirus. A, SEM images of Sf9 cells before and after ABCG2-virus infection. The horizontal bar indicates 5 μm. B, time courses of the cell density after ABCG2-virus infection. The numbers of trypan blue-positive (▵) and negative (•) Sf9 cells were counted separately with a hemocytometer. C, immunoblot analysis of ABCG2 expressed in Sf9 cells after baculovirus infection. Cell lysate samples were prepared from Sf9 cells as described under Materials and Methods. The samples were treated with (+) or without (–) mercaptoethanol before SDS-polyacrylamide gel electrophoresis. MW, molecular weight.
Results
Characterization of Sf9 Cells Infected with Baculovirus. Sf9 cells (1 × 10⁶ cells/ml) were infected with ABCG2-recombinant baculovirus and cultured at 26°C with gentle shaking. Figure 1A shows the scanning electron microscopy (SEM) images of Sf9 cells after virus infection. As clearly demonstrated in the images, the size and morphology of the infected cells changed dramatically. The cell size increased to almost twice after 3 days but decreased thereafter. It is noteworthy that many pores were formed in the Sf9 cell membranes after 5 days of infection. Figure 1B depicts the time course of cell viability, showing that cells started to die 3 days after virus infection. Five days after infection, only 20% of Sf9 cells were alive, as indicated by a small population of trypan blue stain-negative cells.

Effect of ATP concentration (A) and incubation temperature (B) on ABCG2-mediated MTX transport. A, membrane vesicles expressing ABCG2 (50 μg of protein) were incubated with 200 μM [3H]MTX in the presence of ATP at different concentrations in the standard incubation medium (0.25 M sucrose and 10 mM Tris-Hepes, pH 7.4, 10 mM creatine phosphate, 100 μg/ml creatine kinase, and 10 mM MgCl2) at 37°C for 20 min, and the amount of MTX transported into membrane vesicles was detected as described under Materials and Methods; 100% of transport corresponds to the amount of MTX transported in the presence of 1 mM ATP. B, membrane vesicles were incubated with 200 μM[3H]MTX in the presence of 1 mM ATP at 20, 23, 26, 29, 32, 35, or 38°C for 10 min. The amount of MTX transported into membrane vesicles was detected as described under Materials and Methods. This figure demonstrates a relationship between the natural logarithmic value of the MTX transport rate, In V (nanomoles per minute per milligram of protein), and the inverse value of absolute temperature. Data are expressed as mean values ± S.E.M. (n = 3).
Figure 1C shows immunoblot analysis data, where the expression of ABCG2 in Sf9 cells increased during the incubation. When cell lysate samples were treated with mercaptoethanol before SDS-polyacrylamide gel electrophoresis, ABCG2 was detected as a monomer. Without mercaptoethanol treatment, on the other hand, ABCG2 appeared as a homodimer on days 2 and 3; however, by days 4 and 5, unusual and numerous protein bands with molecular weights >130,000 were detected. It is important to note that the molecular weights of those proteins were reduced to the normal size (molecular weight = 65,000) of the ABCG2 monomer by mercaptoethanol treatment (Fig. 1C). These results suggest that ABCG2 protein underwent nonspecific interactions with larger molecules, as the integrity of plasma membrane was disrupted in the later stage (days 4 and 5) of virus infection. In this context, it is concluded that cells should be harvested on day 3 after virus infection.
Characterization of Plasma Membrane Vesicles and ATP-Dependent Transport of MTX. Plasma membrane vesicles prepared from Sf9 cells were observed by negative-stain transmission electron microscopy and SEM. The average size of membrane vesicles was estimated to be approximately 200 nm (data not shown).
We measured ATP-dependent transport of MTX and E3S by using plasma membrane vesicles prepared from ABCG2-expressing Sf9 cells. Both MTX and E3S were transported into the membrane vesicles in an ATP-dependent manner (data not shown), in which vesicles were incubated with 100 μM 3H-labeled MTX or E3S in the presence or absence of ATP at 37°C. ATP-dependent transport of MTX or E3S was not observed in plasma membrane vesicles prepared from mock virus-infected Sf9 cells. The rate of ATP-dependent MTX transport was approximately 2-fold greater than that of E3S transport. Furthermore, the background levels observed without ATP were much lower in the case of MTX transport, compared with that of E3S transport (data not shown). For these reasons, we have selected the MTX transport measurement to assess the ABCG2-drug interactions in the present study.

Inhibition of ABCG2-mediated MTX transport. ATP-dependent [3H]MTX transport in plasma membrane vesicles was measured at 37°C for 20 min in the presence of nifedipine (○), nicardipine (□), daunorubicin (▵), tacrolimus (•), novobiocin (▪), prazosin (▴), or quercetin (♦) at different concentrations in the standard incubation medium (0.25 M sucrose and 10 mM Tris-Hepes, pH 7.4, 10 mM creatine phosphate, 100 μg/ml creatine kinase, and 10 mM MgCl2). MTX transport is expressed as relative values compared with the transport activity measured without test compounds (100% MTX transport). Data are expressed as mean values ± S.E.M. (n = 4).
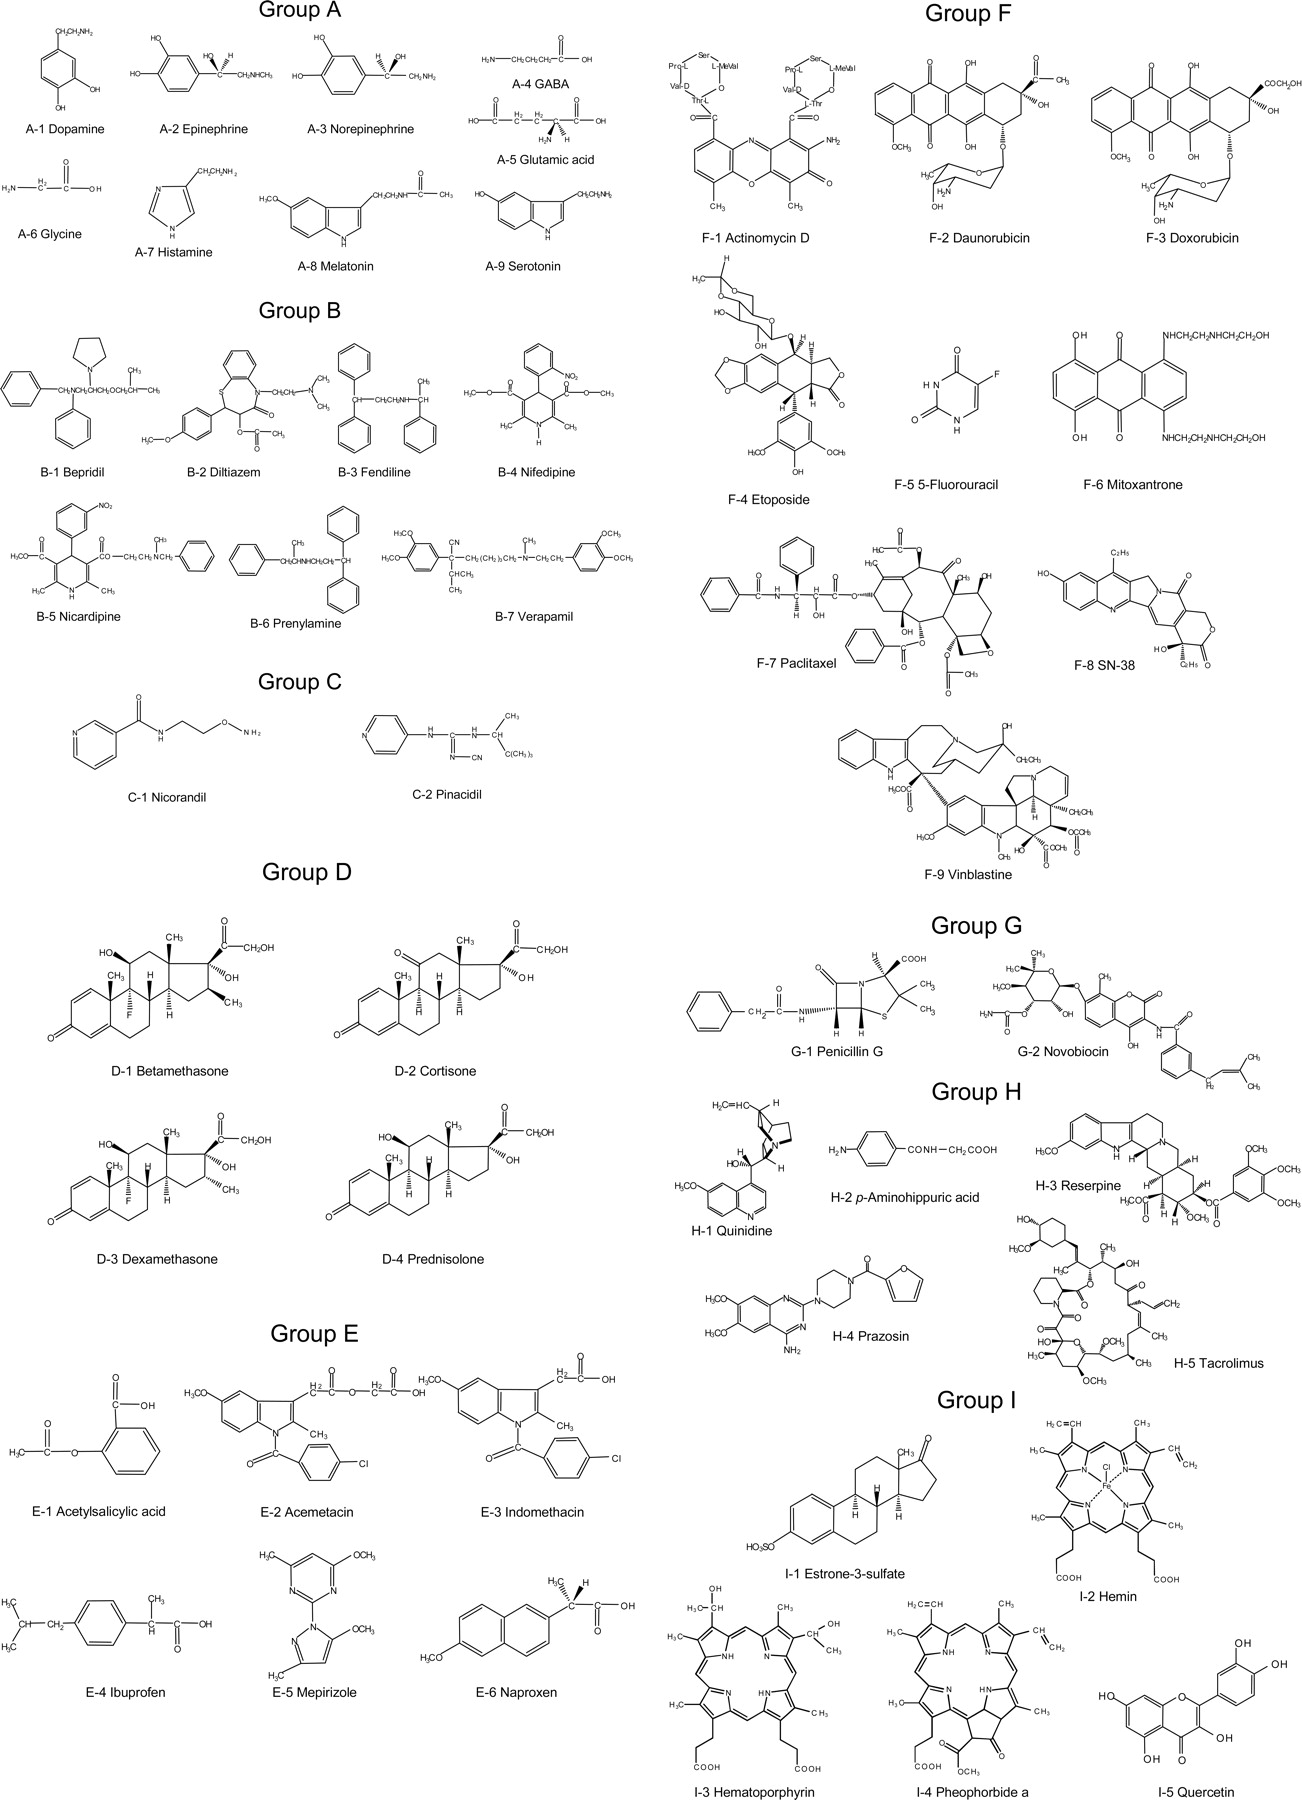
Chemical structures of test compounds used for inhibition of ABCG2-mediated MTX transport. Test compounds are classified into groups A to I.
The MTX transport rate was dependent on ATP concentration and exhibited saturation kinetics (Fig. 2A). From the Lineweaver-Burk plot (inset of Fig. 2A), the apparent Km value was estimated to be approximately 250 μM for ATP. In addition, the rate of MTX transport was dependent on the incubation temperature. Plasma membrane vesicles were incubated with 200 μM[3H]MTX in the presence of 1 mM ATP at various temperatures for 10 min, and the initial rate of MTX transport was plotted against the reaction temperature. A linear relationship was observed between the natural logarithmic value of the MTX transport rate and the inverse value of absolute temperature (Fig. 2B). From the data, the activation energy in the transport process was estimated to be 16.7 kcal/mol.
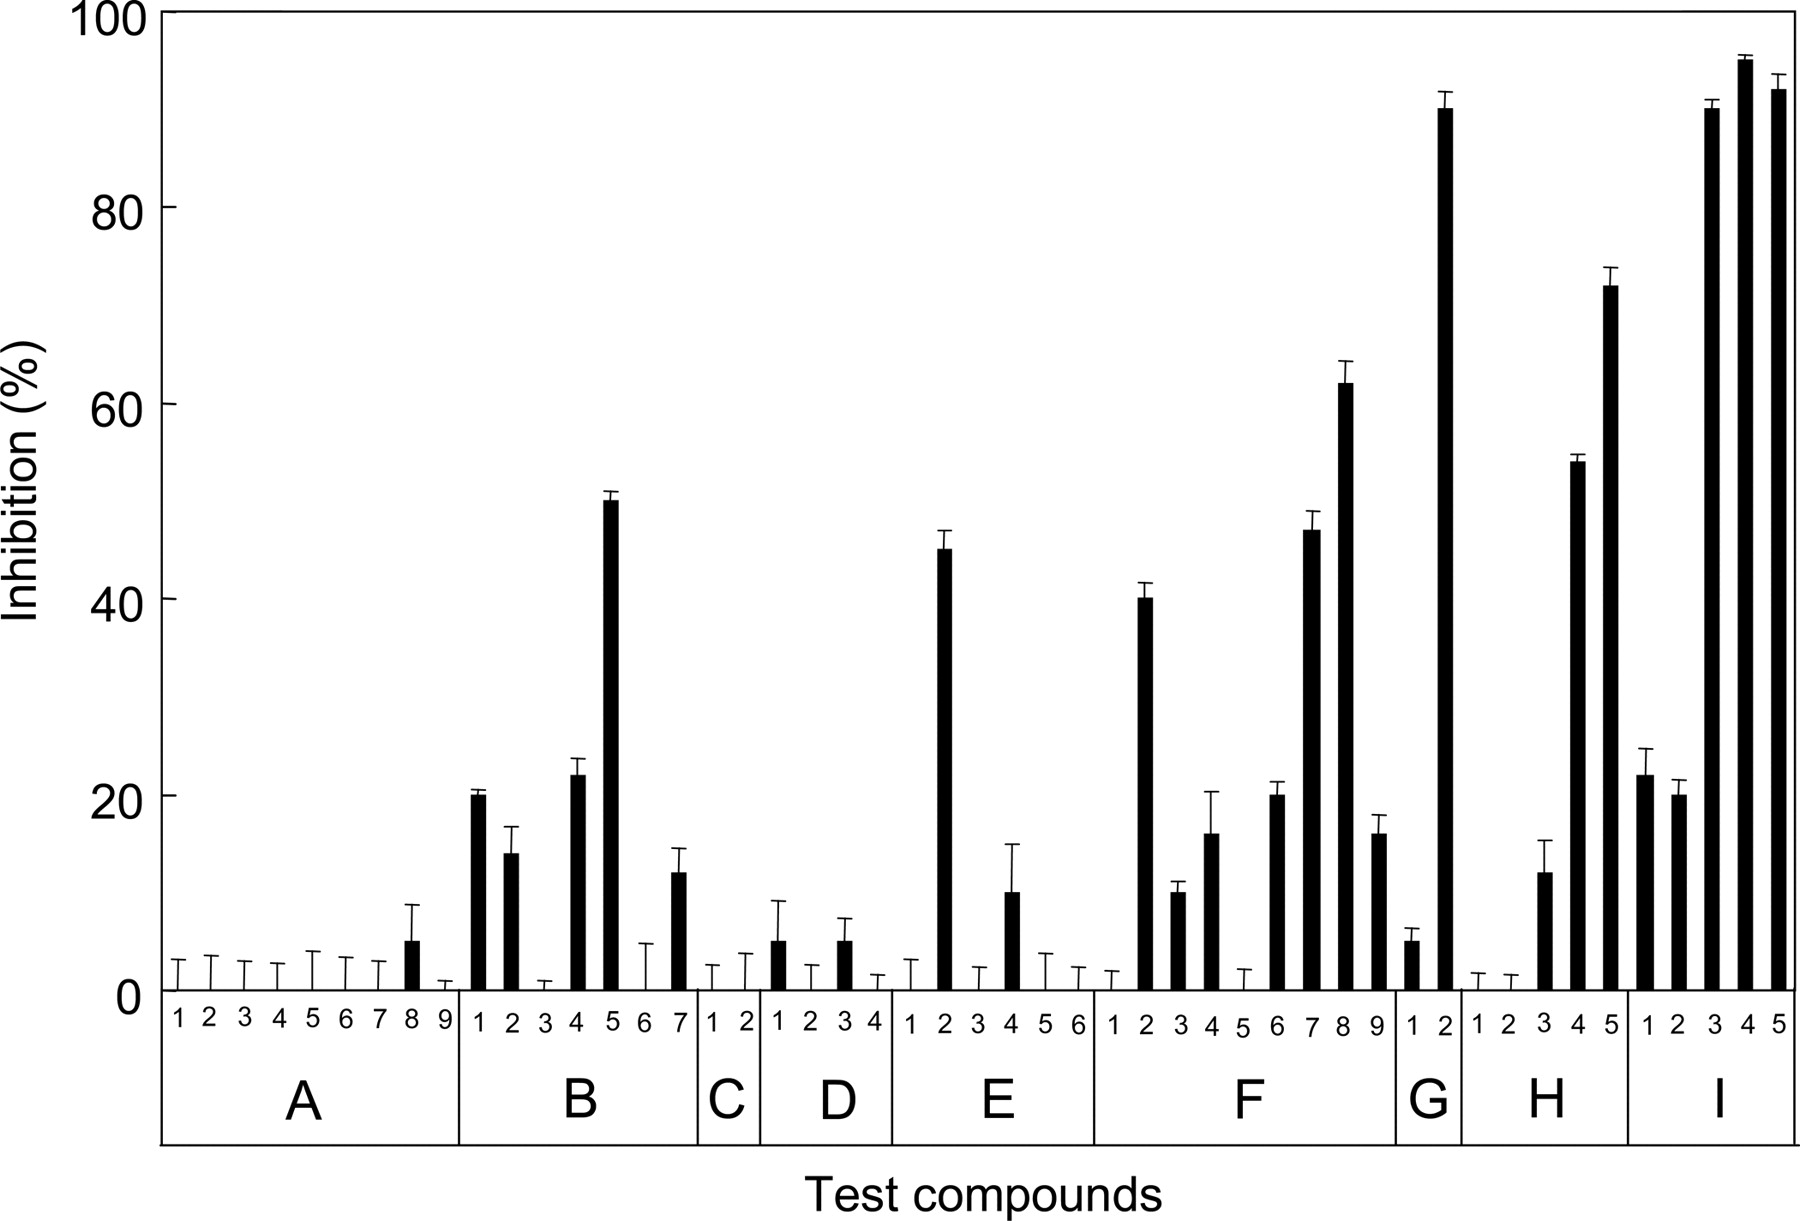
Inhibition of MTX Transport by Test Compounds. By using the high-speed screening system developed in our laboratory (Ishikawa et al., 2005), we have investigated the interaction of ABCG2 with a variety of test compounds. Figure 3 shows dose-dependent curves for the inhibition of ABCG2-mediated MTX transport by nifedipine, nicardipine, daunorubicin, tacrolimus, novobiocin, prazosin, and quercetin. ATP-dependent [3H]MTX transport in plasma membrane vesicles was measured at 37°C for 20 min in the presence of those test compounds at different concentrations. IC50 values were determined to be 60, 28, 12, 10, 6, 0.6, and 0.4 μM for nifedipine, daunorubicin, nicardipine, prazosin, tacrolimus, quercetin, and novobiocin, respectively.
Furthermore, we selected structurally diverse test compounds to investigate the inhibition of MTX transport. The selected test compounds are classified into seven groups, i.e., A, neurotransmitters; B, Ca2+ channel blockers; C, K+ channel modulators; D, steroids; E, nonsteroidal anti-inflammatory drugs; F, anti-cancer drugs; G, antibiotics; H, other drugs; and I, ABCG2 substrates or inhibitors (Fig. 4). Figure 5 summarizes the effects of those test compounds on ABCG2-mediated MTX transport. The test compounds were measured at a concentration of 10 μM, and the data are expressed as relative values compared with the transport activity measured without test compounds (0% inhibition). Among 49 different therapeutic drugs and compounds tested in this study, SN-38 (F-8), novobiocin (G-2), prazosin (H-4), tacrolimus (H-5), hematoporphyrin (I-3), pheophorbide a (I-4), and quercetin (I-5) strongly inhibited ABCG2-mediated MTX transport (Fig. 5).
QSAR Analysis. To gain more insight into the relationship between the chemical structure of test compounds and the inhibition of ABCG2-mediated MTX transport activity, we have performed an QSAR analysis by introducing chemical fragmentation codes. The program Markush TOPFRAG was used to generate the chemical fragmentation codes based on the structural components of test compounds, as described previously (Ishikawa et al., 2004). In the present study, steroids (group D) and estron-3-sulfate were excluded from this analysis, because the Markush TOPFRAG program does not have an algorithm to generate chemical fragmentation codes for steroids. Multiple linear regression analysis delineated a relationship between the structural components and the extent of ABCG2 inhibition (Table 1). Thereby we could identify one set of chemical fragmentation codes that are closely related to the inhibition of ABCG2 transport activity. Explanations for these chemical fragmentation codes are given in Table 2. In this study, we used the descriptor of “OH” to represent five different chemical fragmentation codes for different numbers of hydroxyl (–OH) groups. Likewise, the descriptor of “RS4” was used to represent 18 chemical fragmentation codes for various ring systems. Based on the results of the multiple linear regression analysis, we calculated the values of predicted inhibition and compared them with the observed ones (Table 3). As demonstrated in Fig. 6A, the prediction of transport inhibition was well correlated with the observed values of inhibition. The R2 value was estimated to 0.920.
Descriptors, coefficients, and constant deduced from the inhibition of ABCG2-mediated MTX transport by test compounds
Statistical significance was determined by F-test. R = 0.959; R2 = 0.920; F = 50.1; n = 44. The F value certifies that the QSAR equation is significant.
Descriptors (DES) and chemical fragmentation codes (CFC) closely correlated with the inhibition of ABCG2-mediated MTX transport In the cases of OH and RS4, one descriptor (DES) represents multiple chemical fragmentation codes (CFC).
QSAR-based prediction and comparison with observed values in the inhibition of ABCG2-mediated methotrexate transport and ClogP

Inhibition of MTX transport by test compounds and its profiling. ATP-dependent [3H]MTX transport was measured in the presence of a test compound (10 μM) in the standard incubation medium (0.25 M sucrose and 10 mM Tris-Hepes, pH 7.4, 10 mM creatine phosphate, 100 μg/ml creatine kinase, and 10 mM MgCl2), as described under Materials and Methods. Inhibition (%) is expressed as relative values compared with the transport activity measured without test compounds (0% inhibition). The test compounds used are dopamine (A-1), epinephrine (A-2), norepinephrine (A-3), GABA (A-4), glutamic acid (A-5), glycine (A-6), histamine (A-7), melatonin (A-8), serotonin (A-9), bepridil (B-1), diltiazem (B-2), fendiline (B-3), nifedipine (B-4), nicardipine (B-5), prenylamine (B-6), verapamil (B-7), nicorandil (C-1), pinacidil (C-2), betamethasone (D-1), cortisone (D-2), dexamethasone (D-3), prednisolone (D-4), acetylsalicylic acid (E-1), acemetacin (E-2), indomethacin (E-3), ibuprofen (E-4), mepirizole (E-5), naproxen (E-6), actinomycin D (F-1), daunorubicin (F-2), doxorubicin (F-3), etoposide (F-4), 5-fluorouracil (F-5), mitoxantrone (F-6), paclitaxel (F-7), SN-38 (F-8), vinblastine (F-9), penicillin G (G-1), novobiocin (G-2), quinidine (H-1), p-aminohippuric acid (H-2), reserpine (H-3), prazosin (H-4), tacrolimus (H-5), estrone-3-sulfate (I-1), hemin (I-2), hematoporphyrin (I-3), pheophorbide a (I-4), and quercetin (I-5). Data are expressed as mean values ± S.E.M. (n = 3).
To examine the potential correlation between the inhibition of ABCG2 and the ClogP values of test compounds, we calculated ClogP for each compound (Table 3). Figure 6B demonstrates the two-dimensional plot of the observed values of inhibition versus the ClogP values. As easily recognized, there was no clear correlation between those values.
Prediction and Actual Observation of MTX Transport Inhibition by Gefitinib.Table 4 summarizes the chemical fragmentation codes of gefitinib. H121, M531, D023, and J2 were found as its structural components, whereas M240, OH, H481, or RS4 were not present in the chemical fragmentation codes of gefitinib. From the chemical fragmentation codes of H121, M531, D023, and J2 as well as the corresponding C(i) values, we calculated the potency of gefitinib on ABCG2 inhibition as described in Table 5. Based on our calculation, it is suggested that 10 μM gefitinib inhibits ABCG2-mediated MTX transport almost completely (104% inhibition).
Chemical fragmentation codes (CFC) of gefitinib
The descriptors shown in Table 1 are highlighted in boldface underbars.
Prediction of the inhibition of ABCG2-mediated MTX transport by gefitinib
The inhibition (%) of ABCG2-mediated MTX transport by 10 μM gefitinib was predicted from the following formulation: Inhibition predicted (%) = Σ C(i) × Score(i) + constant. The symbol (i) designates a specific descriptor (i). The “score” means the presence or absence of the corresponding descriptor. The predicted inhibition was estimated to be 104.16%, consistent with the actual inhibition (95%) observed in our experiments.
In actual experiments, we have examined our prediction regarding inhibition of gefitinib. Figure 7A depicts the dose-dependent inhibition of MTX transport by gefitinib. The IC50 value was estimated to be 0.28 μM for gefitinib. At the concentration of 10 μM, gefitinib inhibited MTX transport by 95%. Thus, these data support our QSAR analysis-based prediction (Fig. 6A; Table 5).
To investigate the kinetics of inhibition of gefitinib, we measured the MTX transport rate at different concentrations of both gefitinib and ATP. Namely, ABCG2-expressing membrane vesicles were incubated with 200 μM [3H]MTX in the presence of 0.1, 0.2, 0.5, 1, or 5 mM ATP at 37°C for 20 min, where gefitinib was added to the reaction mixture at a concentration of 0, 0.3, or 1 μM. The Lineweaver-Burk plots, thus obtained, demonstrated three parallel lines (Fig. 7B), suggesting that gefitinib inhibits ATP-dependent MTX transport in an “uncompetitive” mechanism. On the other hand, when membrane vesicles were incubated with 0, 0.3, or 1 mM AMP-PNP in the same manner, the Lineweaver-Burk plots demonstrated competition kinetics between ATP and AMP-PNP (Fig. 7C). These results strongly suggest that the mechanism underlying the inhibition of ABCG2 by gefitinb is distinct from that of inhibition by AMP-PNP. Namely, gefitinib does not appear to compete with ATP at the ATP-binding site of ABCG2.
Discussion
High-Speed Screening of Human ABCG2 Function and Quality Control of Membrane Vesicles. In the present study, we have developed our original methods of high-speed screening and QSAR analysis to evaluate human ABCG2-drug interactions. For this purpose, it was important to maintain high integrity of the plasma membrane vesicles used in the transport assay. In other words, the membrane vesicles have to be completely sealed. To examine the quality of plasma membrane vesicles prepared from Sf9 cells, we used transmission electron microscopy and SEM technologies and identified the optimal conditions required to prepare the membrane vesicles. The timing of harvesting Sf9 cells after baculovirus infection appears to be very critical. As demonstrated in Fig. 1A, the membrane morphology of infected Sf9 cells changed greatly; in particular, numerous pores were observed on day 5. At that stage, the ABCG2 protein formed nonspecific complexes that were linked through disulfide bonds. Those complexes could be disassociated to monomers by mercaptoethanol treatment (Fig. 1C). Recently, we have found that the ABCG2 protein forms homodimers via a cysteinyl disulfide bond at Cys603 under physiological conditions (Wakabayashi et al., 2006). However, once the membrane integrity has been disrupted, such specific homodimer formation does not seem to operate correctly.
The original method for the vesicle transport assay was developed by Ishikawa to measure ATP-dependent transport of glutathione S-conjugates (Ishikawa, 1989). Recently, we improved the method to enhance the assay speed by introducing 96-well MultiScreen plates and an automated multidispenser system (Ishikawa et al., 2005), which made the assay speed 55 times faster than the original method. To detect the transport activity of ABCG2, we used MTX as a model substrate in the present study. The wild type of ABCG2 transports MTX, whereas acquired mutants, i.e., R482G and R482T, do not (Mitomo et al., 2003). Compared with E3S, MTX was preferable for the high-speed screening because of the high signal/noise ratio in our vesicle transport assay. In addition, MTX can be easily replaced by inhibitors/substrates at the binding site(s) of ABCG2, because of its low affinity toward ABCG2. This is a great advantage for performing the inhibition screening and QSAR analysis.
QSAR Analysis for ABCG2-Drug Interactions. To facilitate our understanding of drug absorption and distribution, Hansch developed a QSAR analysis method (Hansch, 1981). Initially, he studied the role of octanol/water partition coefficients (logP) in drug transport processes that were thought to contribute to drug absorption and distribution in our body. Since their pioneering work, logP has been recognized as the most predominant descriptor in many QSAR studies. However, as demonstrated in Fig. 6B, there was no clear correlation between the inhibition of ABCG2 and ClogP values.
Recently, we have developed a new QSAR analysis method to study the substrate specificity of ABCB1 (Ishikawa et al., 2004). We used chemical fragmentation codes to describe the chemical structures of a variety of substrates and nonsubstrates for ABCB1. Derwent Information Ltd. developed this structure-indexing language, which is suitable for describing chemical structures. The chemical fragmentation codes were originally created to answer the need for accessing the increasing numbers of chemical patents. Markush TOPFRAG is the software that generates the chemical fragment codes from chemical structure information.
In the present study, we have applied this new approach to the QSAR analysis of ABCG2-drug interactions. The uniqueness of our approach resides in the fact that the extent of ABCG2-mediated MTX transport inhibition is described as a linear combination of chemical fragmentation codes and that the coefficient for each chemical fragment code reflects the extent of the contribution of a specific chemical moiety to interactions with ABCG2 protein. It is also possible to further expand this QSAR analysis with a larger number of structurally diverse compounds, if needed.
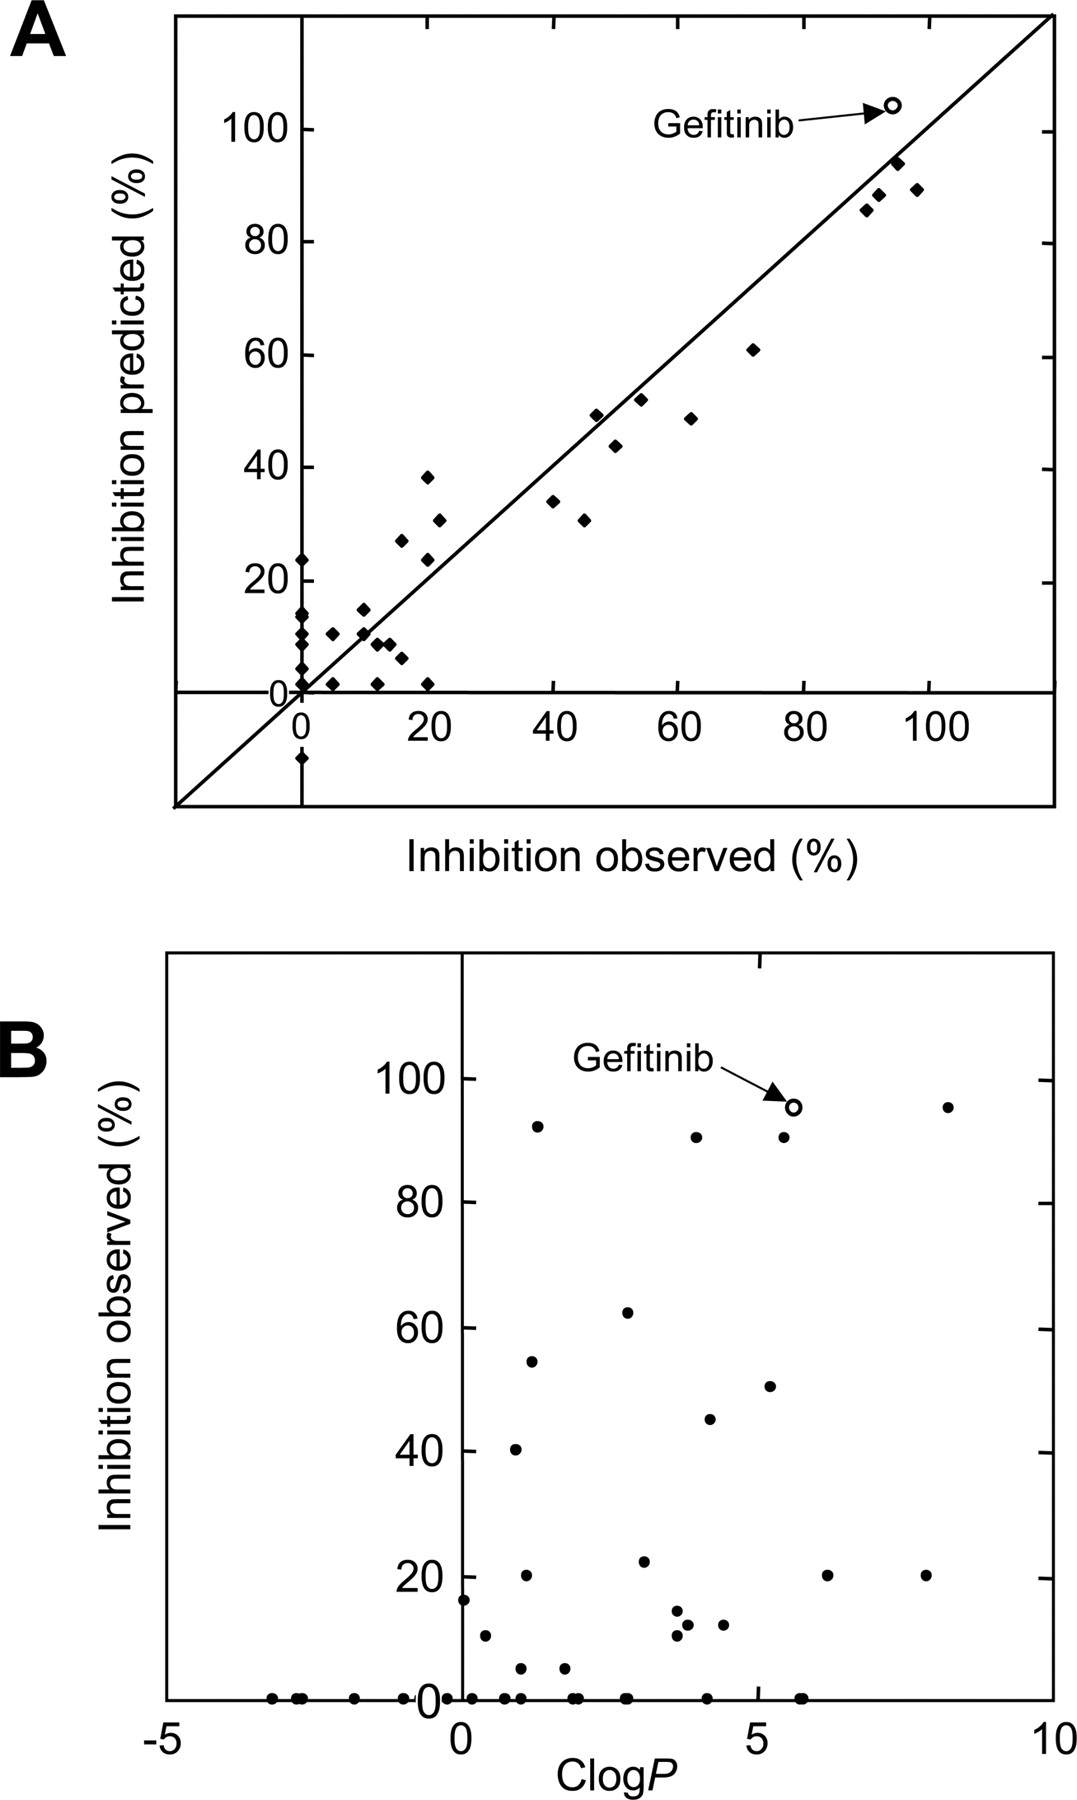
Relationships between observed and predicted values in the inhibition of MTX transport by different test compounds (A) and between the inhibition of MTX transport and ClogP values of the test compounds (B). Those observed values were the same as shown in Fig. 5, whereas the predicted values were deduced from the multiple linear regression analysis as described under Materials and Methods. The inhibition by gefitinib is indicated by ○. The ClogP values of the test compounds listed in Table 3 are plotted against the inhibition of MTX transport.
The present study demonstrates that the structural components represented by the chemical fragmentation codes of H121, D023, and M240 as well as by the descriptor of OH positively contributed to the inhibition, whereas those of M531, J2, H481, and RS4 had negative contributions. As summarized in Table 1, H121 had the largest positive coefficient, suggesting that one amine bonded to one carbon of a heterocyclic ring (Table 2) is an important component for the interaction with the ABCG2 protein. In addition, the data for D023 (Table 2) suggest that fused heterocyclic ring(s) and two substituents on a carbocyclic ring of the fused heterocyclic ring(s) are also important chemical moieties for the interaction with ABCG2. Interestingly, the chemical fragmentation codes of gefitinib involve both H121 and D023 as positive contributors (Table 4). Based on the QSAR analysis, we predicted that gefitinib would strongly interact with the ABCG2 protein (Table 5). In fact, our QSAR-based prediction was confirmed by actual experiments (Fig. 7A).
Inhibition of ABCG2-Mediated MTX Transport by Gefitinib. Gefitinib is an orally active epidermal growth factor receptor tyrosine kinase inhibitor. Protein kinases are potential drug targets for the treatment of a variety of diseases, including cancer (Noble et al., 2004). In particular, specific tyrosine kinase inhibitors are rapidly being developed as new drugs for the inhibition of malignant cell growth and metastasis formation. Most of these newly developed tyrosine kinase inhibitors are hydrophobic and thus rapidly penetrate the cell membrane to reach intracellular targets.
Özvegy-Laczka et al. (2004) have shown by in vitro assay systems that gefitinib, imatinib, and N-[4-[(3-bromophenyl)amino]-6-quinazolinyl]-2-butynamide (EKI-785) interact with ABCG2 at submicromolar concentrations, whereas other multidrug transporters, i.e., ABCB1 and ABCC1, showed much lower reactivity toward these drugs. At low concentrations, gefitinib, imatinib, and EKI-785 inhibited ABCG2-dependent active drug extrusion and significantly affected drug resistance patterns in cells expressing ABCG2 (Özvegy-Laczka et al., 2004). In ABCG2-overexpressing cancer cells in vitro, gefitinib potently reversed resistance to SN-38 (Yanase et al., 2004). In mice, gefitinib treatment dramatically increased the oral bioavailability of irinotecan after simultaneous oral administration, whereas oral gefitinib coadministration resulted in no changes in clearance of intravenously administered irinotecan. Thus, gefitinib may modulate SN-38 activity at the cellular level to reverse tumor resistance mediated by ABCG2 through inhibiting the oral drug efflux and may be used potentially in humans to modulate the oral bioavailability of poorly absorbed camptothecins such as irinotecan (Stewart et al., 2004). On the other hand, overexpression of ABCG2 prevents tumor cell death induced by gefitinib, suggesting that gefitinib is a substrate of human ABCG2 and thereby readily excreted from the cells (Elkind et al., 2005).

Inhibition of ABCG2-mediated MTX transport by gefitinib. A, ATP-dependent [3H]MTX transport was measured at 37°C for 20 min in the presence of gefitinib at different concentrations in the standard incubation medium (0.25 M sucrose and 10 mM Tris-Hepes, pH 7.4, 10 mM creatine phosphate, 100 μg/ml creatine kinase, and 10 mM MgCl2). MTX transport is expressed as relative values compared with the transport activity measured without gefitinib (100% MTX transport). Data are expressed as mean values ± S.E.M. (n = 4). B, membrane vesicles were incubated with 200 μM [3H]MTX in the presence of 0.1, 0.2, 0.5, 1, or 5 mM ATP in the standard incubation medium at 37°C for 20 min, in which gefitinib was added in the reaction mixture at a concentration of 0 (○), 0.3 (•), or 1 μM (▴). Data are expressed as mean values ± S.E.M. (n = 3). C, membrane vesicles were incubated with 200 μM [3H]MTX in the presence of 0.1, 0.2, 0.5, 1, or 5 mM ATP in the standard incubation medium at 37°C for 20 min, where AMP-PNP was added in the reaction mixture at a concentration of 0 (○), 0.3 (•), or 1 mM (▴). MTX transport was quantified by measuring the amount of MTX transported into membrane vesicles as described under Materials and Methods.
It was originally speculated that gefitinib would compete with the ATP-binding site on ABC transporters, because it was designed to interact with the conserved kinase domain (Brehmer et al., 2005). Therefore, a question was raised about whether gefitinib might inhibit ABCG2-mediated MTX transport by occupying the ATP-binding cassette of ABCG2. To answer this question, we carried out the experiments shown in Fig. 7, B and C. AMP-PNP, an ATP analog, competed with ATP, as clearly demonstrated in Fig. 7C. Contrary to our expectation, the results (Fig. 7B) revealed that gefitinib does not interfere with ATP. Instead, the uncompetitive inhibition kinetics strongly suggests that gefitinib is bound to an ABCG2-ATP complex (Scheme 1).

In this scheme, “E” and “I” mean ABCG2 and gefitinib, respectively. Similar uncompetitive inhibition kinetics were observed with SN-38, a substrate for ABCG2 (data not shown). Thus, gefitinib and SN-38 may share the substrate-binding site of ABCG2.
It is important to clearly distinguish “uncompetitive” and “noncompetitive” inhibition mechanisms. In the case of noncompetitive inhibition, an inhibitor molecule binds to both E and the E-ATP complex. Novobiocin, for example, was found to be a noncompetitive inhibitor (data not shown). In that case, Lineweaver-Burk plots exhibited a characteristic pattern, where all lines intersected on the x-axis (1/ATP), being different from Fig. 7, B and C.
Concluding Remarks. Our QSAR analysis data (descriptor OH in Table 1) suggest that polyphenols are potent inhibitors of ABCG2. Indeed, recent studies have shown that natural flavonoids, such as quercetin, genistein, naringenin, acacetin, and kaempferol, inhibit ABCG2 function and sensitize drug-resistant cancer cells in vitro (Cooray et al., 2004; Imai et al., 2004; Yoshikawa et al., 2004; Zhang et al., 2004; Ahmed-Belkacem et al., 2005; Sesink et al., 2005). Coadministration of flavonoids with ABCG2-substrate anticancer drugs can alter the pharmacokinetic profile and consequently increase the efficacy of drugs. In this context, our QSAR strategy is considered to be practical and useful for the molecular design of new ABCG2 modulators.
Acknowledgments
We thank Yakult Honsha Co., Ltd. (Tokyo, Japan) and Astra-Zeneca (Alderley Park, Cheshire, UK) for generously providing SN-38 and gefitinib, respectively.
Footnotes
-
This study was supported in part by the New Energy and Industrial Technology Development Organization International Joint Research Grant program “International Standardization of Functional Analysis Technology for Genetic Polymorphisms of Drug Transporters” and by a research grant (14370754) from the Japanese Society for the Promotion of Science.
-
doi:10.1124/jpet.105.099036.
-
ABBREVIATIONS: ABC, ATP-binding cassette; SN-38, 7-ethyl-10-hydroxycamptothecin; QSAR, quantitative structure-activity relationship; AMP-PNP, adenosine 5′-(β,γ-imido)triphosphate; MTX, methotrexate; SEM, scanning electron microscopy; E3S, estrone-3-sulfate; EKI-785, N-[4-[(3-bromophenyl)amino]-6-quinazolinyl]-2-butynamide.
- Received November 24, 2005.
- Accepted February 16, 2006.
- The American Society for Pharmacology and Experimental Therapeutics


