

Abstract
GABAA receptors are believed to be pentameric hetero-oligomers, which can be constructed from six subunits (α, β, γ, δ, ε, and ρ) with multiple members, generating a large potential for receptor heterogeneity. The mechanisms used by neurons to control the assembly of these receptors, however, remain unresolved. Using Semliki Forest virus expression we have analyzed the assembly of 9E10 epitope-tagged receptors comprising α1 and β2 subunits in baby hamster kidney cells and cultured superior cervical ganglia neurons. Homomeric subunits were retained within the endoplasmic reticulum, whereas heteromeric receptors were able to access the cell surface in both cell types. Sucrose density gradient fractionation demonstrated that the homomeric subunits were incapable of oligomerization, exhibiting 5 S sedimentation coefficients. Pulse–chase analysis revealed that homomers were degraded, with half-lives of ∼2 hr for both the α1(9E10) and β2(9E10) subunits. Oligomerization of the α1(9E10) and β2(9E10)subunits was evident, as demonstrated by the formation of a stable 9 S complex, but this process seemed inefficient. Interestingly the appearance of cell surface receptors was slow, lagging up to 6 hr after the formation of the 9 S receptor complex. Using metabolic labeling a ratio of α1(9E10):β2(9E10) of 1:1 was found in this 9 S fraction. Together the results suggest that GABAA receptor assembly occurs by similar mechanisms in both cell types, with retention in the endoplasmic reticulum featuring as a major control mechanism to prevent unassembled receptor subunits accessing the cell surface.
GABAA receptors are the major sites of fast inhibitory neurotransmission within the brain. These receptors are believed to be hetero-oligomers constructed from six classes of homologous subunits: α(1–6), β(1–4), γ(1–3), δ, ε, and ρ(1–3) (Macdonald and Olsen, 1994; Davies et al., 1997), generating a considerable potential for receptor heterogeneity. Even within single neurons, there is likely to be heterogeneity of structure, because many neurons often express multiple numbers of receptor subunits (Wisden and Seeburg, 1992; Fritschy and Mohler, 1995). Therefore, to determine the true extent of GABAAreceptor heterogeneity, it is important to understand the mechanisms that govern the assembly of these receptors. Selective oligomerization and/or selective transport of defined subunit combinations to the cell surface (Connolly et al., 1996a) may provide important mechanisms for controlling receptor diversity.
To address these questions, the assembly of recombinant receptors has been analyzed. These studies have focused on the minimal structural requirement for the production of GABAA receptors displaying the full physiological and pharmacological properties of neuronal receptors. Parallel electrophysiological, biochemical, and morphological studies have demonstrated that homomeric expression does not result in surface expression for the α1, β2 or γ2L subunits in Xenopus oocytes, human embryonic kidney (A293) cells, or Madin Darby canine kidney (MDCK) cells (Connolly et al., 1996a,b). In common with the combinations α1γ2L and β2γ2L these homomeric subunits are retained in the endoplasmic reticulum (ER) (Connolly et al., 1996a,b). Expression of receptors composed of α and β subunits produces GABA-gated chloride channels, but the co-expression of the γ2 or γ3 subunits is essential for modulation by benzodiazepines (Macdonald and Olsen 1994).
To explore receptor assembly further, we have developed Semliki Forest viruses (Liljestrom and Garoff, 1991) that express receptor subunits modified with the 9E10 epitope (Connolly et al., 1996a,b). This expression system allows high levels of protein production in a broad range of host cells, including neurons (Liljestrom and Garoff, 1991; deHoop et al., 1995). Here, we use this system to study the assembly of GABAA receptors composed of α1(9E10) and β2(9E10)subunits in both baby hamster kidney (BHK) cells and cultured superior cervical ganglia (SCG) neurons.
MATERIALS AND METHODS
Construction and production of Semliki Forest viruses expressing the α1(9E10) and β2(9E10) GABAA receptor subunits.The murine α1(9E10) and β2(9E10) subunits modified with the 9E10 epitope EDKLISEEDL, between amino acids 4 and 5 of the mature protein, have been described previously (Connolly et al., 1996a,b). Addition of this epitope has been demonstrated to be functionally silent with regard to both receptor pharmacology and physiology (Connolly et al., 1996a,b). These cDNAs were cloned as BamHI fragments into the vector pSFV1 (Liljestrom and Garoff, 1991) using standard recombinant methods. The respective plasmids were linearized with Nru1, and cRNA was synthesized using SP6 polymerase. cRNA was synthesized fromSpeI linearized Helper I plasmid (Liljestrom and Garoff, 1991) also using SP6 polymerase. All manipulations were performed using standard recombinant methods (Sambrook et al., 1989). To produce viral stocks encoding the α1 and β2 subunits, cRNA transcribed from receptor constructs and the helper plasmid were electroporated into BHK cells at a 1:1 ratio. The supernatants from the cells were collected after 2 d and frozen in 100 μl aliquots. Titers for GABAA receptor subunit-expressing viruses were determined by serial dilution on BHK cells. Expression was determined by immunofluorescence as described below. The α1(9E10) and β2(9E10) viruses had titers of 7 × 10⁷–1 × 10⁸ particles/ml.
Cell culture. BHK cells were maintained in BHK 21 medium (Life Technologies) supplemented with 5% FCS, 20 mm HEPES, pH 7.2, tryptose phosphate broth, penicillin, and streptomycin. Cultured SCG neurons were prepared and maintained as described previously (Krishek et al., 1994).
Infection of BHK cells and cultured SCG neurons. Infection of BHK cells or neurons was conducted by diluting virus into binding medium (RPMI 1640 medium, pH 6.8, 20 mm HEPES, pH 6.8, and 20 mm BSA), and incubating the cells in this solution for 1 hr at 37°C. Normal culture medium was then reapplied after this incubation. The α1(9E10) and β2(9E10) virus particles were used at concentrations of ∼10 infectious units per cell.
Immunocytochemistry. Immunofluorescence was performed as described by Connolly et al., (1996a,b). BHK cells and neurons were fixed in 3% parafomaldehyde in PBS for 5 min and then quenched twice with 50 mm glycine for 10 min. Cells were then blocked using 1% BSA and 10% horse serum in PBS. The primary antibodies were applied for 1 hr at the following concentrations: BD17 (anti-β2/β3; Boehringer), 14 μg/ml; 9E10, 5 μg/ml; or a polyclonal antibody raised against a synthetic peptide corresponding to the C terminus of the α1 subunit (amino acids 413–429) (Pollard et al., 1993) at 5 μg/ml. Secondary antibodies (Pierce, Rockford, IL), either fluorescein- or rhodamine-linked anti-mouse and anti-rabbit IgG, were then applied as appropriate for 45 min in blocking solution. Permeabilization of samples was conducted by adding NP-40 to the blocking solution (0.05%). Fluorescence images were analyzed by confocal microscopy (Medical Research Council 1000). Images from SCG neurons were generated by taking an optical Z section through the cell at 1 μm intervals and then recombining the images.
Quantification of fluorescence by confocal microscopy. The level of surface membrane 9E10 staining on infected cells was quantified using confocal microscopy as described by Bogler et al. (1993) and Entwistle and Noble (1994). BHK cells were fixed at differing time points after infection. Surface receptor populations were then detected simultaneously via fluorescence using 9E10 antibodies without permeabilization. Individual cells at each time point were selected at random, and the area command was used to collect brightness readings of the plasma membrane, using identical iris and gain settings. The average fluorescence intensities were converted to numerical readings of arbitrary values (pixels). This was performed on at least five cells for each time point.
Sucrose density gradient fractionation. Receptor subunits were subjected to sucrose density gradient fractionation using 5 and 20% linear sucrose density gradients in lysis buffer (Millar et al., 1995). Before loading, solubilized cell extracts were clarified by centrifugation (100,000 × g for 10 min). Gradients were calibrated via the inclusion of marker proteins (1 mg/ml) of known sedimentation coefficients: BSA, 4.3 S; aldolase, 7.4 S; and catalase, 11.2 S. Gradients were run in a Beckman SW 55ti rotor at 40,000 rpm for 14.4 hr at 4°C. The gradients were then fractionated (14 350 μl fractions), and receptor localization was analyzed by immunoprecipitation or Western blotting.
Metabolic labeling and immunoprecipitation of GABAAreceptor subunits. For metabolic labeling studies infected BHK cells were starved in methionine-free media for 30 min before labeling with [35S]methionine (ICN/Flow) at 200 μCi/ml for differing periods. Where appropriate, labeled cultures were chased at 37°C with complete growth media. Total protein synthesis was analyzed by SDS-PAGE, after cell lysis in SDS sample buffer. Receptor subunits were isolated from cell extracts or sucrose density gradient fractions via immunoprecipitation as described previously (Moss et al., 1995; Connolly et al., 1996b). Cells were lysed in a buffer containing 2% NP-40, 5 mm EDTA, 5 mm EGTA, 50 mm sodium fluoride, 50 mm sodium chloride, 1 mm sodium orthovanadate, 5 mm sodium pyrophosphate, 0.1 mm phenylmethylsulfonyl fluoride, 10 μg/ml leupeptin, 10 μg/ml antipain, 10 μg/ml pepstatin, and 0.1 mg/ml aprotinin. Receptor subunits were isolated with 9E10 antibody coupled to protein G–Sepharose, followed by SDS-PAGE. In some experiments 2% 3-[(3-cholamidopropyl)dimethylammonio]-1-propanesulfonic acid (CHAPS) was used in place of NP-40. For surface immunoprecipitations, expressing cells were chilled to 4°C and incubated in PBS containing 10 μg/ml BSA for 30 min. 9E10 antisera was then applied to the cells (10 μg/ml) in the same buffer for 20 min, followed by 9E10 peptide at 1 μg/ml for 10 min. Surface receptor populations were then isolated using protein G-Sepharose after cell lysis as described above, except that all solutions contained 9E10 peptide at 1 μg/ml.
Western blotting. Receptor subunits were detected in gradient fractions using either 9E10 antibody or a rabbit polyclonal antibody against a peptide corresponding to amino acids of 326–343 of murine α1 subunit (Macdonald and Olsen, 1994). Antibody production in rabbits and Western blotting were performed as described by Krishek et al. (1994) and Connolly et al. (1996a), respectively.
Electrophysiology. Whole-cell recordings from infected BHK cells were conducted at 18 hr after infection as described previously (Krishek et al., 1994).
RESULTS
Production and characterization of Semliki Forest viruses expressing GABAA receptor subunits
Co-electroporation of BHK cells with cRNA produced form either plasmid pSFV1α1(9E10) or PSFV1β2(9E10) with cRNA synthesized from the Helper I plasmid produced high titers of infectious Semliki Forest virus particles (Liljestrom and Garoff, 1991). Typical titers in excess of 7 × 10⁷/ml were obtained on electroporation of 106 cells as determined by limiting dilution. To characterize the virally expressed receptor subunits, infected cells were pulse-labeled with [35S]methionine. Subunit expression was then monitored with time by examining total protein synthesis or via immunoprecipitation using 9E10 antibody. Infection of BHK cells with α1(9E10) virus lead to the time-dependent synthesis of a protein with an apparent molecular mass of 52 kDa and a minor band at 50 kDa together with a significant inhibition of host protein synthesis (Fig.1A). In addition to these, weaker bands of 65 and 40 kda were also evident. These bands represent the replicase and capsid protein of the Semliki Forest virus (Liljestrom and Garoff, 1991). Likewise, infection with the β2(9E10) virus resulted in the synthesis of a 56 kDa protein (Fig. 1B). Semliki Forest virus infection of many cell types has previously been shown to inhibit protein synthesis, via competition of the Semliki Forest virus-encoded RNAs with host cell mRNAs for translation (Liljestrom and Garoff, 1991). To confirm that these proteins represent receptor subunits, immunoprecipitation with 9E10 antibody was performed on labeled cells treated with or without tunicamycin to block N-glycosylation. From cells infected with the α1(9E10) virus a protein of 52 kDa was immunoprecipitated with a minor band of 50 kDa; tunicamycin treatment resulted in the precipitation of a single band of 48 kDa (Fig. 1C). In contrast 9E10 antibody precipitated a band of 56 kDa from cells infected with the β2(9E10) virus; treatment with tunicamycin reduced the mass of this band to 50 kDa (Fig. 1D). The values obtained for the molecular masses of the glycosylated and unglycosylated forms of the α1(9E10) and β2(9E10) viruses produced in BHK cells are thus in agreement with those observed on expression in A293 cells (Buller et al., 1994; Connolly et al., 1996a).

Biochemical characterization of the GABAA receptor α1(9E10) and β2(9E10) subunits produced on Semliki Forest virus infection of BHK cells. BHK cells were infected with either the α1(9E10) (A) or β2(9E10) (B) subunit virus. At defined periods (between 0.5 and 24 hr as indicated) after infection the cells were labeled for 30 min with 500 μCi/ml [35S]methionine. Infected cells were then lysed, and labeled proteins were resolved by SDS-PAGE followed by fluorography. The subunits were also immunoprecipitated from infected cells labeled with [35S]methionine and treated with (+) or without (−) tunicamycin (5 μg/ml), as shown in C and D for the α1(9E10) and β2(9E10)subunits, respectively. The migration of protein standards (Bio-Rad) is indicated.
Expression of homomeric and heteromeric GABAA receptors in BHK cells using Semliki Forest virus
Expression of receptor subunits in BHK cells was analyzed by immunofluorescence. Using subunit-specific antibodies, we failed to detect expression of the α1, α6, β1–3, or γ2 subunits in uninfected BHK cells. Infection of cells with single α1(9E10) or β2(9E10) viruses resulted in abundant intracellular staining using 9E10 antibody (Fig.2A,B) on permeabilization but no staining in nonpermeabilized cells (Fig.2C). The staining pattern is consistent with ER retention of these subunits on homomeric expression, as demonstrated previously in A293 and MDCK cells (Connolly et al., 1996a,b). In contrast, co-infection with α1(9E10) and β2(9E10) viruses (1:1 ratio) resulted in high levels of surface 9E10 staining (Fig. 2D) in ∼80% of all cells. The presence of both the α1(9E10)and β2(9E10) subunits on the cell surface was also demonstrated using subunit-specific antibodies (Fig.2E,F). To attempt to quantify the level of receptor production, whole-cell binding was performed using tritiated muscimol. High-affinity binding was evident only in co-infected cells, with a Bmax of 26 pmol/mg protein andKd values of 4 and 90 nm (results not shown). Similar Kd values for muscimol binding have been reported for the expression of these subunits previously (Pritchett et al., 1988; Moss et al., 1991; Hadingham et al., 1992).

Surface expression of GABAAreceptor subunits in BHK cells. BHK cells were infected with either single α1(9E10) or β2(9E10)virus or co-infected with both, and expression was then determined by immunofluorescence with (+) and without (−) permeabilization 20 hr after infection. Images were then collected by confocal microscopy.A, α1(9E10), 9E10 antibody (+);B, β2(9E10), 9E10 antibody (+); C, α1(9E10), 9E10 antibody (−); D, α1(9E10)and β2(9E10), 9E10 antibody (−). Images were collected from cells infected with both subunit viruses and co-stained using a rabbit polyclonal antibody against the α1 subunit and a monoclonal antibody (BD17) against the β2 subunit coupled to fluorescein and rhodamine secondary antibodies, respectively. The images collected for the two channels are shown in E andF for the α1(9E10) and β2(9E10) subunits, respectively.
Whole-cell recordings from BHK cells co-infected with α1(9E10) and β2(9E10) viruses exhibited robust GABA-activated membrane currents (Fig.3). The maximum current density evoked by GABA (100 μm) was 3.5 ± 0.5 nA, significantly higher than expected from conventional calcium phosphate or electroporation studies using these subunits (Connolly et al., 1996a). The membrane currents were sensitive to inhibition by 10 μm Zn+2 and were not enhanced by 1 μm flurazepam, and the GABA EC50 was 1.5 ± 0.12 μm (n = 8 cells), in agreement with earlier studies (Macdonald and Olsen 1994). In contrast, infection of BHK cells with either single α1(9E10) or β2(9E10) viruses resulted in complete insensitivity to GABA (1 mm) and also pentobarbital (2 mm; n = 5). The latter was used because β1 and β3 homomeric ion channels are sensitive to pentobarbital in preference to GABA (Sigel et al., 1989; Connolly et al., 1996b; Krishek et al., 1996). These results suggests that only the α1(9E10)β2(9E10) binary combination forms functional ion channels as shown previously (Connolly et al., 1996a).

Electrophysiological properties of GABAA receptors produced in BHK cells. A, Whole-cell recordings form BHK cells infected with Semliki Forest viruses expressing α1(9E10)β2(9E10). Homomeric α1(9E10) and β2(9E10)subunits were insensitive to GABA, and β2(9E10)subunits were also insensitive to pentobarbital (PB). The duration of the ligand application is indicated by solid lines. Holding potential, −50mV. B, GABA (•, □, and ▪) and pentobarbital (▵) equilibrium concentration responses for BHK cells expressing α1(9E10)β2(9E10) or single subunits. data were fitted byI/Imax = [1/(1 + {[A]/EC50}n)], whereI and Imax represent GABA-activated and maximally activated current, n is the Hill coefficient, and A is the GABA concentration. EC50 = 1.47 ± 0.12 μm;n = 1.0 ± 0.08. Data points indicate mean ± SEM.
Sucrose density fractionation of GABAAreceptor subunits
Receptor subunits expressed in BHK cells were fractionated on sucrose density gradients. Receptors were solubilized in a range of differing detergents. Up to 50% of the receptor subunits could be solubilized in 2% NP-40, whereas <20% could be solubilized in 2% CHAPS (data not shown). Therefore, the majority of experiments were performed using solubilization in NP-40. Gradient fractions were then subjected to SDS-PAGE followed by Western blotting with 9E10 antibody. On homomeric expression a major band of 52 kDa corresponding to the α1(9E10) subunit could be detected, which sedimented at 5 S (Fig.4A). In some experiments additional bands of 50 and 48 kDa could also be seen. These bands presumably represent incompletely glycosylated forms of the α1 subunit (Fig. 1C). The sedimentation of the α1(9E10) subunit was also analyzed in cells co-infected with the β2(9E10) virus using an α1-specific antibody that recognizes an epitope in the major intracellular domain of this subunit. Co-expression with the β2(9E10) subunit resulted in a shift in the sedimentation of the α1(9E10) subunit to 9 S (Fig.4B). This shift is consistent with oligomerization of the α1(9E10) and β2(9E10)subunits. An identical shift in sedimentation of the α1(9E10) subunit was seen using CHAPS in place of NP-40. A parallel shift in sedimentation coefficient of the β1(9E10) subunit from 5 to 9 S was also seen on co-expression with the α1(9E10) using Western blotting with anti-β2 subunit antibodies (data not shown). Similar sedimentation coefficients have been previously demonstrated for purified GABAA receptors and recombinant receptors composed of both α/β and αβγ subunits (Mamalaki et al., 1987, 1989;Hadingham et al., 1992) and for assembled pentameric muscle nicotinic acetylcholine receptor (AChR) expressed in fibroblasts (Green and Millar 1995). Our failure to detect homo-oligomerization of either the α1(9E10) or β2(9E10) subunit may be attributable to the detergent used. Interestingly, substitution of NP-40 for CHAPS did not result in the detection of slower-sedimenting forms of either homomeric subunit. Furthermore, the use of Lubrol for extraction does not lead to the detection of homo-oligomers for the α1 subunit expressed in human embryonic kidney 293 (HEK) cells (Tretter et al., 1997).

Differential sedimentation of the α1(9E10) subunit dependent on coexpression with the β2(9E10) subunit. Cells infected with the α1(9E10) (A) or co-infected with both the α1(9E10) and β2(9E10)(B) subunit viruses were lysed and subjected to sucrose density gradient fractionation 16 hr after infection. Gradient fractions were separated by SDS-PAGE, and the α1(9E10) subunit was detected via Western blotting using 9E10 antibody (A) or a rabbit polyclonal antibody against the α1 subunit (B). Sedimentation coefficients for the α1(9E10)subunit were determined with reference to proteins with known sedimentation: BSA (4.3 S), aldolase (7.4 S), and catalase (11.2 S).
To analyze the production and stability of this 9 S complex, co-infected cells were labeled with [35S]methionine for 1 hr and chased for defined periods with excess cold methionine. Cell lysates were then prepared and subjected to sucrose density gradient fractionation. Receptor subunits were precipitated from gradient fractions using 9E10 antibody (Fig. 5), and the levels of incorporated methionine were quantified on a Bio-Rad phosphorimager (Fig.6). Bands corresponding to 52 and 56 kDa could be detected for the α1(9E10) and β2(9E10) subunits, respectively, in gradient fractions (Fig. 5A–C). Immediately after a 1 hr labeling period, the majority of synthesized subunits sedimented at 5 S. However a shoulder migrating at 9 S was also visible (Figs. 5A, 6A), which was not seen with either subunit expressed alone, using identical conditions (data not shown). In contrast, at 6 hr the majority of the labeled receptor subunits migrated at 9 S (Figs.5B, 6B). There was also a drastic reduction in the total number of receptor subunits at this 6 hr time point, with only ∼36% of the total counts present after labeling remaining (Fig.6B). At 20 hr, most of the 9 S peak was still evident, with ∼31% of the starting counts remaining (Fig.5C,F). The 9 S pool presumably forms quickly, because it could be detected at zero time (after a 1 hr labeling period) but was difficult to resolve from unassembled subunits at this time point (Fig. 6A–C). Also, the 9 S fraction seemed relatively stable, as demonstrated by only a small loss (∼10%) of this peak between 6 and 20 hr (Fig. 6B,C) suggesting a half-life of ∼40 hr for receptors composed of α1(9E10) and β2(9E10)subunits. Collectively the results suggest that oligomerization of receptor subunits occurs quickly but is relatively inefficient, and that unassembled subunits are degraded. Pulse–chase and immunoprecipitation were used to analyze the half-lives of the α1(9E10) and β2(9E10)subunits on homomeric expression, as shown in Figure7. At all time points a single band of 52 kDa was seen for the α1(9E10) subunit, whereas in contrast two bands of 56 and 50 kDa were evident for the β2(9E10) subunit. The lower band for the β2(9E10) subunit presumably represents unglycosylated material. These results were quantified using a phosphorimager. In the case of the β2(9E10)subunit the signals form both bands were pooled. Half-lives of ∼2 hr were determined for both the α1(9E10) and β2(9E10) subunits. Similar values were seen in three separate experiments. These half-lives for homomeric receptor subunits are consistent with the dramatic loss of signal seen during the first 6 hr of the pulse–chase experiments shown in Figures 5 and6.

Pulse–chase analysis of GABAAreceptor assembly. Cells co-infected with both subunit viruses were labeled with 100 μCi/ml [35S]methionine 2 hr after infection for 1 hr and chased for 0 (A), 6 (B), or 20 (C) hr excess cold methionine. The cells were then lysed and subjected to sucrose density gradient fractionation. Gradient fractions were then immunoprecipitated with 9E10 antibody, and the α1(9E10) and β2(9E10)subunits were resolved by SDS-PAGE. Sedimentation coefficients for the α1(9E10) and β2(9E10)subunits were determined as described in Figure 4.

Quantification of receptor assembly. The levels of incorporated methionine in α1(9E10)(○) and β2(9E10) (•) subunits were quantified in gradient fractions for cells chased for 0 (A), 6 (B), and 20 (C) hr using a Bio-Rad phosphorimager. Background was subtracted using the same volume that was used to integrate the subunit signals.

Degradation of single GABAA receptor subunits expressed in BHK cells. BHK cells were infected with Semliki Forest viruses producing either the α1(9E10)(A) or β2(9E10)(B) subunit. Two hours after infection the cells were labeled with [35S]methionine (400 μCi/ml) for 20 min and then chased for differing periods. The cells were then lysed, and receptor subunits were isolated by immunoprecipitation with 9E10 antibody. Precipitated material was then subjected to SDS-PAGE, and the subunit levels were quantified using a Bio-Rad phosphorimager.
The time dependence of receptor surface expression
To examine the time dependence of surface expression, BHK cells were co-infected with α1(9E10) and β2(9E10) viruses. Infected cells were then fixed after differing periods, and the level of surface receptor expression was determined by fluorescence. Surface receptor levels were then quantified by confocal microscopy, as shown in Figure8. Surface expression could be first detected 8 hr after infection, which increased rapidly up to 10 hr and leveled off after this period (Fig. 7). Interestingly these results suggest a significant latency between subunit oligomerization, which was evident within 1 hr (Fig. 5), and the appearance of cell surface receptors, which could be detected 8 hr after infection, as determined by fluorescence measurements.

Time dependence of surface expression of receptors composed of α1(9E10) and β2(9E10) subunits. Co-infected cells were fixed at differing periods after infection and processed simultaneously for fluorescence with 9E10 antibody without permeabilization. Images were collected from cells, and the average intensity of staining is shown. Data were collected from at least five cells at each time point.
Subunit ratio of GABAA receptors composed of α1(9E10) and β2(9E10)subunits
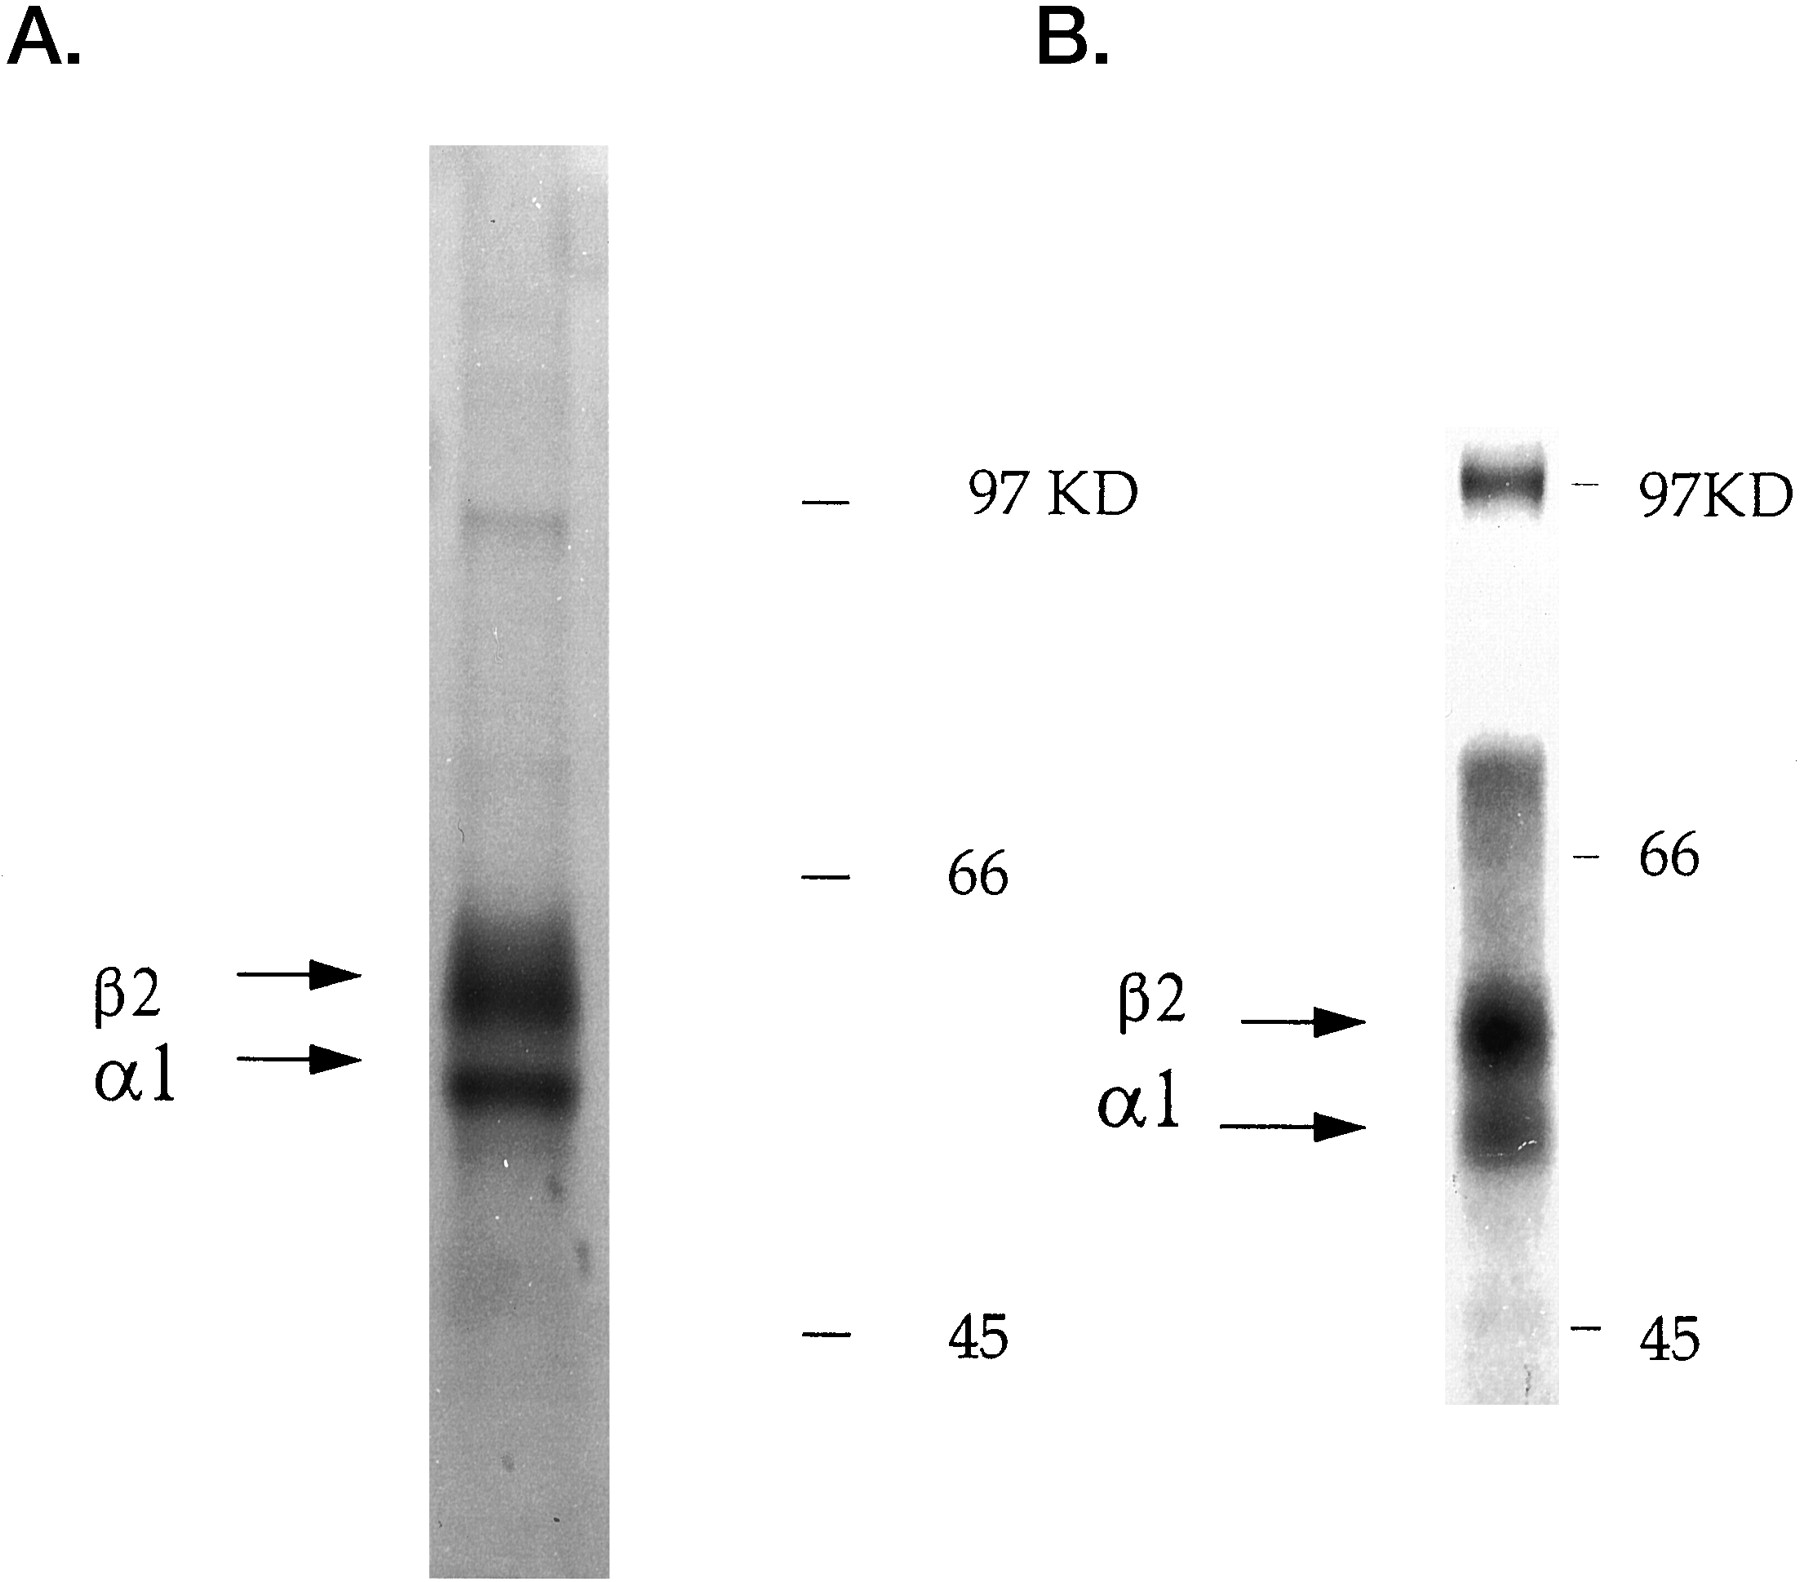
The ratio of α1(9E10) and β2(9E10) subunits present in the 9 S receptor pool was analyzed from expressing cells after labeling with [35S]methionine for 1 hr followed by a 12 hr chase. This will ensure degradation of all unassembled subunits produced during the preceding 1 hr labeling period. Fractions containing the 9 S receptor isolated by sucrose density gradient fractionation were pooled and immunoprecipitated with 9E10 antibody followed by SDS-PAGE. Incorporated counts were then quantified using a Bio-Rad phosphorimager. Signals from the α1(9E10)and β2(9E10) subunits were then normalized for relative methionine content. A typical result is shown in Figure9A, where an α1(9E10):β2(9E10) subunit ratio of 0.9 was determined. Ratios of 1.2, 1.1, 0.8, and 0.8 were obtained in four separate experiments. To investigate this observation further, the subunit ratio of cell surface receptors was analyzed. Cells expressing both the α1(9E10) and β2(9E10) subunits were labeled with [35S]methionine and exposed to 9E10 antibody at 4°C. The surface receptor population was then isolated using protein G–Sepharose resolved by SDS-PAGE, and subunit levels were then quantified. A ratio of 1.1 was found for the α1(9E10):β2(9E10) subunits in the experiment shown in Figure 9B. Similar ratios were found in two other experiments. Together, these data are consistent with a 1:1 ratio of α1(9E10):β2(9E10)subunits, suggesting that receptors are composed of equal numbers of subunits, e.g., a tetrameric or hexameric but, interestingly, not pentameric tertiary structure.

Subunit ratio of GABAA receptors composed of α1(9E10) and β2(9E10) subunits. A, BHK cells expressing both receptor subunits were pulse-labeled with [35S]methionine (200 μCi/ml) for 2 hr; 3 hr after infection, the cells were then chased for 12 hr with excess cold methionine. Cell lysates were then subjected to sucrose density gradient fractionation, and the fractions corresponding to the 9 S peak were pooled and immunoprecipitated with 9E10 antibody. Receptor subunits were then resolved by SDS-PAGE and quantified using a Bio-Rad phosphorimager. After correction for methionine content (α1 = 9; β2 = 15) a ratio of 0.9 was found for the α1(9E10):β2(9E10) subunits in the experiment shown. B, Labeled cells were exposed to 9E10 antibody at 4°C for 30 min. The cell surface receptor population was then isolated via immunoprecipitation with protein G in the presence of excess 9E10 peptide and resolved by SDS-PAGE, and subunit levels were quantified. A ratio of 1.1 was found for the α1(9E10):β2(9E10) subunits in the experiment shown.
Surface expression of homomeric and heteromeric GABAAreceptors in cultured neurons using Semliki Forest virus
To determine whether GABAA receptor assembly in BHK cells is a faithful indicator of neuronal events, cultured SCG neurons were infected with Semliki Forest viruses expressing 9E10-tagged receptor subunits. Infection of neurons with either single α1(9E10) or β2(9E10) virus did not result in the detection of fluorescence in nonpermeabilized cells (Fig. 10A). Abundant intracellular staining could be seen for both subunits (Fig.10C). This perinuclear and tubular staining (Fig.9A,B) is consistent with localization of these subunits to the ER in neurons (Krijnse-Locker et al., 1995). In contrast, co-infection of SCG neurons with both viruses led to the detection of robust staining in the absence of detergent (Fig.10D). Staining of 9E10 was evident in neuronal cell bodies, as well as in the neuronal processes. Interestingly “hot spots” (indicated in Fig. 10D by thearrow) of fluorescence were often detected in the neuronal processes. This presumably represent clustering of the virally encoded receptors.

Infection of cultured SCG neurons with Semliki Forest viruses expressing GABAA receptor subunits. Cultured SCG neurons were infected after 3 d in culture, and receptor expression was determined by immunofluorescence using 9E10 antibody 12 hr after infection with (+) or without (−) permeabilization. Images were then collected using confocal microscopy from cells infected with A, α1(9E10) (+); B, β2(9E10) (+); C, α1(9E10) (−); and D, α1(9E10) and β2(9E10) (−).
DISCUSSION
Molecular cloning has revealed a large multiplicity of GABAA receptor subunits, with some neurons, such in the hippocampal dentate gyrus expressing up to 12 differing subunits. Clearly to establish the extent of GABAA receptor heterogeneity it is important to understand the mechanisms that control receptor assembly.
We have engineered Semliki Forest viruses (Liljestrom and Garoff, 1991) to express epitope-tagged GABAA receptor subunits (Connolly et al., 1996a,b). Using this system, we have compared the assembly of GABAA receptors composed of α1(9E10)and β2(9E10) subunits in BHK cells and cultured SCG neurons. In BHK cells, homomeric expression resulted in the synthesis of large amounts of protein for each of these respective subunits. However, the subunits were unable to access the cell surface. In common with studies in A293 and MDCK cells these subunits were ER-retained in BHK cells (Connolly et al., 1996b). Given the high levels of protein produced on viral expression, our results highlight the efficiency and capacity of the ER retention system in controlling GABAA receptor expression. Homomeric expression of receptor subunits has proven controversial. In the case of the β1 and β3 subunits functional Cl− channels have been reported on expression in a range of heterologous systems (Sigel et al., 1989;Connolly et al., 1996b; Krishek et al., 1996). In contrast, homomeric expression of the α1 or β2 subunits produces functional expression in some cases (Blair et al., 1988) but not others (Sigel et al., 1990;Connolly et al., 1996b). The reasons for these discrepancies remain unclear; differences in the species of cDNAs used may be of significance. Another explanation is that some expression systems may produce trace levels of GABAA receptor subunits, which may complicate the interpretation of homomeric expression (Ueno et al., 1996).
In contrast, co-infection of BHK cells with both α1(9E10) and β2(9E10) viruses leads to robust surface expression. Sucrose density gradient fractionation was used to analyze the ability and efficiency of receptor subunits to oligomerization. α1(9E10) or β2(9E10) subunits expressed as homomers exhibited sedimentation coefficients of 5 S. In contrast, the sedimentation coefficients of both the α1(9E10) and β2(9E10) subunits increased to 9 S on co-expression. This shift in sedimentation is indicative of subunit oligomerization. The inability of α1(9E10) and β2(9E10) to homo-oligomerize presumably results in ER retention and subsequent degradation, with similar half-lives of 120 min. ER retention of these subunits is presumably mediated via interaction with the chaperone proteins heavy-chain binding protein and calnexin, respectively (Ou et al., 1993; Hammond et al., 1994; Pelham, 1995). Both of these proteins have been previously shown to interact with the α1(9E10) and β2(9E10) subunits, respectively (Connolly et al., 1996a). To study the efficiency of receptor oligomerization the appearance of the 9 S complex containing both subunits was analyzed. Thirty-six percent of available α1(9E10) and β2(9E10) subunits attained this 9 S sedimentation coefficient; the remainder of the subunits were degraded. The majority of the unassembled subunits were degraded within 6 hr, consistent with the short half-lives of either the α1(9E10) or β2(9E10) subunit found on homomeric expression. In contrast, assembled receptors seemed relatively stable, with only ∼10% of this population being degraded over a 14 hr period. Semliki Forest virus infection results in suppression of host synthesis, and therefore our result may overestimate subunit half-lives. However, receptors composed of α1 and β2 have half-lives of in excess of 45 hr in transfected HEK A293 cells (S. J. Moss and T. G. Smart, unpublished observations), consistent with our findings using Semliki Forest virus expression. The appearance of α1(9E10) and β2(9E10)receptors at the cell surface was slow, lagging considerably after the appearance of 9 S receptor complexes. The slow transport of these receptors to the cell surface may be attributable to the absence of γ2 subunits, or alternatively this may reflect a difference in cellular environment.
There seem to be parallels between the assembly of GABAAreceptors and the muscle AChR subunits stably expressed in fibroblasts. These studies have demonstrated that single AChR α, β, γ, or δ subunits are incapable of oligomerization and are unable to access the cell surface (Claudio et al., 1989; Paulson et al., 1991). Stable cell surface receptors are only produced on co-expression of all four subunits (Claudio et al., 1989; Paulson et al., 1991; Green and Millar, 1995). Again, in common with GABAA receptor assembly there is a significant lag time (up to 4 hr) between the appearance of AChR receptors at the cell surface and subunit oligomerization. Likewise, the assembly of the AChR seems to be an inefficient process, with only 20–30% of translated subunits being assembled into surface receptors (Ross et al., 1991; Green and Millar 1995).
GABAA receptors composed of αβ subunits differ from receptors composed of αβ and γ2 subunits with regard to Zn2+ and benzodiazepine sensitivity, in addition to single-channel conductance (Draguhn et al., 1990; Verdoorn et al., 1990; Moss et al., 1991; Smart et al., 1991; Angelotti et al., 1993). The existence of receptors composed of αβ subunits in neurons has not been established. However, the high Zn2+sensitivity (Draguhn et al., 1990; Smart et al., 1991) of these receptors coupled with low single-channel conductance (Moss et al., 1991; Angelotti et al., 1993) is reminiscent of some populations of neuronal GABAA receptors (Smart, 1992; Kaneda et al., 1995). The tertiary structure of these differing receptor isoforms has been examined. Mutagenic and biochemical approaches have suggested that receptors composed of αβ2γ2 or αβ3γ2 subunits are pentameric (Backus et al., 1993; Chang et al., 1996; Tretter et al., 1997). The structure of α/β receptors is more controversial. Receptors composed of α1β3 receptors expressed inXenopus oocytes have been reported to be tetrameric (Kellenberger et al., 1996) whereas the same receptor population expressed in A293 cells has been reported to be pentameric (Tretter et al., 1997). These studies may be complicated by the presence of receptors composed of homomeric β3 subunits (Connolly et al., 1996b) in addition to receptors containing both the α1 and β3 subunits. Studying receptors composed of α1β2 subunits may give more consistent results, because neither of these subunits can access the cell surface on homomeric expression because of ER retention (Connolly et al., 1996a,b). An alternate explanation for the observations on α/β receptors is that two populations of receptors exist, which are pentameric but differ in their subunit ratios, e.g., 2α3β and 3α2β. Given the unitary dose–response curves for α/β receptors, the single IC50 value for Zn2+ inhibition, and unitary single-channel properties, this seems unlikely (Macdonald and Olsen, 1994).
A tetrameric rather than pentameric structure of receptors composed of αβ subunits compared with αβγ may possibly explain the lower single-channel conductance of 15–16 and 28–32 pS, respectively. (Moss et al., 1991; Angelotti and Macdonald, 1993). Analysis of the channel permeability of these two receptor types may help resolve this intriguing possibility. It will be of interest to study the assembly of GABAA receptors composed of αβ and γ subunits using Semliki Forest virus. Routine triple infection of cells with viruses encoding α1, β2, and γ2 subunits has proven difficult.
We exploited the broad host range of the Semliki Forest virus (Liljestrom and Garoff, 1991) to examine whether the assembly of GABAA receptors seen in heterologous systems is a faithful model of neuronal events. The use of receptor cDNAs modified with reporter epitopes (Connolly et al., 1996b), allowed the discrimination between recombinant and neuronal receptor pools to be made. Infection of SCG neurons with either single α1(9E10) or β2(9E10) subunit viruses did not result in surface expression, because these subunits were ER-retained. Co-infection resulted in robust surface expression. SCG neurons express benzodiazepine-sensitive GABAA receptors, suggesting the presence of α, β, and γ receptor subunits of unknown identity. Presumably, the failure of single subunits to reach the cell surface on viral infection is attributable to low levels of endogenous subunits available for oligomerization. Suppression of host protein synthesis on Semliki infection will exaggerate this problem (Liljestrom and Garrof, 1991). An alternative explanation is that the virally expressed subunits are unable to assemble with the endogenous receptor subunits. Taken together the ER retention of single subunits and robust surface expression seen of the α1(9E10)β2(9E10) combination in both cell types suggest that receptor assembly occurs via similar pathways in BHK cells and SCG neurons. Whether the efficiency of assembly is similar in BHK cells and SCG neurons remains to be established. Neuronal-specific chaperone proteins that enhance expression of red and green opsins have been reported (Ferreria et al., 1996). Whether a similar mechanism exists to enhance the assembly of GABAA receptors is unknown. Finally, the ability to infect neurons with multiple Semliki Forest viruses expressing defined epitope-tagged receptor subunits should allow the assembly and trafficking of GABAA receptors to be studied in their native environments.
Footnotes
This work was supported by the Medical Research Council (UK) and the Wellcome trust.
Correspondence should be addressed to Dr Stephen J. Moss, Medical Research Council Laboratory of Molecular Cell Biology, University College London, Gordon Street, London WC1E 6BT, UK.


